Topic: Power BI
-
Let’s talk about matrix totals in this episode of The Whiteboard! Special guest: the SQLBI Whiteboard! Learn abstract DAX concepts in a more interactive way with “The Whiteboard” series. Read more: https://www.sqlbi.com/blog/marco/2022/07/14/the-whiteboard-video-series-on-sqlbi-youtube-channel/ #thewhiteboard Watch now
-
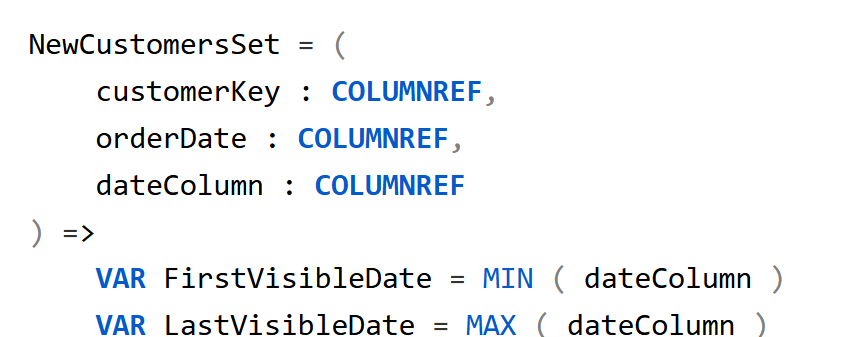
Code written by AI can contain many duplicate parts. User-defined functions are a great tool to simplify complex measures; this article shows how to leverage AI to build better DAX code. Read more
-
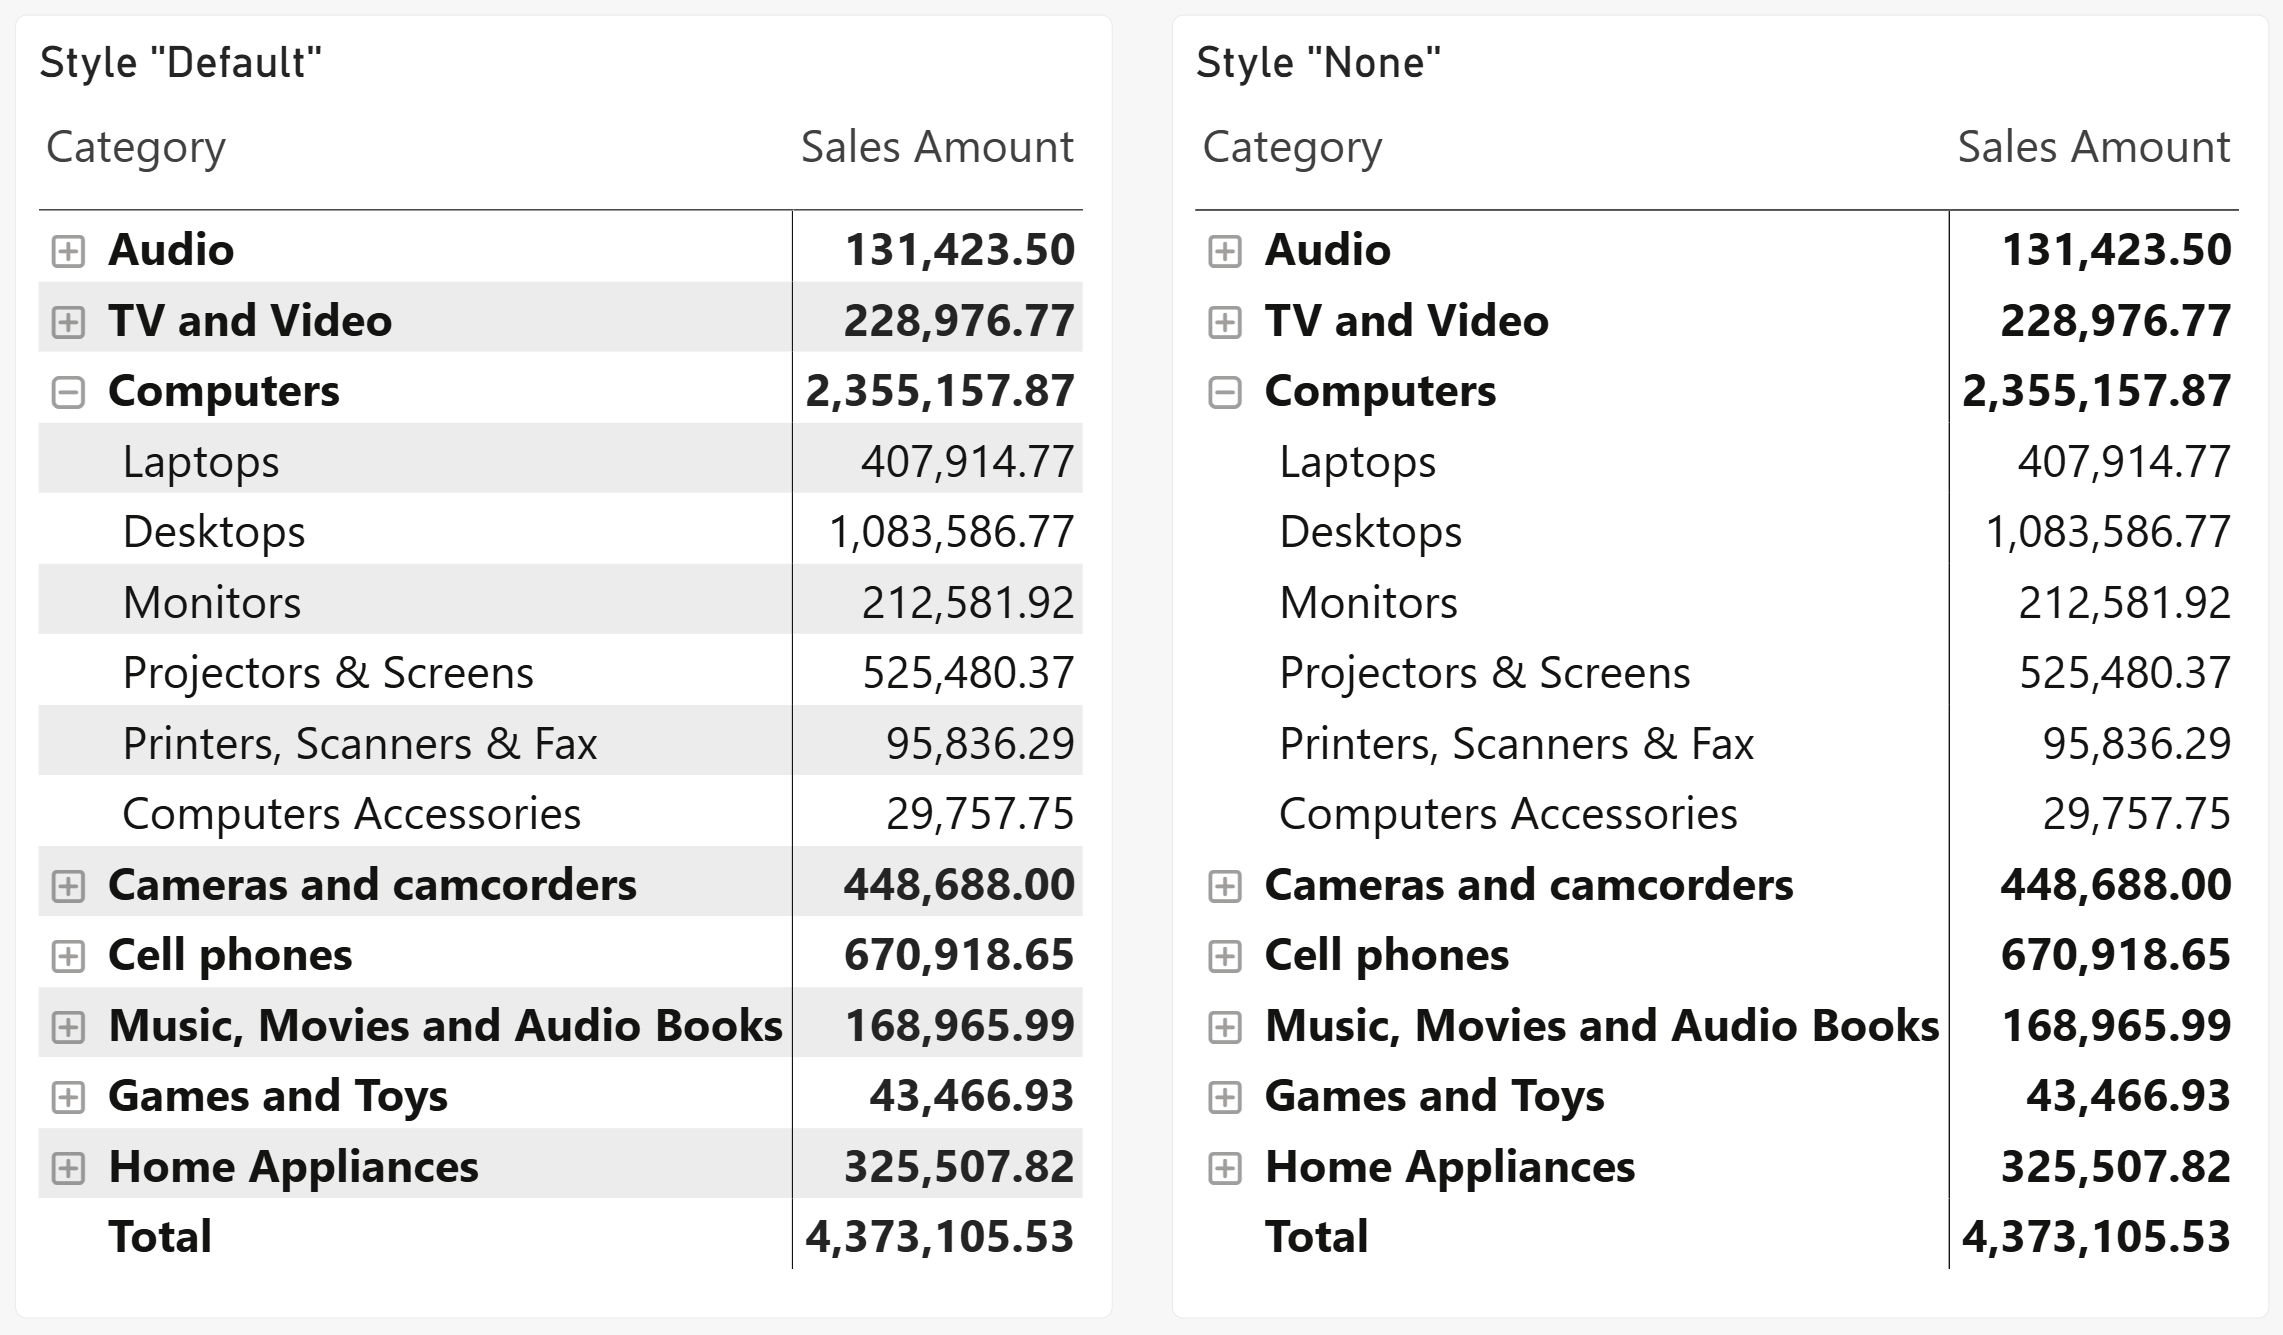
Microsoft recently introduced a new default visual design style for Power BI named Fluent 2. I personally disagree with a few choices in the new defaults, including the removal of alternating row colors from Table and Matrix visuals. However, the… Read more
-
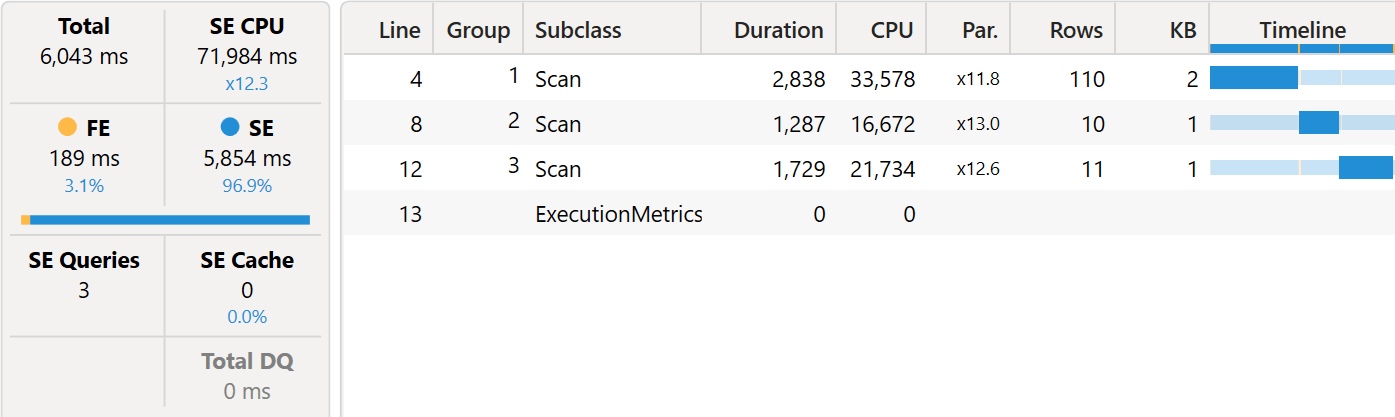
Visual calculations can either improve or degrade the performance of a report. In this article, we outline how we ensure visual calculations have a positive impact on performance. Read more
-
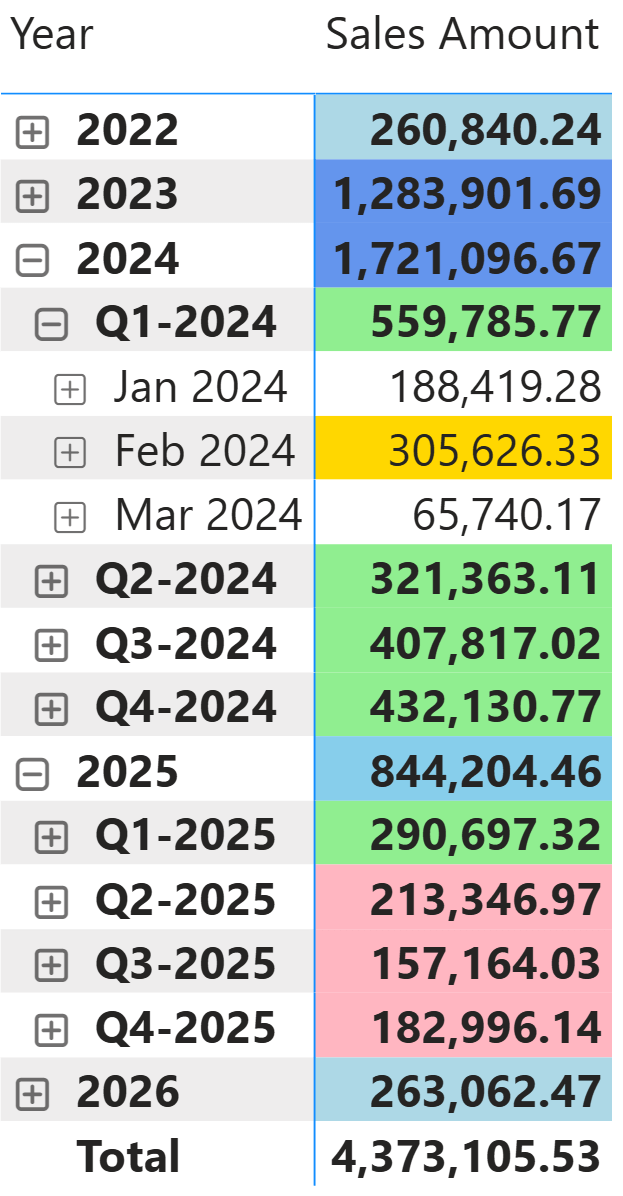
This article describes how to apply different formatting rules at each level of a hierarchy (one rule at the year level, another at the quarter level, another at the month level) using ISINSCOPE in a measure or ISATLEVEL in a… Read more
-
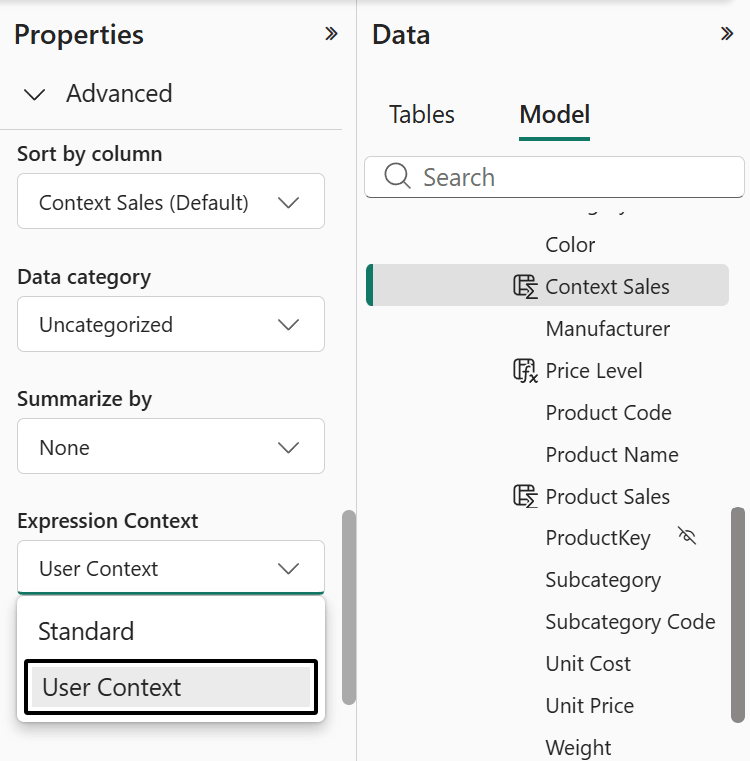
This article describes the new Expression Context property of calculated columns in Power BI, explaining how user-aware calculated columns work, why they are not materialized, and how to use them as virtual calculated columns for localization and custom security scenarios. Read more
-
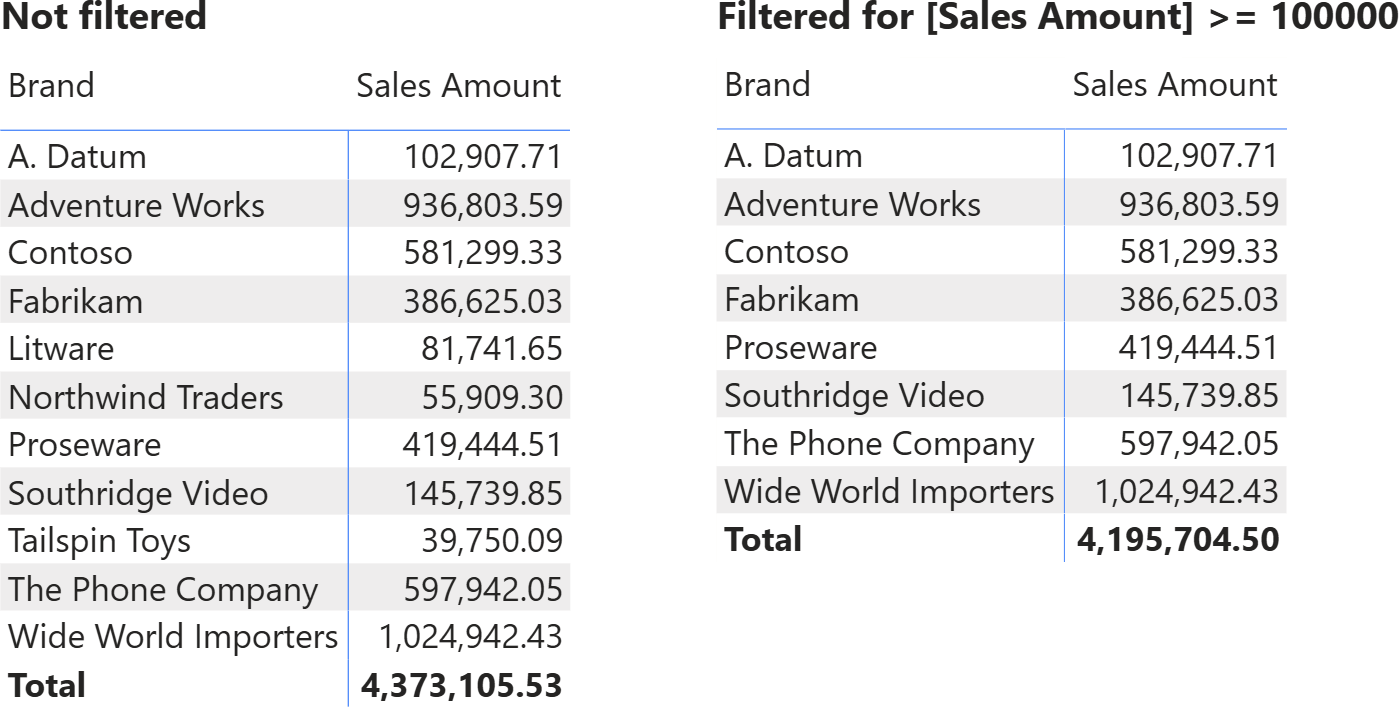
A slicer cannot filter a measure. In this article, we analyze this common request by explaining how to use a slicer to filter a measure, after discussing the real meaning of using a measure with a slicer. Read more
-
This video explains how to navigate the lattice of visual calculations in DAX. The visual context goes beyond the row context and filter context by adding the concept of levels within the lattice. The video shows how to use COLLAPSEALL… Watch now
-
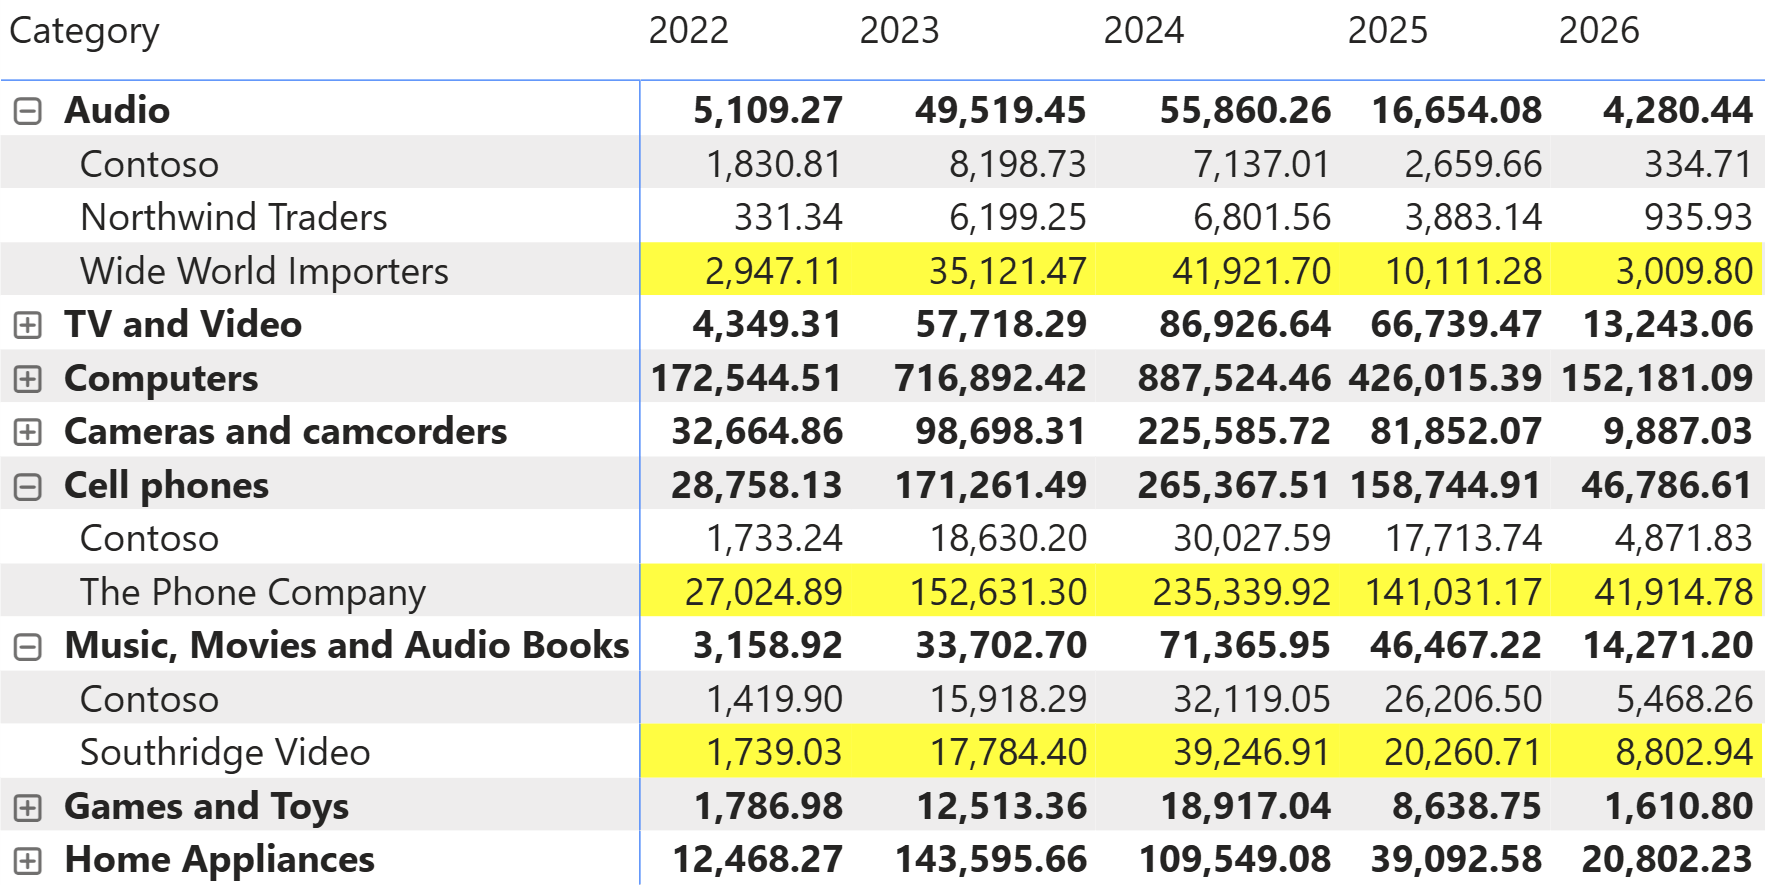
Visual calculations can be used efficiently to format visuals. This article presents an interesting technique to highlight a row based solely on the maximum value in the last column. Read more
-
Visual calculations are a new feature in DAX that aims to simplify the use of DAX for users by introducing calculations at the visual level rather than at the model level. Read more