 Marco Russo & Alberto Ferrari
A challenging requirement in Power BI reports is that of applying different formatting rules based on the level of aggregation. At the year level, the background shade may reflect each year's share of the grand total. At the quarter level, a status color may indicate whether the quarter is above or below the average. At the month level, the color may flag exceptional values, like months that contribute more than a defined threshold to their year. Each level has its own logic; what the conditional expression of the measure needs to know is which level the current cell belongs to.
Two DAX functions address this challenge: ISINSCOPE and ISATLEVEL. They look similar, but they live in different places. ISINSCOPE inspects the group-by columns of the query and is used within a measure that becomes part of the semantic model. ISATLEVEL inspects the visual layout and is used within a visual calculation that lives at the report layer. The choice between the two is about where the per-level logic should live, and not about which one detects the level correctly (both do).
In this article, we describe how to use both approaches to drive per-level formatting rules. We start with a matrix visual that applies a different background color rule at each level of a Year-Quarter-Month hierarchy. We then move to a report with a Synoptic Panel visual, where the principle is the same, but the hierarchy is different.
If you are new to ISINSCOPE and want to understand how it differs from HASONEVALUE, please look at the article, Distinguishing HASONEVALUE from ISINSCOPE.
The scenario: a different rule at each level
We start with a matrix that displays Sales Amount across the Year, Quarter, and Month levels of the Calendar hierarchy. Our goal is to drive the cell background color with three independent rules. At the year level, the shade reflects each year's share of the grand total: darker shades for years that contribute more, lighter shades for years that contribute less. At the quarter level, the cell turns green when the quarter's value is at or above the average quarter, and pink when it is below. At the month level, the cell is highlighted in gold only when that month contributes more than 15% towards that year's total, marking it as an exception.
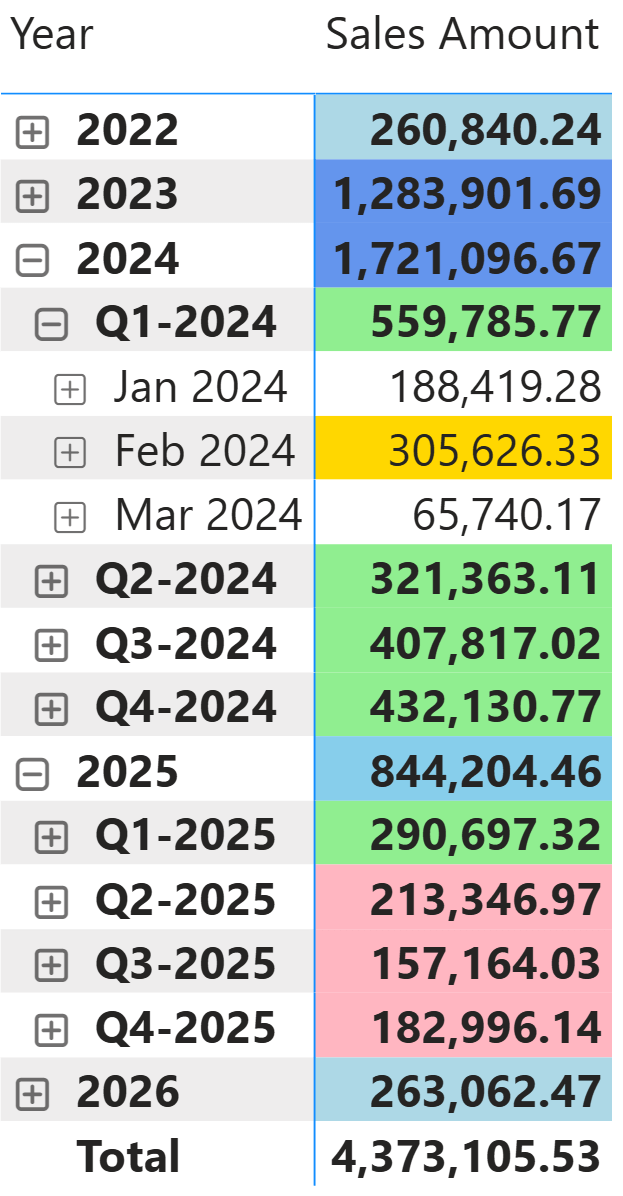
This treatment is not achievable with a single static rule applied to every cell, nor with a fixed color per level. Each level requires a calculation of its own. The expression must first detect the current level, then run the rule associated with that level. The expression can be either a measure in the semantic model or a visual calculation in the visual itself.
Using ISINSCOPE in a measure
ISINSCOPE returns TRUE when the specified column is currently used as a group-by column in the query. In a matrix, this corresponds to the column being either the row of the current cell or a column above it in the hierarchy. We use ISINSCOPE to dispatch each cell to the rule that applies to its level.
We define a measure that returns a color name, with one branch per level:
Level Color =
SWITCH (
    TRUE,

    -- Month level: highlight months exceeding 15% of their year
    ISINSCOPE ( 'Date'[Year Month] ) || ISINSCOPE ( 'Date'[Year Month Short] ),
        VAR MonthValue = [Sales Amount]
        VAR YearTotal =
            CALCULATE (
                [Sales Amount],
                REMOVEFILTERS ( 'Date' ),
                VALUES ( 'Date'[Year] )
            )
        VAR Share = DIVIDE ( MonthValue, YearTotal )
        RETURN
            IF ( Share > 0.15, "Gold", BLANK () ),

    -- Quarter level: green if at or above the average quarter, pink if below
    ISINSCOPE ( 'Date'[Year Quarter] ),
        VAR QuarterValue = [Sales Amount]
        VAR AverageQuarter =
            CALCULATE (
                AVERAGEX (
                    VALUES ( 'Date'[Year Quarter] ),
                    [Sales Amount]
                ),
                REMOVEFILTERS ( 'Date' )
            )
        RETURN
            IF ( QuarterValue >= AverageQuarter, "LightGreen", "LightPink" ),

    -- Year level: shade by share of grand total
    ISINSCOPE ( 'Date'[Year] ),
        VAR YearValue = [Sales Amount]
        VAR GrandTotal =
            CALCULATE ( [Sales Amount], REMOVEFILTERS ( 'Date' ) )
        VAR Share = DIVIDE ( YearValue, GrandTotal )
        RETURN
            SWITCH (
                TRUE,
                Share > 0.40, "SteelBlue",
                Share > 0.25, "CornflowerBlue",
                Share > 0.15, "SkyBlue",
                "LightBlue"
            )
)
The order of the conditions inside the outer SWITCH is important. When the current cell in the report is at the month level, ISINSCOPE returns TRUE for Year Month Short, Year Quarter, and Year, because all three columns are in scope. We test from the most specific level to the most general, so the first match identifies the actual current level and runs the rule that belongs to it. The code checks two columns for the month level (Year Month and Year Month Short) because the model has two versions: the full month name and the short 3-letter name, which is the one used in the previous screenshot.
Each branch is self-contained. The month branch uses the REMOVEFILTER / VALUES pattern to obtain the year total (read Using ALLEXCEPT versus ALL and VALUES for more details about the pattern); the quarter branch averages Sales Amount across all quarters in the model; the year branch divides the year value by the grand total. The functions used within each branch are standard DAX and available in any measure of the semantic model.
The logic implemented at the quarter and year levels compares values against the model totals, ignoring slicers that could limit the date range shown in the visual. If the comparison should consider only the time period displayed in the visual, we could use ALLSELECTED instead of REMOVEFILTERS in the expressions at the quarter and year levels.
The measure is now part of the semantic model and is available to any report that uses it. The advantage is reusability across reports; the cost is that only someone with semantic model authoring rights can create it.
Using ISATLEVEL in a visual calculation
ISATLEVEL serves the same dispatching purpose, but it uses a different mechanism. ISATLEVEL indicates whether a column is visible at the current level of the visual. While ISINSCOPE inspects the group-by columns of the query, ISATLEVEL inspects the visual layout (technically, it is the VISUAL SHAPE of the query). ISATLEVEL is designed for visual calculations, which are defined in the report layer of a specific visual and do not require any change to the semantic model.
The structure of the expression is the same SWITCH dispatch on the current level, this time using ISATLEVEL:
Visual Level Color =
SWITCH (
    TRUE,

    -- Month level: highlight months exceeding 15% of their year
    ISATLEVEL ( [Year-Quarter-Month Month] ),
        VAR MonthValue = [Sales Amount]
        VAR YearTotal = COLLAPSE ( [Sales Amount], [Year-Quarter-Month Quarter] )
        VAR Share = DIVIDE ( MonthValue, YearTotal )
        RETURN
            IF ( Share > 0.15, "Gold", BLANK () ),

    -- Quarter level: green if at or above the average quarter, pink if below
    ISATLEVEL ( [Year-Quarter-Month Quarter] ),
        VAR QuarterValue = [Sales Amount]
        VAR AverageQuarter =
            CALCULATE (
                AVERAGEX (
                    ROWS,
                    [Sales Amount]
                )
            )
        RETURN
            IF ( QuarterValue >= AverageQuarter, "LightGreen", "LightPink" ),

    -- Year level: shade by share of grand total
    ISATLEVEL ( [Year-Quarter-Month Year] ),
        VAR YearValue = [Sales Amount]
        VAR GrandTotal =
            COLLAPSEALL ( [Sales Amount], ROWS )
        VAR Share = DIVIDE ( YearValue, GrandTotal )
        RETURN
            SWITCH (
                TRUE,
                Share > 0.40, "SteelBlue",
                Share > 0.25, "CornflowerBlue",
                Share > 0.15, "SkyBlue",
                "LightBlue"
            )
)
The reference syntax [Year-Quarter-Month Month] corresponds to the column as it appears in the matrix visual. The exact name depends on how the hierarchy is configured in the visual. Keep in mind that ISATLEVEL takes a visual reference, not a model column path.
Inside each branch, the per-level arithmetic is the same as in the measure version, but the building blocks are visual-aware. In a visual calculation, we obtain the year total of a month row by collapsing the visual up to the year level with COLLAPSE; we obtain the grand total by collapsing all the way up with COLLAPSEALL. The arithmetic is identical, but it is expressed in terms of the visual matrix rather than the model.
The result matches the version driven by the ISINSCOPE measure. This is not a coincidence: in a standard hierarchical matrix, the visual shape mirrors the group-by columns of the query, so the dispatch reaches the same branch, and the per-level arithmetic produces the same value. The semantic model, however, is unchanged. The entire logic lives in the report and can be modified by a report developer who does not have authoring rights over the semantic model.
Another difference worth mentioning is that the results are identical because we did not filter out any dates outside the matrix visual. If we did that, for example, by filtering only a few years, the results would differ because the visual calculation only considers the visible periods, whereas the measure we implemented always compares the displayed values against the full model. While for the visual calculation we have no choice, for the measure we could have implemented a calculation that is local to the visual by using ALLSELECTED instead of REMOVEFILTERS in the quarter and year levels, as we mentioned in the previous section.
A Synoptic Panel demo
The matrix is the simplest scenario because the hierarchy is a familiar calendar. To show that the same principle applies in a completely different context, we move to the Synoptic Panel custom visual, which has been created by OKVIZ, a sister company of SQLBI. Synoptic Panel displays measures over an image, associating values with regions drawn on the image. The hierarchy involved is not a calendar hierarchy, but the different levels that group tickets sold in a large venue (we simulated The Sphere in Las Vegas for this example). The individual seats are grouped by sector, and the sectors are grouped by category.
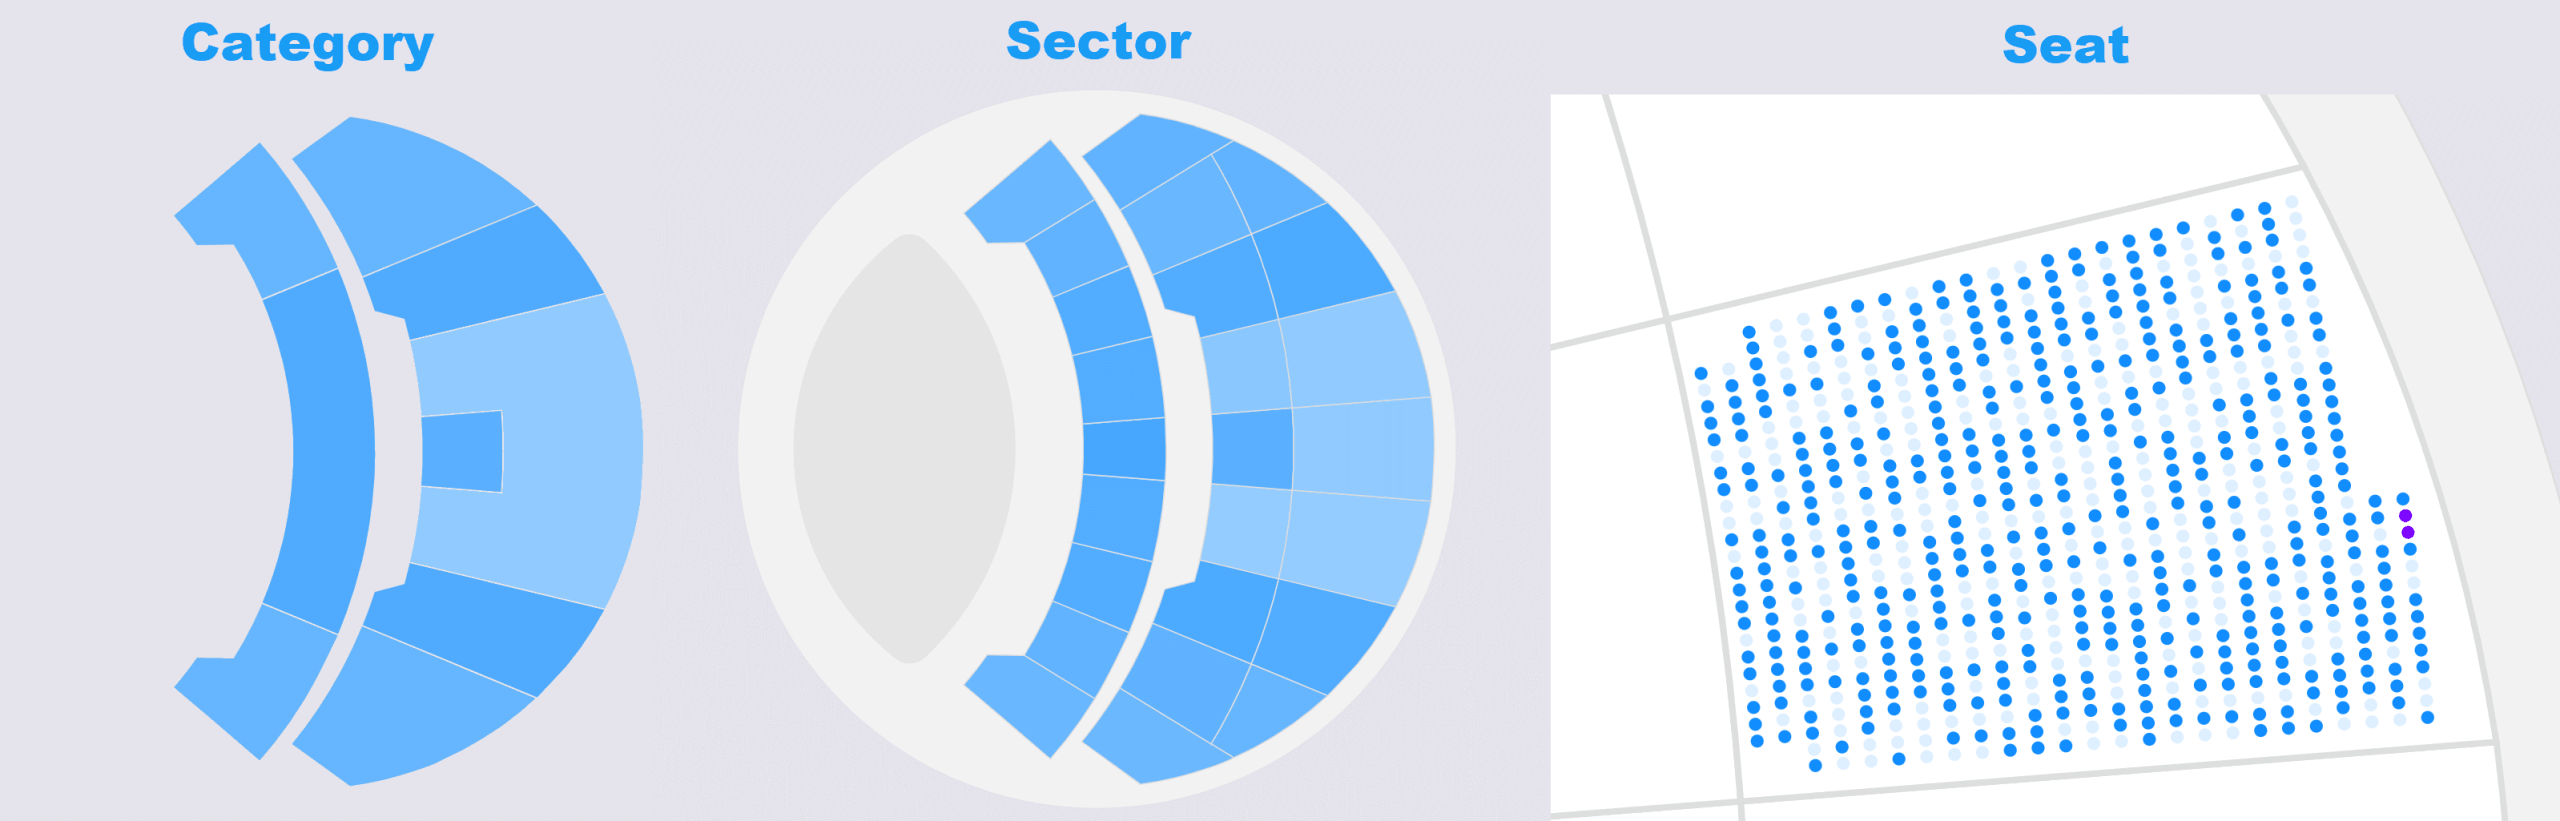
The business logic required is the following:
- Category: gradient according to occupation % for selected events
- Sector: gradient according to occupation % for selected events
- Seat: full color if there is at least one ticket sold for the selected events
The % Occupation measure is assigned to the Custom Color property for the areas. However, the behavior of that measure depends on the level displayed in the visual, which is detected by using ISINSCOPE:
% Occupation =
VAR AverageTicketEvent = DIVIDE ( [# Tickets], [# Events] )
RETURN SWITCH (
    TRUE,
    ISINSCOPE ( Seats[Seat] ),
        (AverageTicketEvent > 0) * 1,
    ISINSCOPE ( Seats[Sector] ) || ISINSCOPE ( Seats[Category] ),
        DIVIDE ( AverageTicketEvent, [Tot seats] ),
    BLANK()
)
The expression follows the same pattern as the one we used in the matrix earlier: a SWITCH dispatch with one branch per level, and a different calculation inside each branch. In this case, we used the same algorithm for two levels, Sector and Category.
The same algorithm can be implemented as a visual calculation; in this case, the # Tickets and # Events measures must be included as hidden measures in the visual to be available as columns in the visual calculation:
Occupation Visual Calc =
VAR AverageTicketEvent = DIVIDE ( [# Tickets], [# Events] )
RETURN SWITCH (
    TRUE,
    ISATLEVEL ( [Seat] ),
        (AverageTicketEvent > 0) * 1,
    ISATLEVEL ( [Sector] ) || ISATLEVEL ( [Category] ),
        DIVIDE ( AverageTicketEvent, [Tot seats] ),
    BLANK()
)
The difference is in where the logic lives and not in the result. The measure-based approach adds an artifact to the semantic model. The visual calculation approach keeps the logic confined to the visual, even though we must include in the visual the measures that provide the information to implement the algorithm (# Tickets, # Events, and Tot seats).
Choosing between the two approaches
The choice between ISINSCOPE in a measure and ISATLEVEL in a visual calculation is about where the per-level logic should live, not a question of correctness.
A measure with ISINSCOPE is the natural choice when we own the semantic model, and we want the level-detection logic to be reusable across multiple reports and visuals. The measure becomes part of the shared model and can be referenced anywhere. Moreover, ISINSCOPE is the mandatory choice if the format logic needs data not represented in the visual, because a visual calculation cannot access other data in the model.
A visual calculation with ISATLEVEL is the natural choice when we cannot or do not want to modify the semantic model. This is a common situation for a report developer who is consuming a shared dataset or who is building a report on top of a Power BI semantic model published by another team. In these cases, the developer does not have the rights to add measures to the model. An alternative could be to create a composite model solely to define additional measures to support formatting; however, this approach also requires the rights to create and publish a new semantic model, which could be another limiting factor. A visual calculation keeps the logic local to the report and does not require additional permissions.
Surprisingly, even when the developer owns the semantic model and has all necessary rights, a visual calculation may still be preferable for purely presentation-related logic. A per-level coloring expression is closer to the visual than to the data. Keeping it in the visual calculation avoids cluttering the semantic model with measures that have no analytical meaning beyond a specific visual.
Finally, from a performance standpoint, a visual calculation is usually preferable because it operates on the smaller set of rows used to populate the visual, whereas a measure could require additional internal queries, thus resulting in slower reports.
Conclusions
Dynamic formatting by hierarchy level becomes useful when each level has its own rule: share-of-total shading at one level, status comparison at another, exception highlight at a third. The pattern is always the same: a SWITCH detects the current level and runs the appropriate rule; however, detection can occur at two different architectural layers of the report.
ISINSCOPE is used in model measures and inspects the group-by columns of the query. ISATLEVEL inspects the visual layout and is used in visual calculations that live at the report layer. Both detect the level correctly in a matrix and in a Synoptic Panel; both can produce the same visible result.
For a model developer building a reusable artifact, ISINSCOPE is the natural option in a measure. For a report developer working on a shared dataset without the ability to modify the model, ISATLEVEL in a visual calculation is the practical choice. The choice between the two is about where the per-level logic should live.

Returns true when the specified column is the level in a hierarchy of levels.
ISINSCOPE ( <ColumnName> )
Report whether the column is present at the current level.
ISATLEVEL ( <Column> )
Returns true when there's only one value in the specified column.
HASONEVALUE ( <ColumnName> )
Returns different results depending on the value of an expression.
SWITCH ( <Expression>, <Value>, <Result> [, <Value>, <Result> [, … ] ] [, <Else>] )
When a column name is given, returns a single-column table of unique values. When a table name is given, returns a table with the same columns and all the rows of the table (including duplicates) with the additional blank row caused by an invalid relationship if present.
VALUES ( <TableNameOrColumnName> )
Returns all the rows in a table, or all the values in a column, ignoring any filters that might have been applied inside the query, but keeping filters that come from outside.
ALLSELECTED ( [<TableNameOrColumnName>] [, <ColumnName> [, <ColumnName> [, … ] ] ] )
Clear filters from the specified tables or columns.
REMOVEFILTERS ( [<TableNameOrColumnName>] [, <ColumnName> [, <ColumnName> [, … ] ] ] )
Retrieves a context with removed detail levels compared to the current context. With an expression, returns its value in the new context, allowing navigation up hierarchies and calculation at a coarser level of detail.
COLLAPSE ( [<Expression>] [, <Axis>] [, <Column> [, <Column> [, … ] ] ] [, <N>] )
Retrieves a context with removed detail levels along an axis. With an expression, returns its value in the new context, enabling navigation to the highest level on the axis and is the inverse of EXPANDALL.
COLLAPSEALL ( [<Expression>], <Axis> )