Topic: Power BI
-
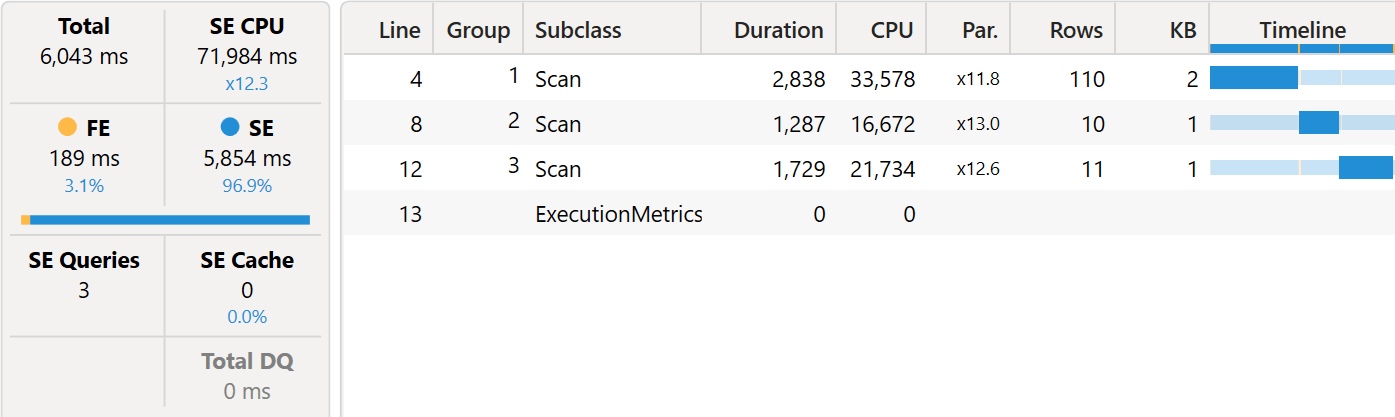
Visual calculations can either improve or degrade the performance of a report. In this article, we outline how we ensure visual calculations have a positive impact on performance. Read more
-
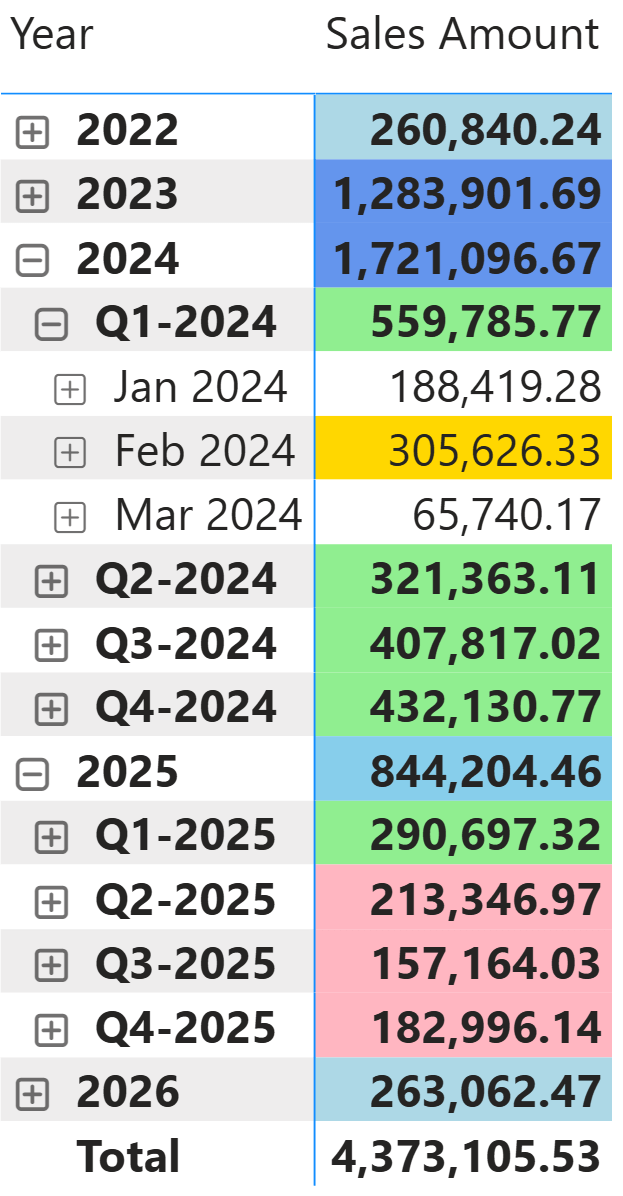
This article describes how to apply different formatting rules at each level of a hierarchy (one rule at the year level, another at the quarter level, another at the month level) using ISINSCOPE in a measure or ISATLEVEL in a… Read more
-
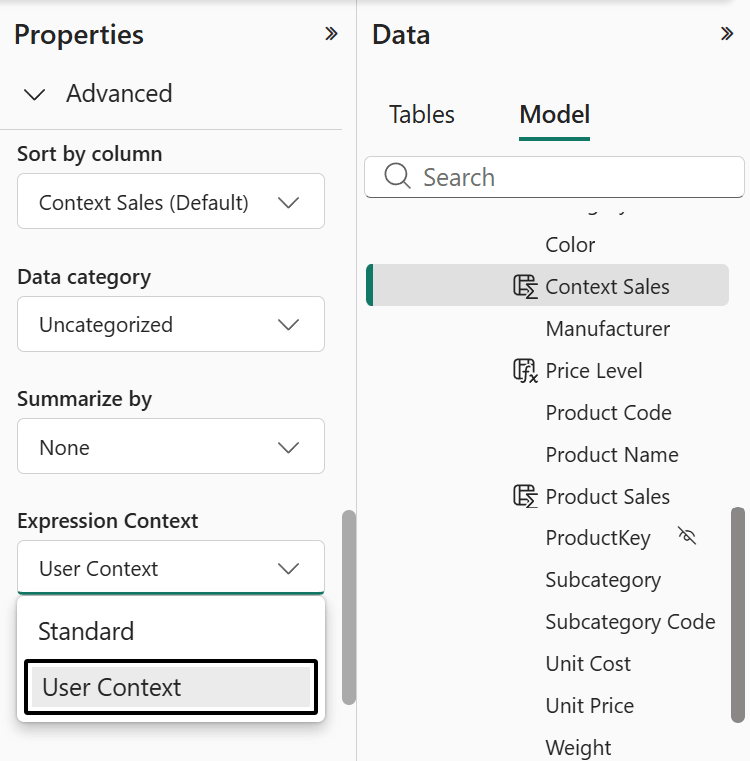
This article describes the new Expression Context property of calculated columns in Power BI, explaining how user-aware calculated columns work, why they are not materialized, and how to use them as virtual calculated columns for localization and custom security scenarios. Read more
-
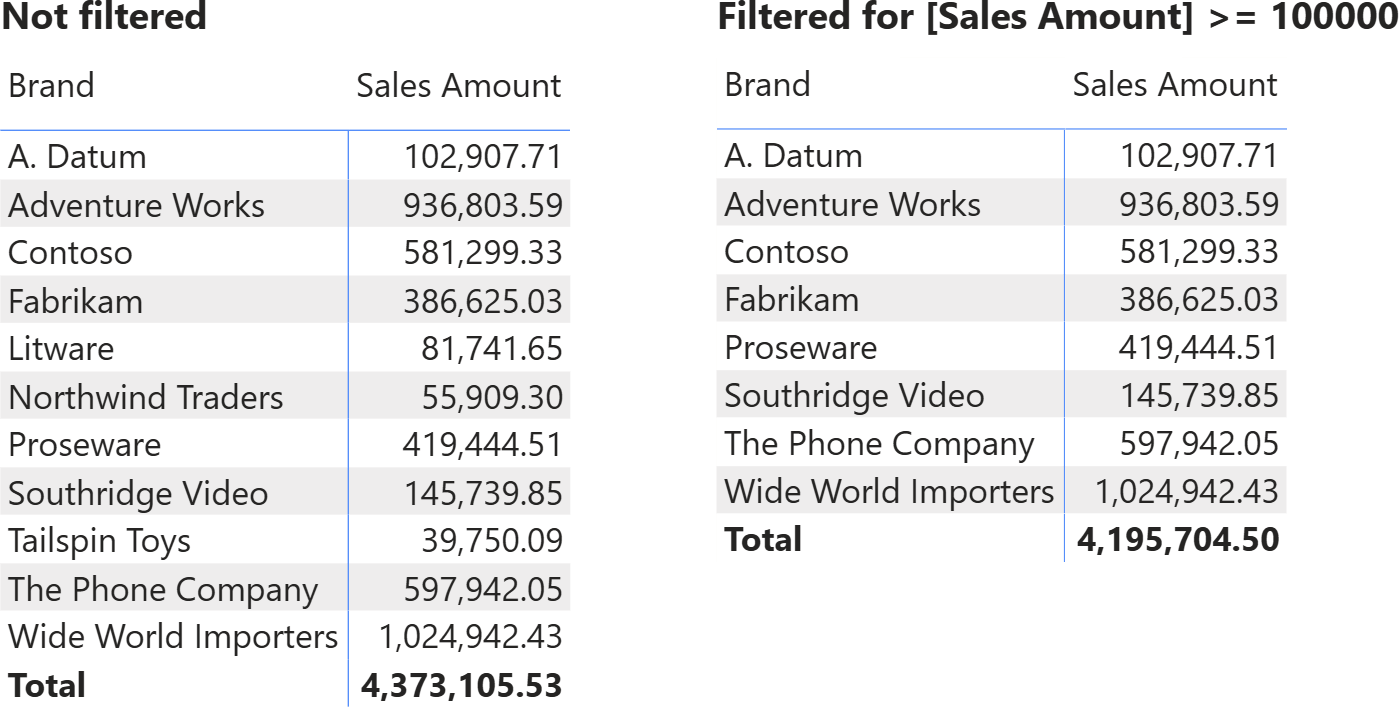
A slicer cannot filter a measure. In this article, we analyze this common request by explaining how to use a slicer to filter a measure, after discussing the real meaning of using a measure with a slicer. Read more
-
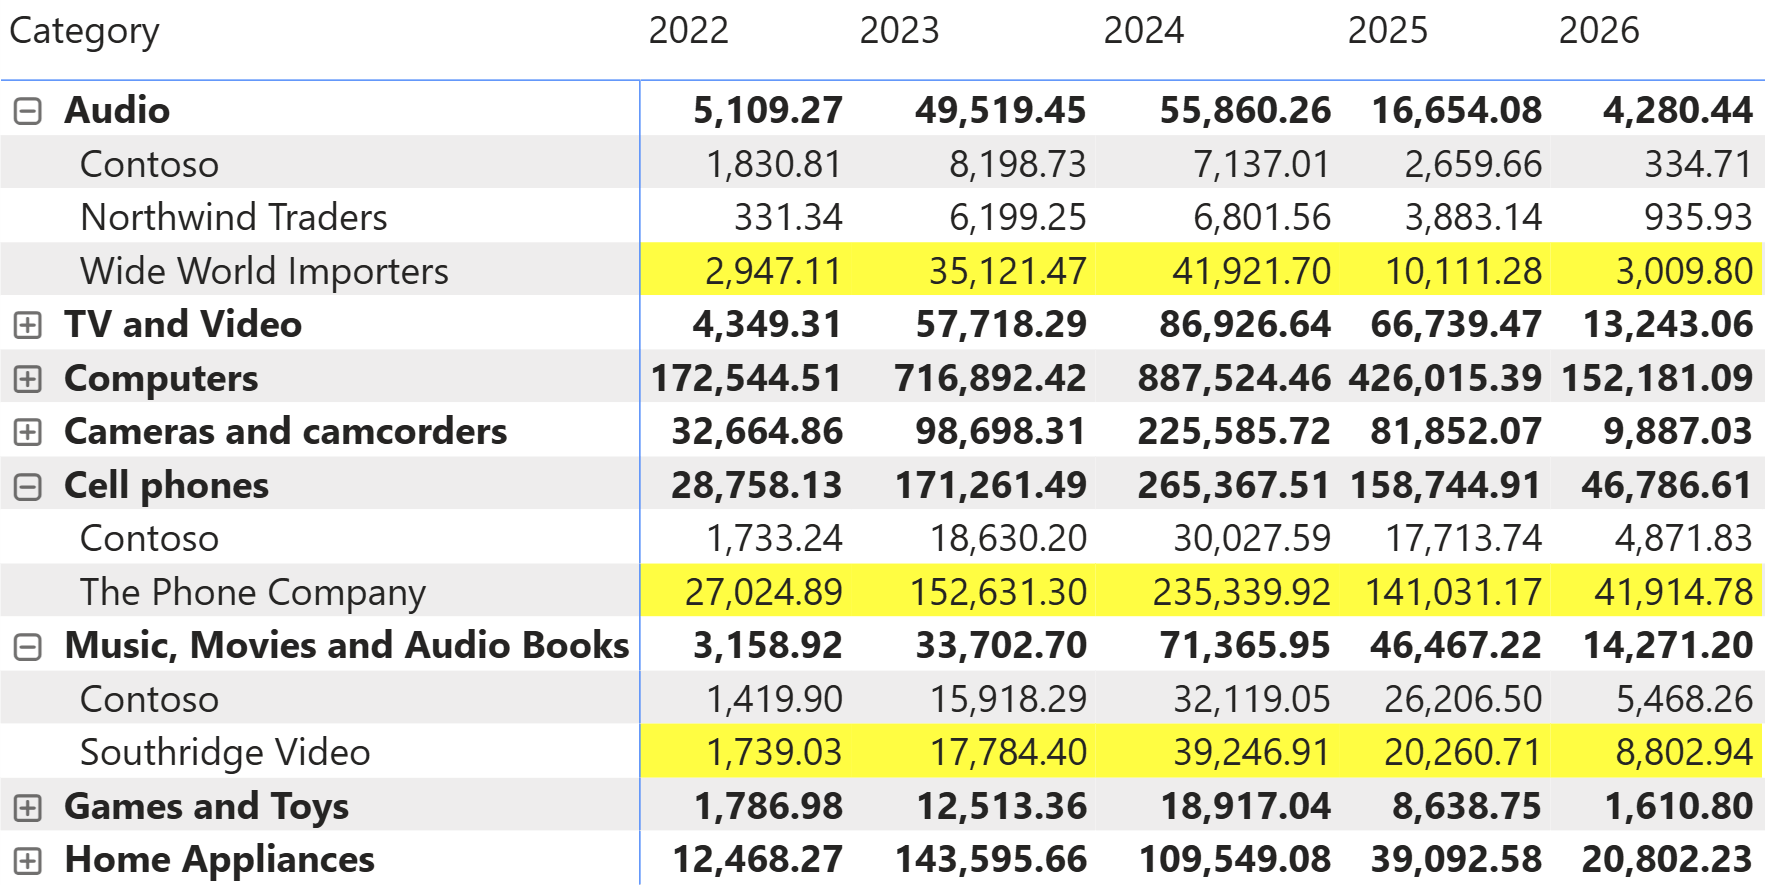
Visual calculations can be used efficiently to format visuals. This article presents an interesting technique to highlight a row based solely on the maximum value in the last column. Read more
-
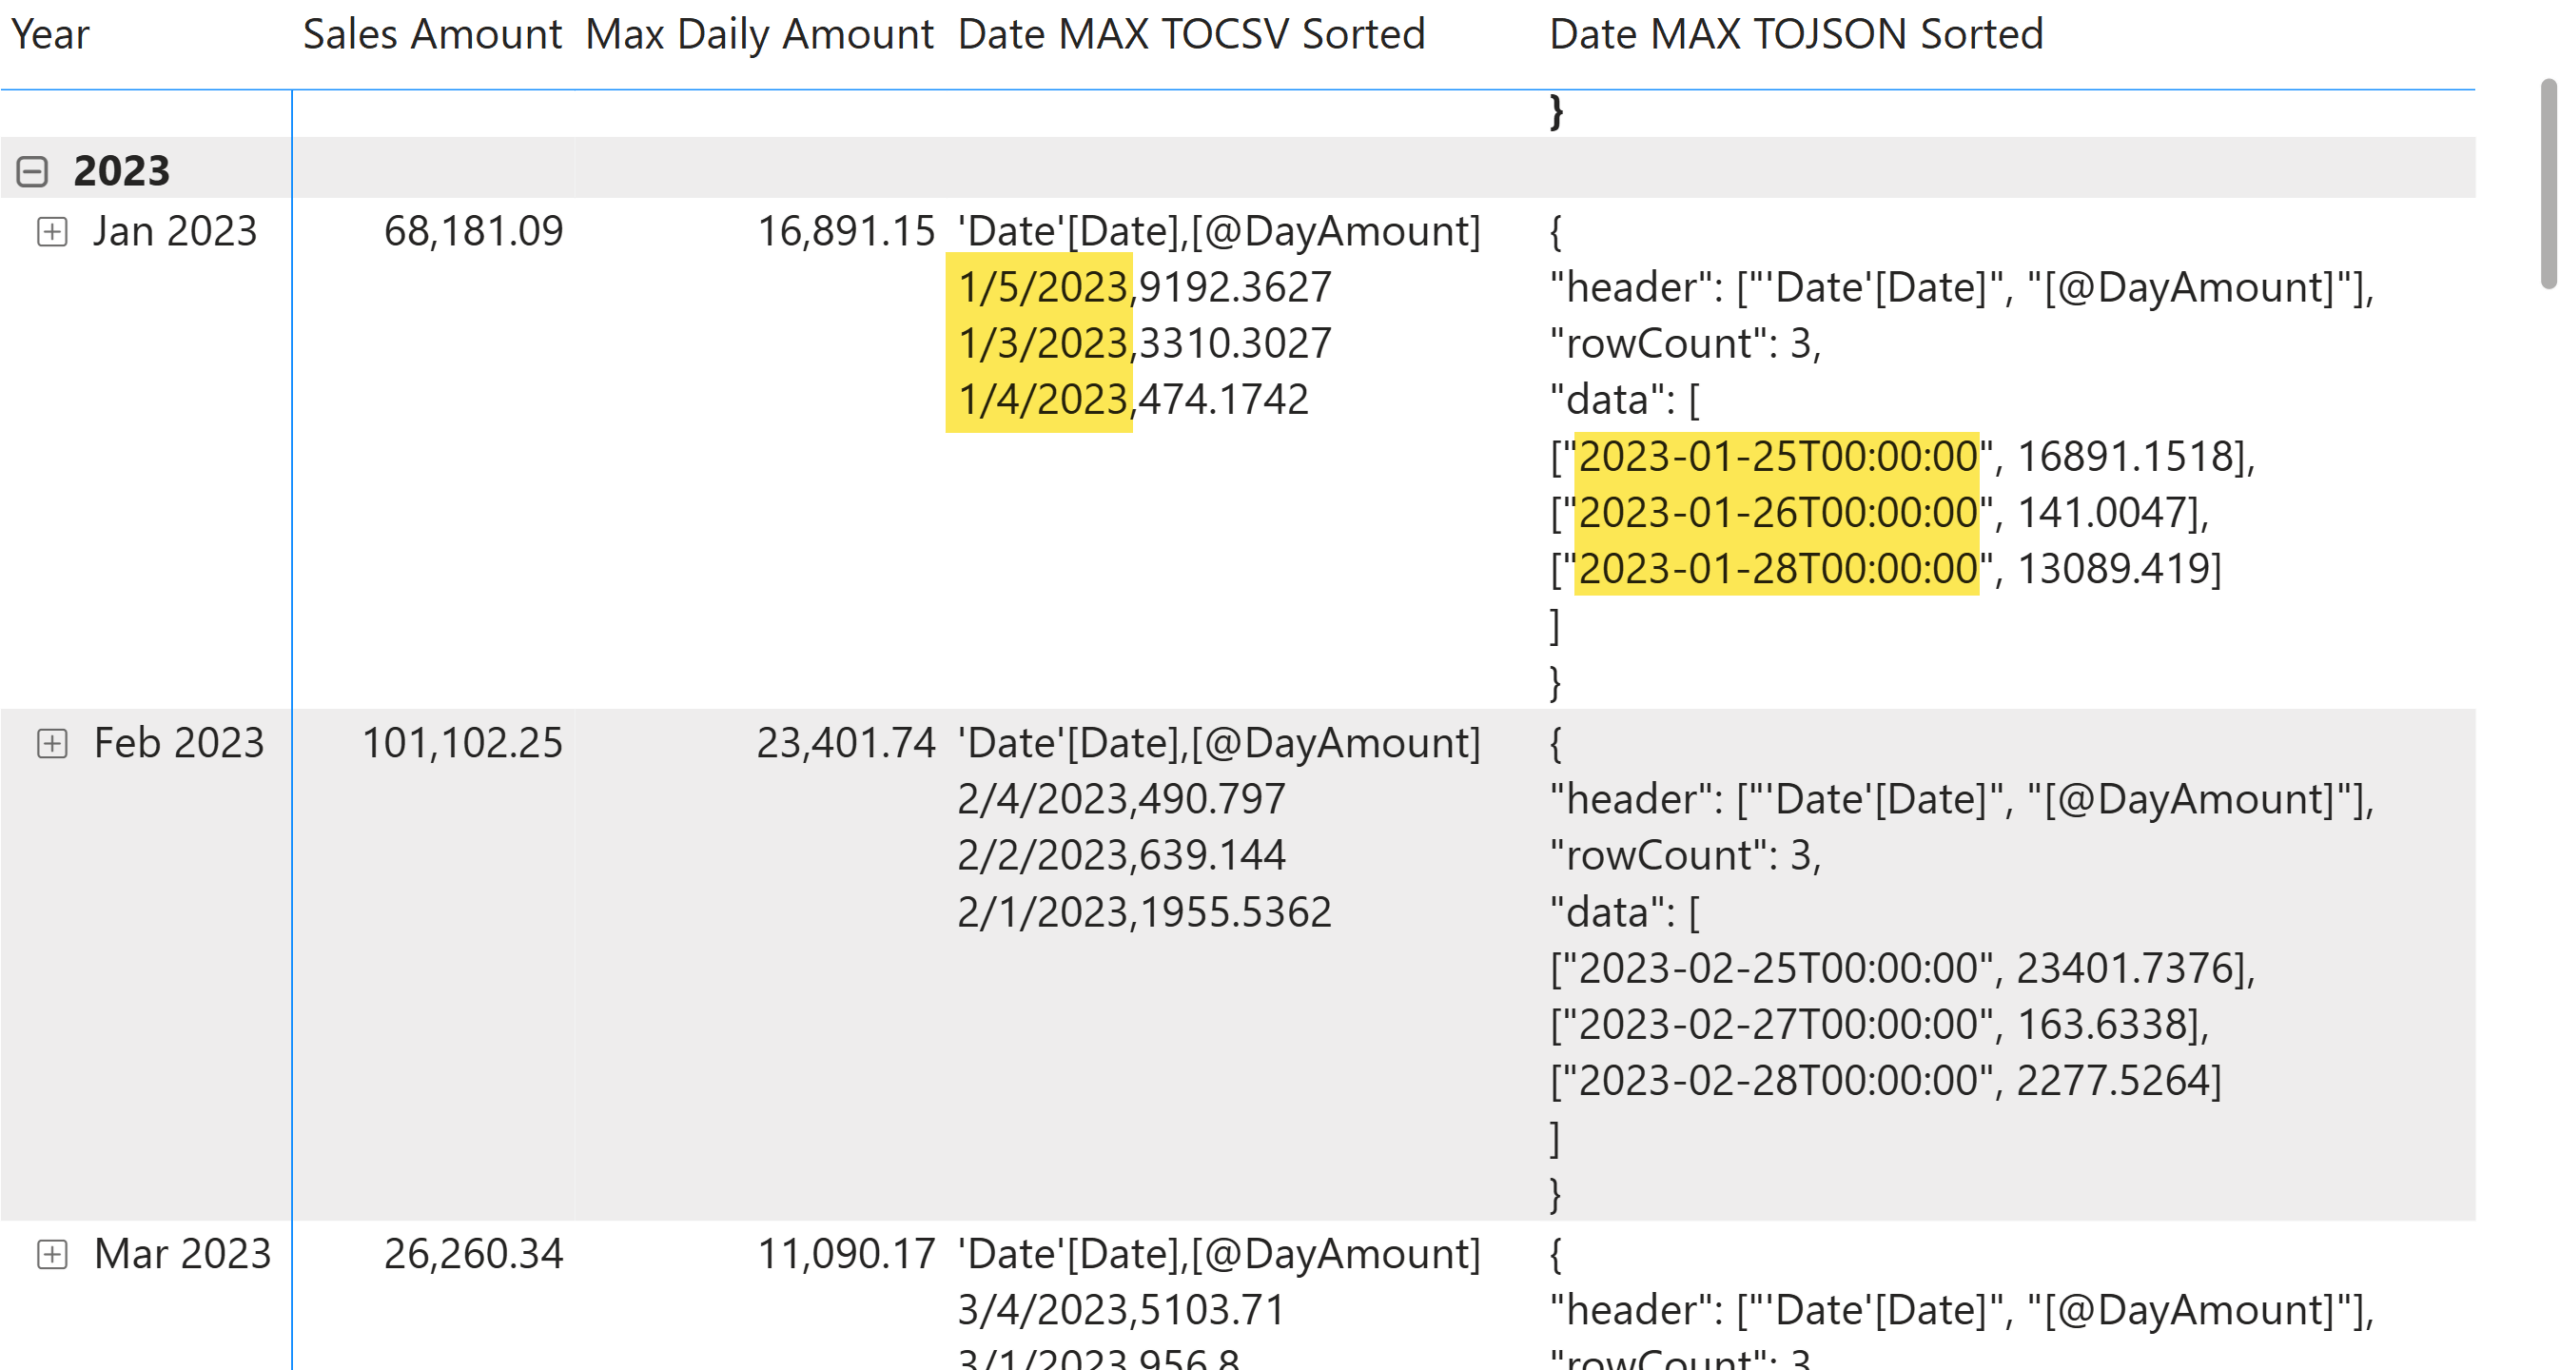
This article describes how to use the TOJSON and TOCSV functions to inspect the content of intermediate table variables when debugging a DAX measure. Read more
-
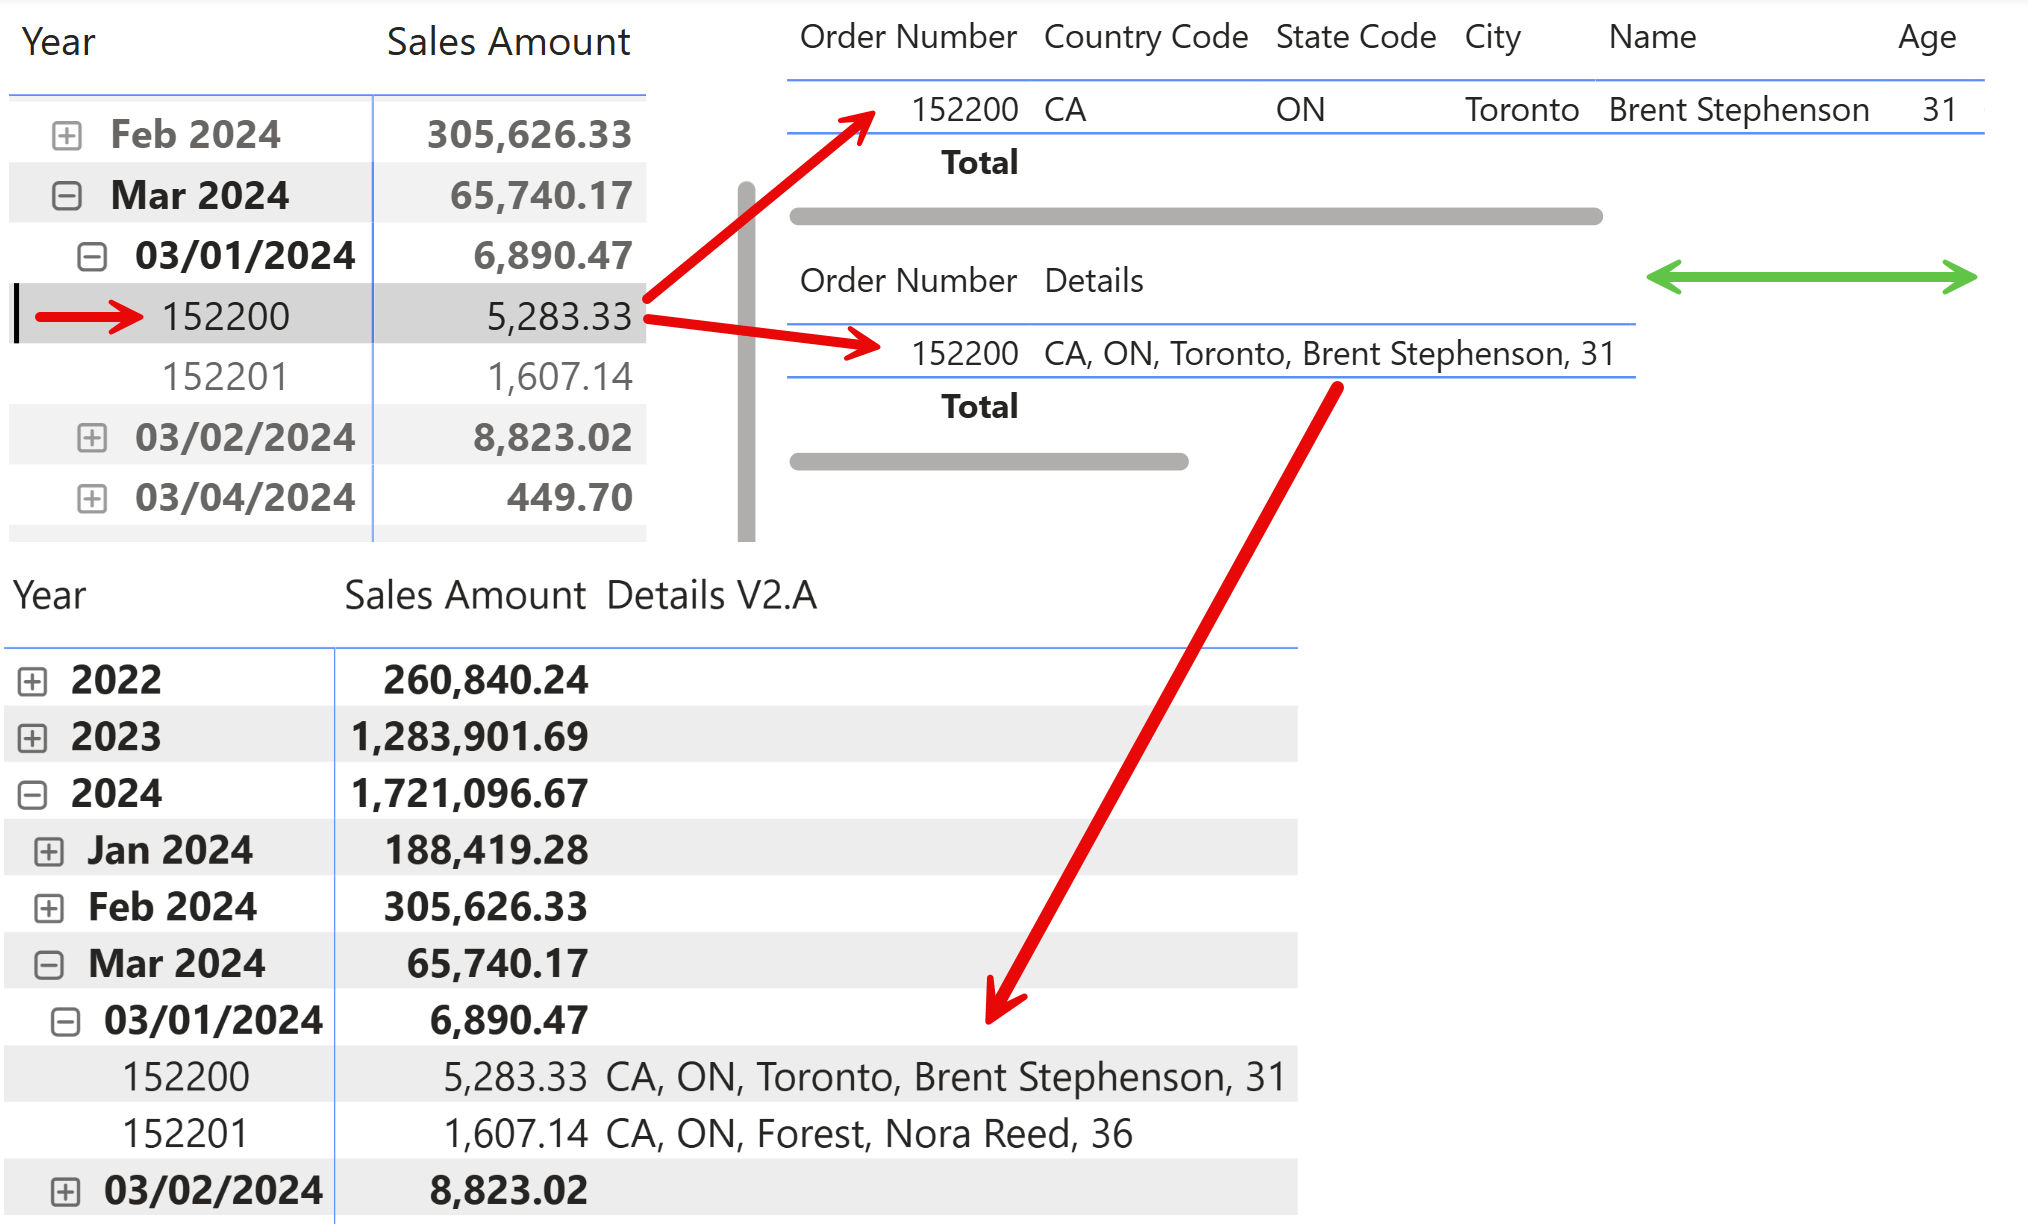
This article shows how to create a DAX measure that displays information from multiple columns in a business entity or transaction, into a single column of a matrix. Read more
-
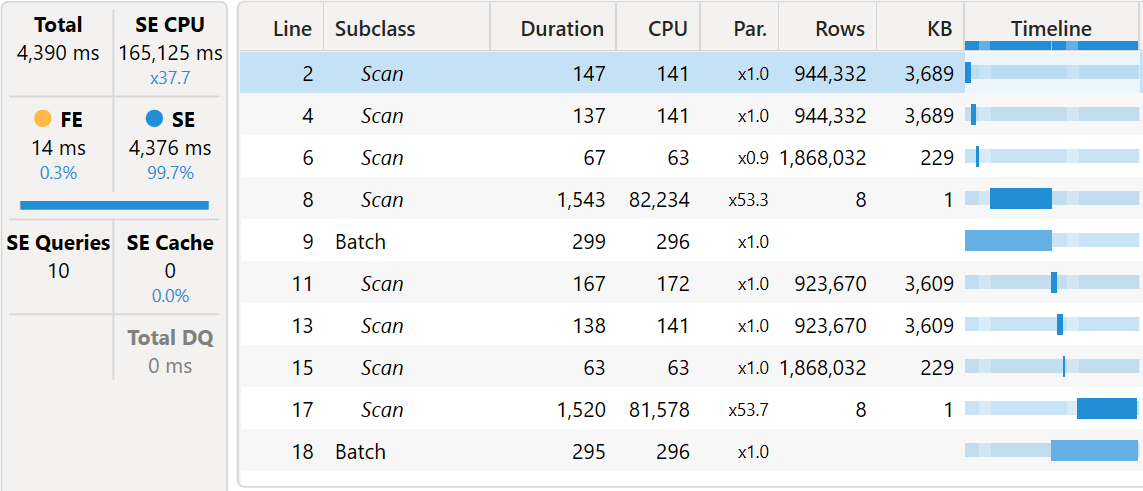
This article analyzes the performance of regular versus limited relationships in DAX to understand the implications of using limited relationships. Read more
-
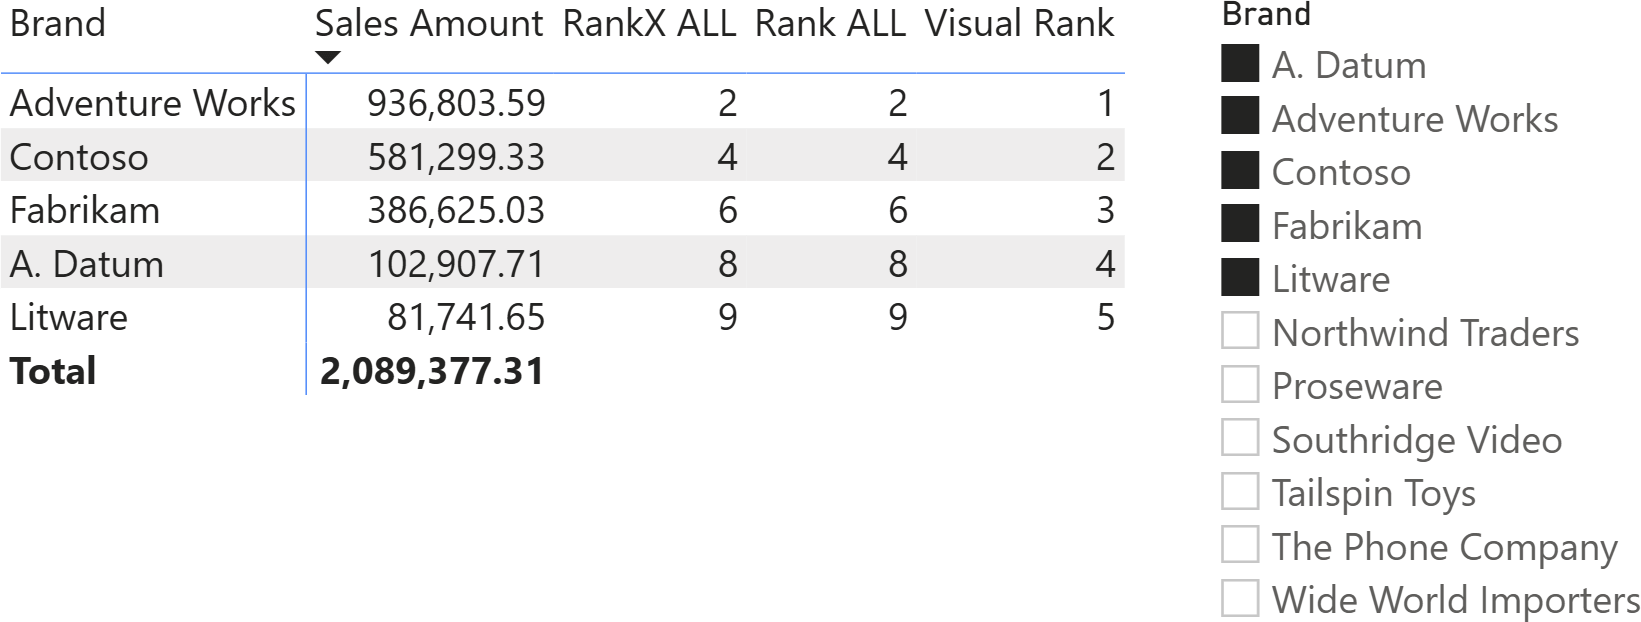
Should you use RANK or stick with RANKX? In which scenarios is one better than the other? This article provides an in-depth analysis to help readers make informed choices. Read more
-
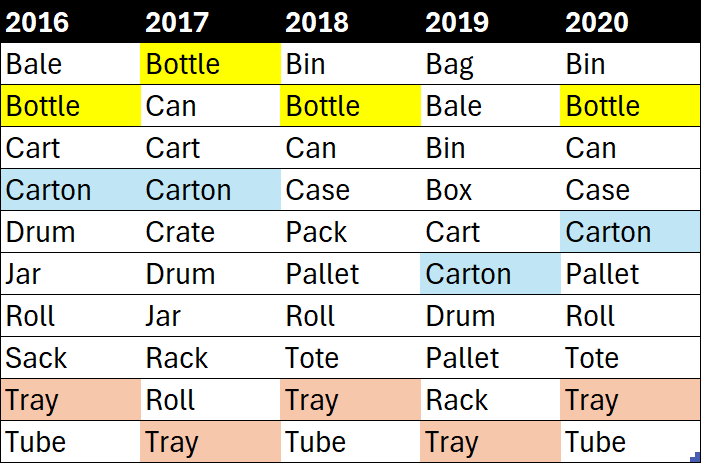
This article outlines the process of creating a measure to identify the top 10 products by sales each year. Read more