 Kurt Buhler
Format strings greatly improve the usefulness of your model, particularly when you apply custom and dynamic format strings creatively. However, there are considerations to keep in mind.
It is important that the values in a report display for users as they expect. Effective formatting of DAX measures and table columns improves your model, as values are easier to read and interpret. While formatting may seem simple at first glance, the flexibility of DAX and format strings in Power BI can create many opportunities for more creative and efficient tables or visuals.
How to format measures and columns in Power BI Desktop
Consider the following three simple examples for video streaming data. The unformatted values of the top cards are more difficult to read than the formatted values at the bottom.
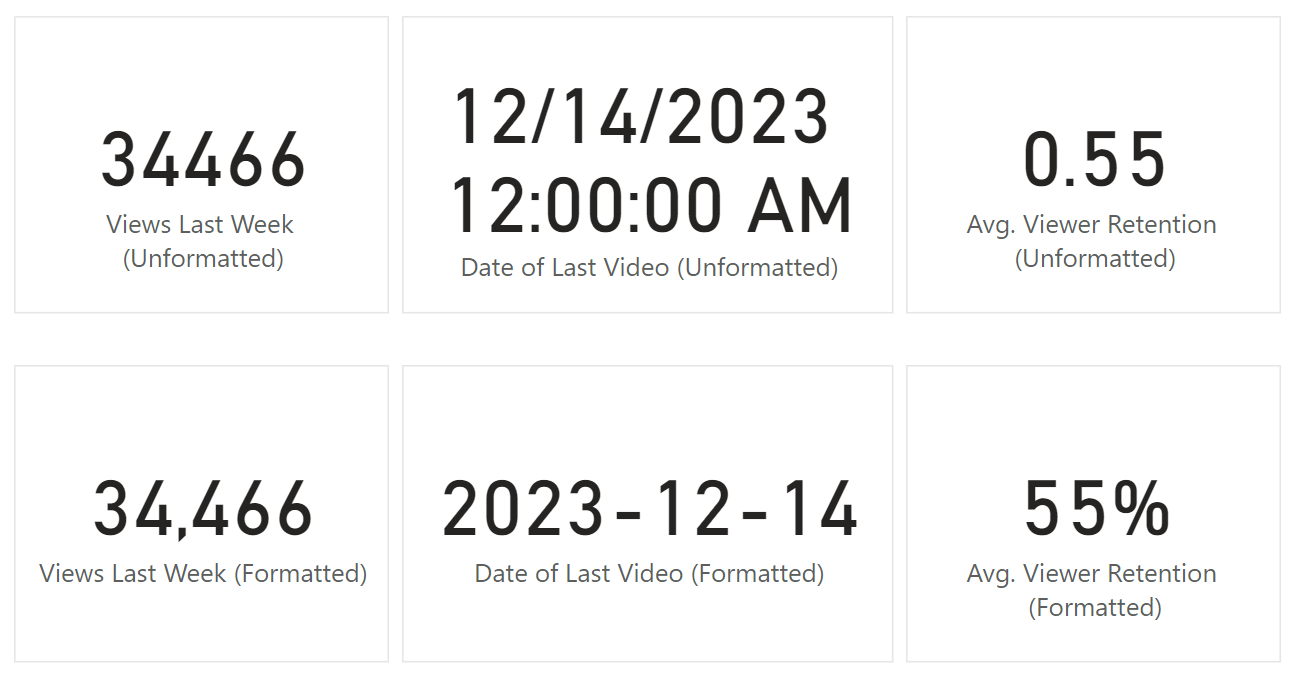
To achieve the formatting of the bottom cards in these simple examples, you can change the format by using the “Formatting” part of the “Measure Tools” ribbon, when selecting a DAX measure or “Column Tools” when selecting a table column.
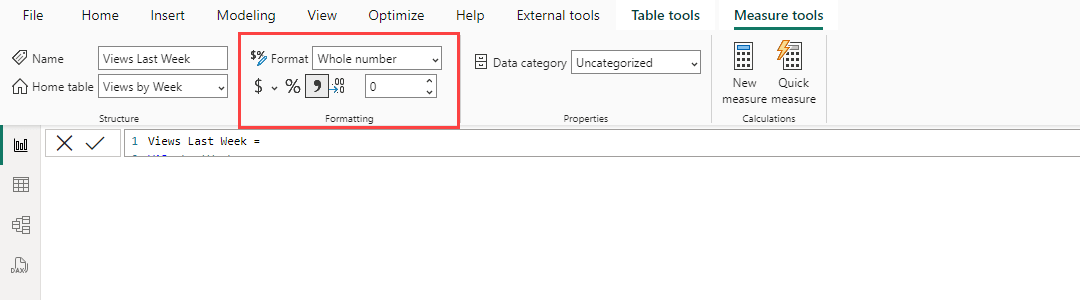
Note that any formatting changes that you make to measures and columns will have no effect upon your underlying data. For instance, reducing the decimal places does not reduce precision (or model size). To do this, you must transform the data by using Power Query, or other, upstream ETL tools.
These formatting options available from the Power BI Desktop ribbon are limited to a small number of frequently used options. However, there are cases where you need a more customized or advanced value formatting, like the examples below.
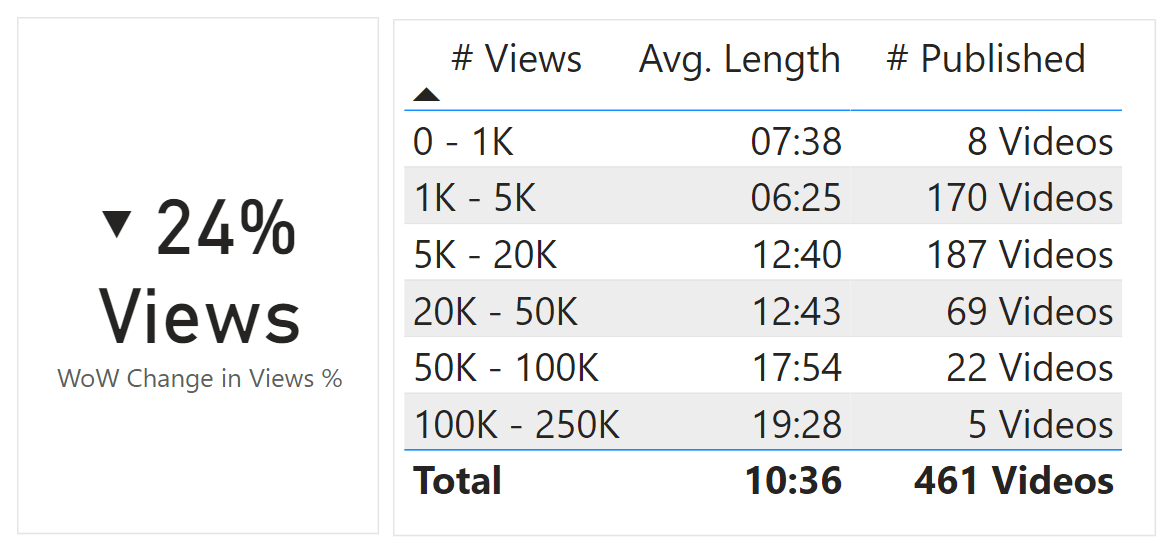
In the card in the first example, we use symbols like an arrowhead (▼) to more visibly show a decrease, and add a “ Views” suffix to clearly state what is decreasing.
In the table from the second example, we show the video length for the Avg. Length measure in both minutes and seconds (as MM:SS), because 36 seconds is easier to understand than 0.6 minutes. Lastly, we also add the “ Videos” suffix for the # Published measure, so it is clear what was published.
Other common examples include custom date formats, such as displaying the date as Aug. 29, ’23, or showing multiple different currencies for the same measure in a table or visual. If you want customized or advanced value formatting like this, then you need to define your own custom format string.
Custom and dynamic format strings
A format string is a property for measures and columns in a Power BI semantic model that determines how to display resulting values. It is a simple text instruction for measures and columns in your model. When you choose a format from the Power BI Desktop ribbon, you are choosing from a pre-selected list of common format strings. You can also define your own, custom format string for custom formatting.
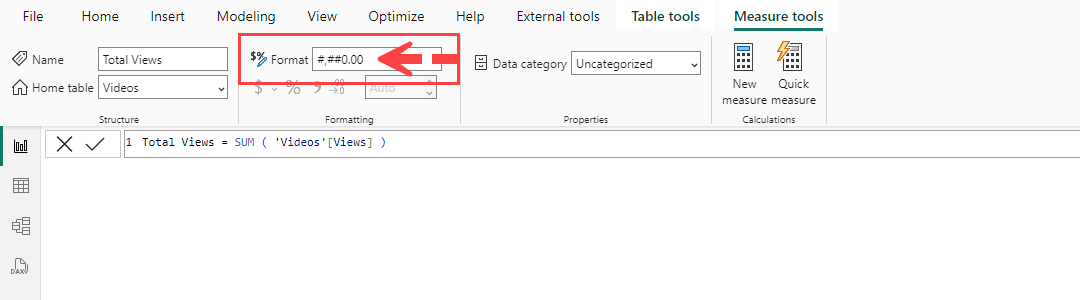
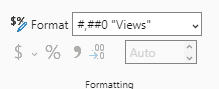
To use a custom format string in Power BI Desktop, you navigate to the model view, select a measure, and in the “Formatting” dropdown (highlighted by the red box) of the “Properties” pane, you select “Custom” (indicated by the arrow) and enter the format string (text box indicated by the dashed arrow).
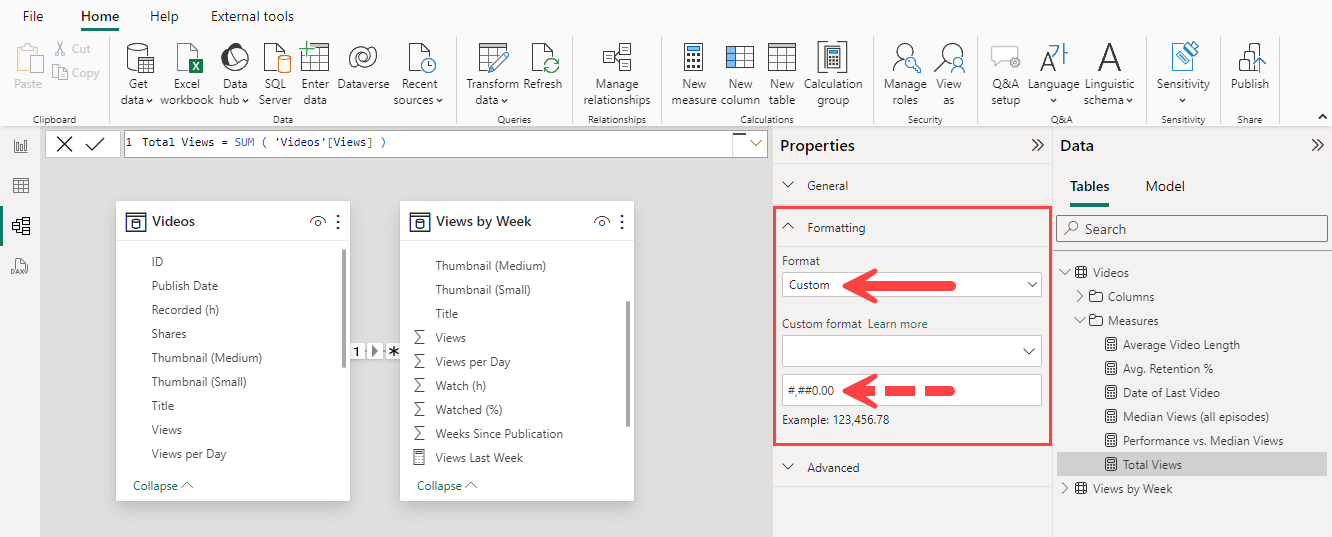
You can also do this directly in the “Formatting” part of the “Measure tools” ribbon (on the report page) for measures, or the “Column tools” ribbon for columns.
The format string uses a specific syntax similar to Excel and other tools. In this syntax, the format string uses placeholder characters for digit substitution. For instance, “#” and “0” refer to part of the number, “.” refers to a decimal place, and “m” refers to a month. It is important to keep this in mind when you use these characters for your own, custom formats. We will discuss this more in the examples later in this article.
The basic syntax of a format string has one part, but the format string can have up to three parts separated by a semicolon (“;”), which refer to positive numbers, negative numbers, and zeros, respectively. The following diagram shows a few examples of custom format strings.
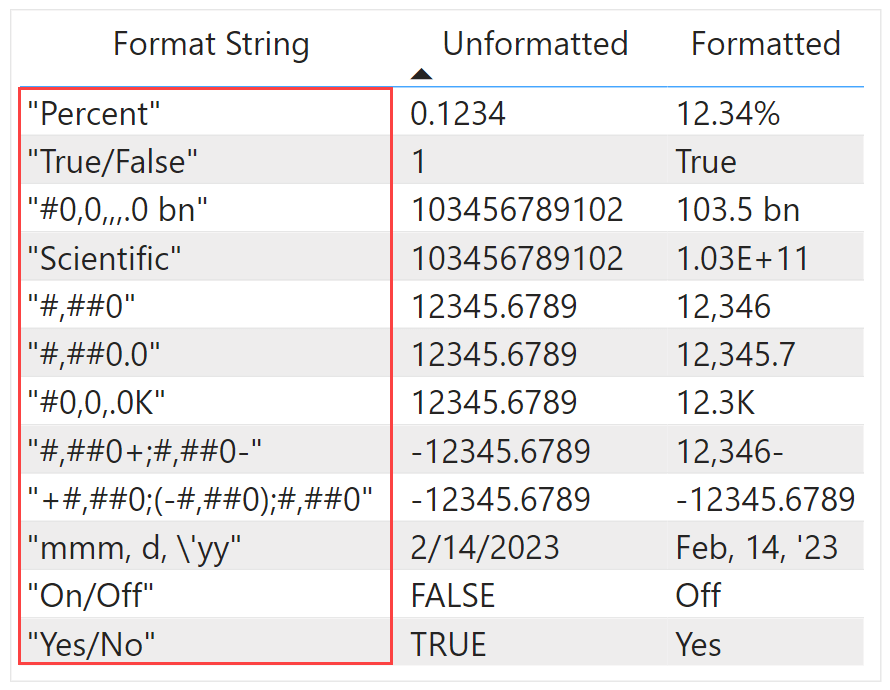
For a detailed explanation and examples of format strings, you may read about the supported custom format syntax in the Microsoft documentation. There is also a helpful, comprehensive list of examples in the documentation for the FORMAT function, which uses a format string in its second argument.
In addition to custom format strings, you can also use dynamic format string expressions in measures and in calculation groups (although they are not always required). It is important to note, however, that for both measures and calculation groups, dynamic format strings have limitations and considerations, particularly when you use them with client tools other than Power BI Desktop.
You can use custom or advanced format strings to make values more effective or correct for end users. We discuss three examples of these advanced scenarios in the following sections.
Scenario 1: Adding symbols to improve data labels
In this scenario, you want to improve formatting to have more elegant and efficient reports. Aside from currency, you typically do this to leverage pre-attentive attributes and associations to help people interpret the values they are looking at. Certain symbols or formats may also have specific meaning for the business that make the values appear more correct. Some examples include:
- Using currency symbols for values of different currency.
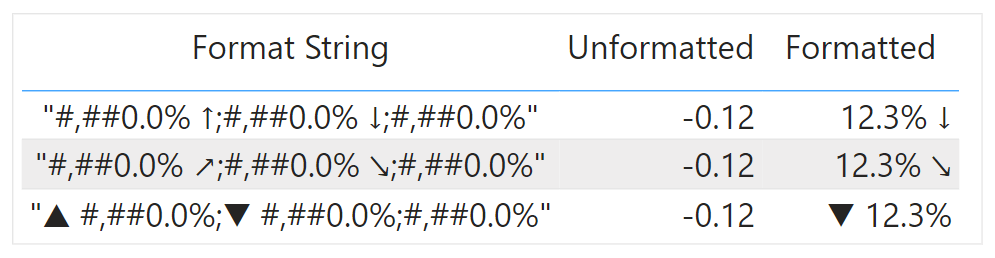
- Using arrows (like ↗;↘ or ↑;↓ and ▲;▼ ) to indicate trends or performance to a target.
- Using colored symbols or emojis to draw attention, convey meaning, or indicate sentiment (something is good or bad).
- Using symbols to indicate functionality, like 🔗 for a clickable URL in a table.
To add symbols, you can copy the symbol and paste it into the format string, like the below examples.
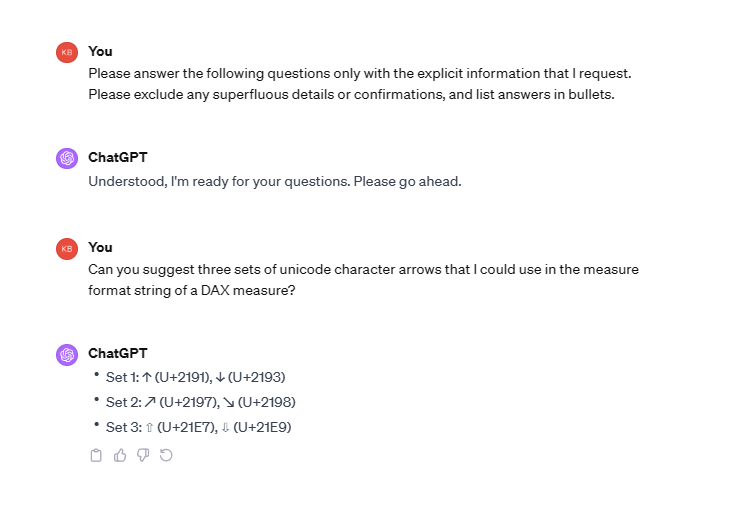
Alternatively, you can use the UNICHAR function to add symbols in a dynamic format string. This can be preferred, as some text editors may not support the character. To get the Unicode number for a symbol, you can use the character in the UNICODE function (for instance in dax.do). There are also various resources for helpful Unicode symbols, like Wikipedia. This can also be a simple use-case for ChatGPT or other LLMs.
You can see an example of UNICHAR in a dynamic format string, below. The following example formats the week-over-week change in views as a percentage, with arrows to indicate increase or decrease:
VAR _Increase =
    UNICHAR ( 9652 ) -- ▴ symbol
VAR _Decrease =
    UNICHAR ( 9662 ) -- ▾ symbol

VAR _Trend =
    IF (
        [Views Last Week] > [Views Prior Week],
        _Increase,
        _Decrease
    )

VAR _FormatString =
    _Trend & "#,##0%"

RETURN
    _FormatString & ";" & _FormatString
Using symbols is a simple way to improve formatting, particularly with calculations for comparison and achievement. You can extend this to not just symbols, but also text and other calculations.
Scenario 2: Adding letters and text to data labels
In this scenario, you want to use words or letters in value formatting. There are many common scenarios where you might need this. Typically, you do it to make the number more clear or concise. Some examples include:
- Including different units of measurement, like oz. (ounces), PC (pieces), or MM (millimeters).
- Including a prefix or suffix for clearer labels, like a “PY: “ (previous year) prefix for the data label in a line chart. Another example could be a “ MTD” suffix to indicate that values shown in a data label are cumulative for the month.
- Including a suffix to indicate rounding, like B (billion), M (million), or K (thousand).
To add words or letters, you include them in double quotes next to the format string syntax. Consider the following example where we added “ Views” to the format string.
When we use dynamic format strings, we take a slightly different approach. In the next example the format string expression specifies decimal precision and rounding of the Total Views measure, while also adding the “ Views” suffix.
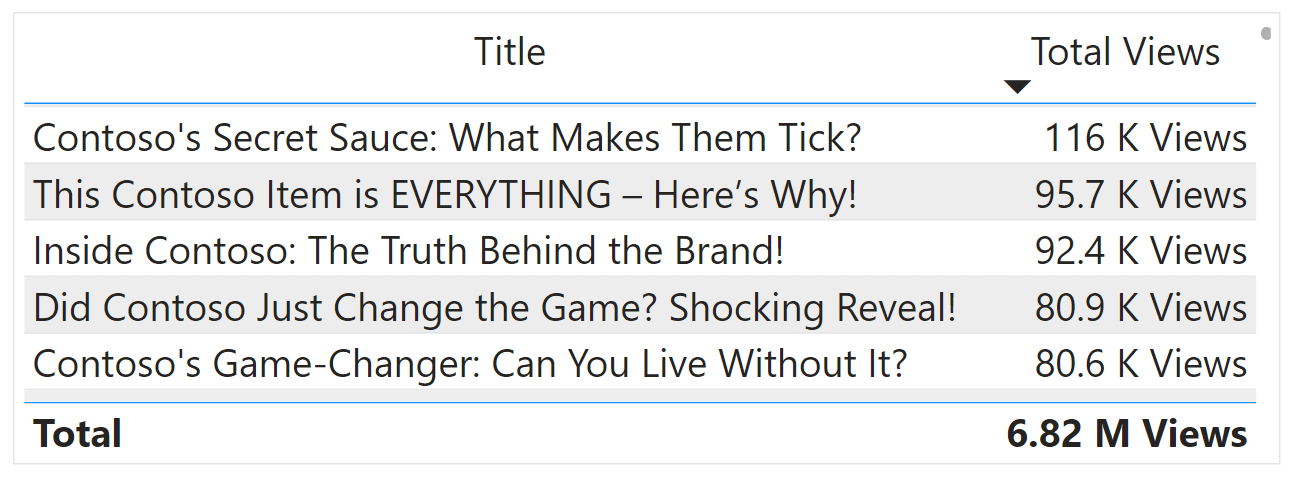
To achieve this result, we need to concatenate both the number format with the “ Views” suffix, wrapping “ Views” in double quotes by using four double quote characters. The format string expression for this example is below:
VAR _CurrentValue =
    SELECTEDMEASURE()
VAR _NumberFormat =
    SWITCH (
        TRUE (),
        _CurrentValue <= 1E3, "#,0.",
        _CurrentValue <= 1E4, "#,0,.00 K",
        _CurrentValue <= 1E5, "#,0,.0 K",
        _CurrentValue <= 1E6, "#,0,. K",
        _CurrentValue <= 1E7, "#,0,,.00 M",
        _CurrentValue <= 1E8, "#,0,,.0 M",
        _CurrentValue <= 1E9, "#,0,,. M"
    )
VAR _FormatString =
    _NumberFormat & """" & " Views" & """"
RETURN
    _FormatString
If we do not include the double quotes (“”””) in line 15, we risk that any letters or symbols are interpreted as part of the format string syntax, and replaced by digits. If you get strange results with dynamic format strings, this might be one possible explanation for why that is.
For instance, consider the following format string expression for the Avg. Weekly Views measure:
VAR _CurrentValue =
    SELECTEDMEASURE()
VAR _NumberFormat =
    SWITCH (
        TRUE (),
        _CurrentValue <= 1E3, "#,0.",
        _CurrentValue <= 1E4, "#,0,.00 K",
        _CurrentValue <= 1E5, "#,0,.0 K",
        _CurrentValue <= 1E6, "#,0,. K",
        _CurrentValue <= 1E7, "#,0,,.00 M",
        _CurrentValue <= 1E8, "#,0,,.0 M",
        _CurrentValue <= 1E9, "#,0,,. M"
    )
VAR _FormatString =
    _NumberFormat & " Avg. Views / Video"
RETURN
    _FormatString
This format string expression is nearly identical to the previous one, with the exception that the suffix is changed and we are no longer wrapping it in four double quotation characters. As a consequence, the result is not what we expect, as we see in the following table.
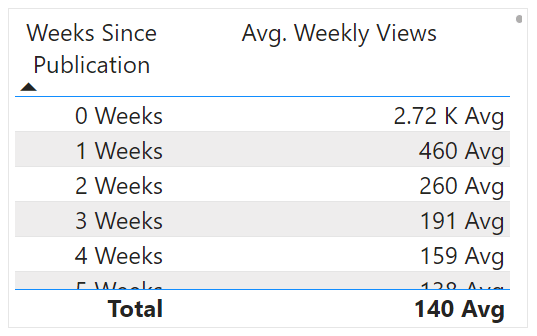
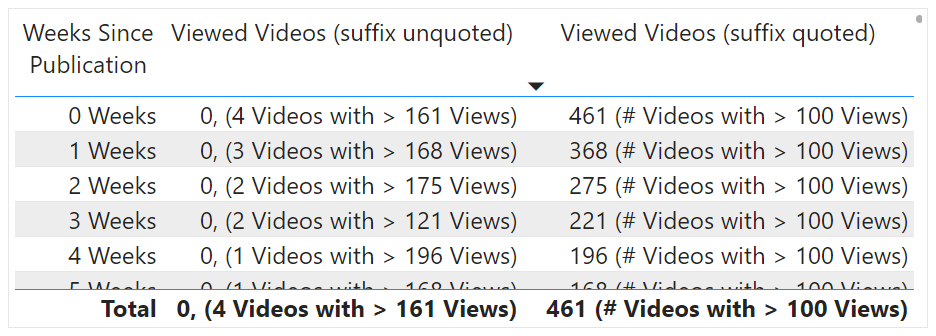
The suffix is truncated to only “ Avg” because the decimal (“.”) is interpreted as part of the format string syntax. This would be worse if we included a “0” or “#” in the suffix. Indeed, this would replace the digits from the measure, as in the below example with a verbose suffix, created purely for demonstrative purposes:
VAR _NumberFormat =
    "#,##0"
VAR _FormatString =
    _NumberFormat & " (# Videos with > 100 Views)"
RETURN
    _FormatString
Multiple characters in this format string will be interpreted as part of the format string syntax. As a result, the format will not only be incorrect, but the values will be completely nonsensical (and wrong). The values (and suffix) only display as expected when we double-quote the custom substring.
This is a general consideration for custom and dynamic format strings. However, it is very important for the third scenario.
Scenario 3: Adding other calculations or measures to measure formatting
In this scenario, you want to display other values in the format string aside from the value. This is typically necessary when the value consists of several, separately calculated parts, or when you want to add supplemental context. Some examples include:
- Displaying time or duration as HH:MM:SS while having only one numerical part (like seconds), and you want to retain the ability to sort by this value. For example: 10:48 or 10 min. 48 sec.
- Displaying the percentage after a delta when comparing two figures, like current and previous year sales. For example: -14K ( -8% ).
- Include additional contextual or clarifying information, for instance, how many days ago a reported date occurred. For example: Aug 8, 2023 (14 days ago).
To add other measures to a format string, you need only wrap them in the double quotes as if they were a symbol or text. However, it is recommended that you first apply their own formatting by using the FORMAT function. If you do not, then the numbers will display in a way that does not make sense.
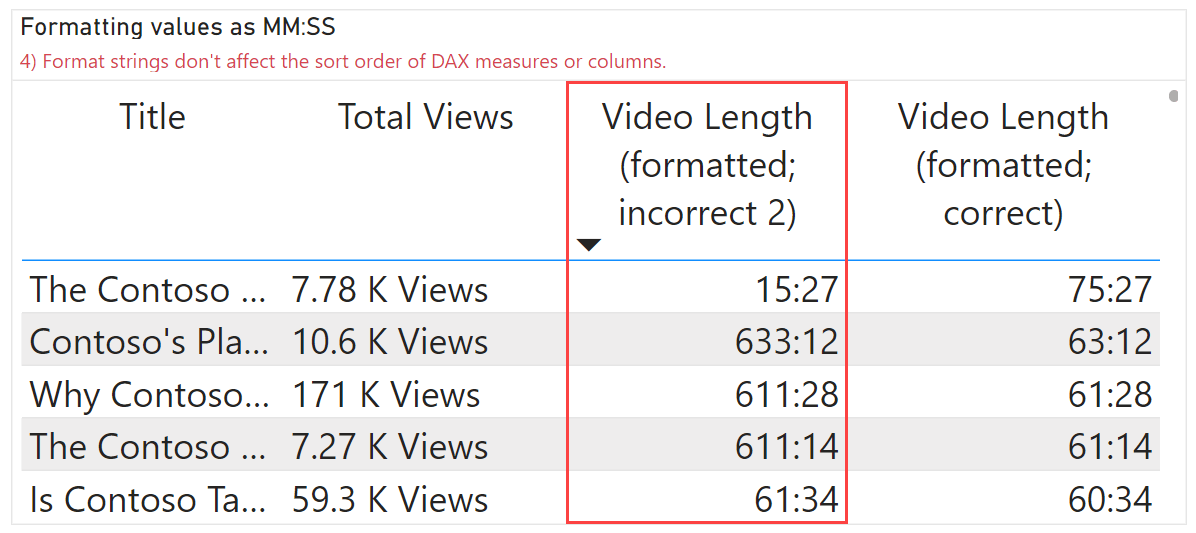
Consider the following example, where we want to display the video length as MM:SS. The below image depicts the original, unformatted measure and different approaches to formatting, three of which are incorrect, before we get the expected result. Incorrect values are boxed and highlighted in red.
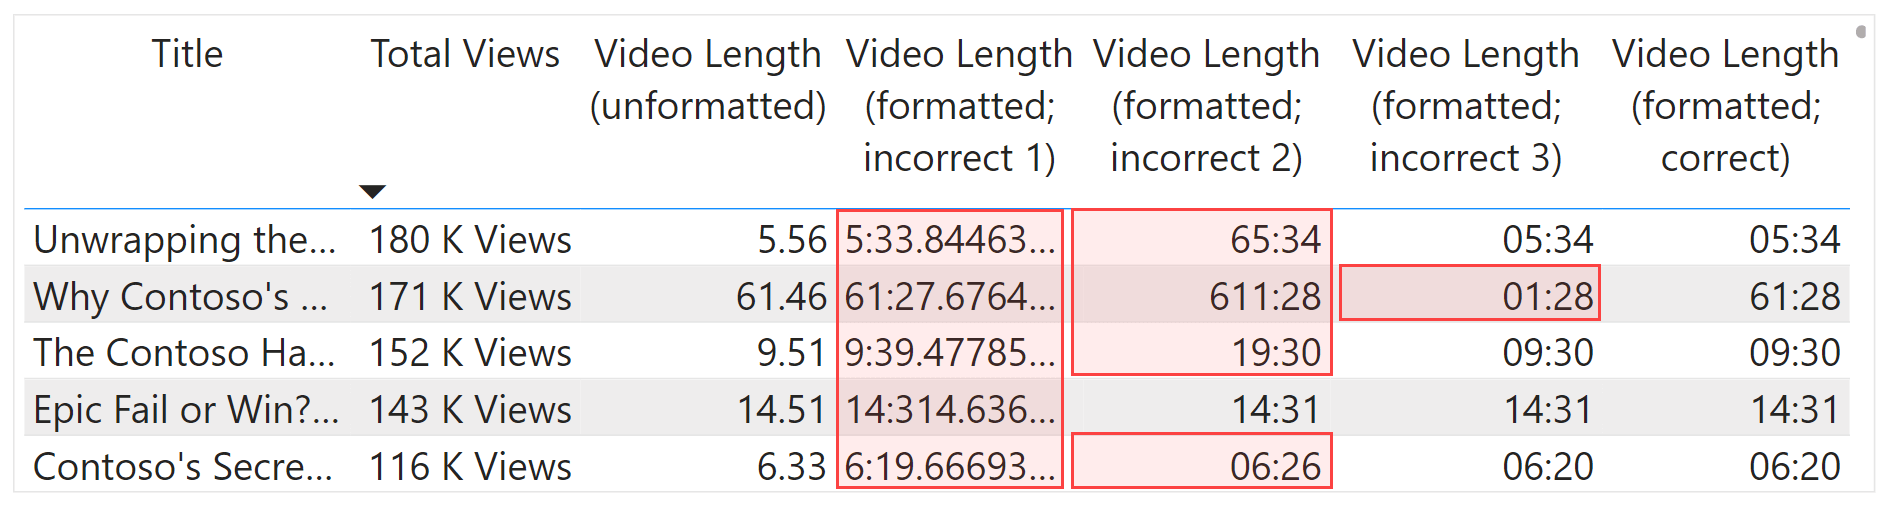
The unformatted Video Length (unformatted) measure shows the values as minutes. To show the values as MM:SS, we can calculate minutes and remaining seconds in the format string expression:
VAR _TotalTime =
    SELECTEDMEASURE ( )

VAR _Minutes =
    -- Keeps only the integer (minutes) without rounding.
    TRUNC ( _TotalTime )

VAR _Seconds =
    -- Multiplies by 60 seconds for the minute.
    ( _TotalTime - _Minutes ) * 60

VAR _FormatString =
    _Minutes & ":" & _Seconds

RETURN
    _FormatString
Next, we should incorporate these values in the format string. However, if we incorporate them as is, the value formatting will return the raw numbers; unformatted nonsense. We see an example of this in the following table, for the boxed column.
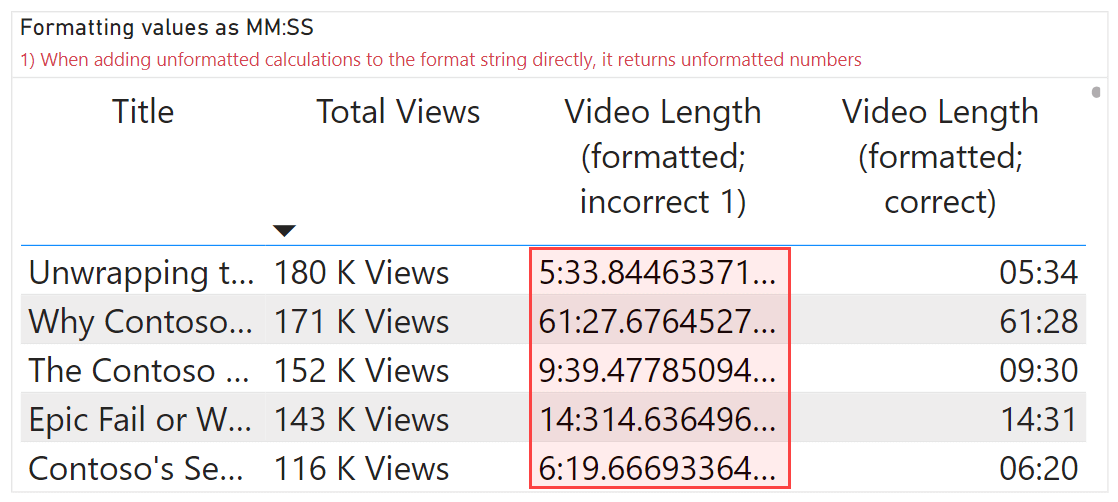
In the above example, the numerical values for minutes and seconds are provided directly in the format string and return nonsense. They must first be themselves turned into a formatted string, for instance, by using the FORMAT function. The easiest way to do this is to use the format string “nn:SS”, which corresponds to minutes and seconds (MM:SS). To do this, we need to provide the time in days:
VAR _Days =
    -- Divide [Video Length (min)] by 60 to return hours.
    -- Divide hours by 24 to return days.
    SELECTEDMEASURE ( ) * ( 1 / ( 24 * 60 ) )
RETURN
    -- Format the days as MM:SS using "nn:SS" format string.
    FORMAT ( _Days, "nn:SS" )
However, even if we format these values, if we fail to wrap these parts in quotes (“”””), as in the previous example in scenario two, we still get incorrect values. Any instance of a leading zero will produce the value rounded to the nearest integer. You can see this in the following table for the marked cells for the results of the Video Length (formatted; incorrect 2) measure.
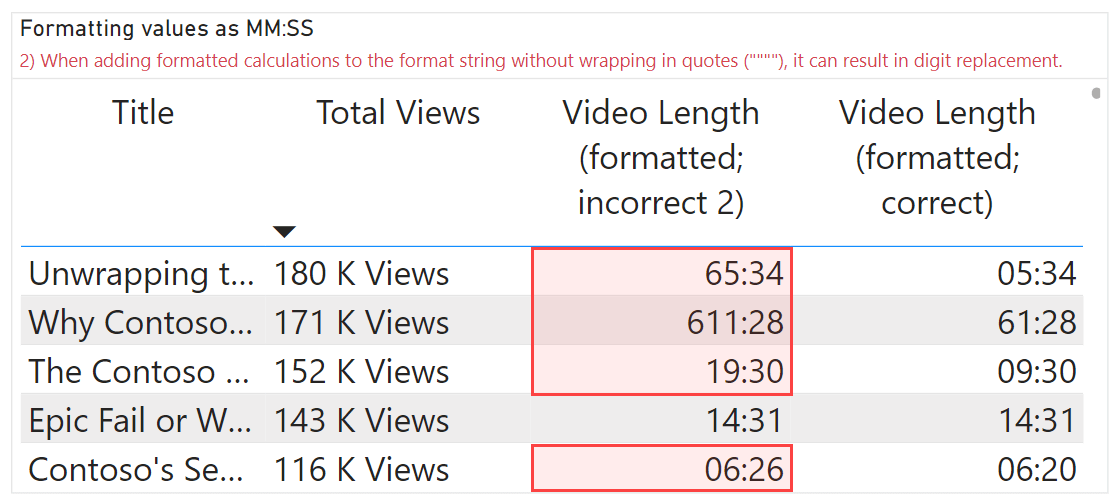
The first video has 65 minutes instead of 05 because the “0” results in digit replacement, where 5.7 (the measure result) rounds to 6. It is the same for the third and fifth videos, but why is the second wrong? Why do we get “611” minutes, instead of 61? First, we wrap line 7 in quotes (“”””) and observe the effect:
VAR _Days =
    -- Divide [Video Length (min)] by 60 to return hours.
    -- Divide hours by 24 to return days.
    SELECTEDMEASURE ( ) * ( 1 / ( 24 * 60 ) )

RETURN
    -- Format the days as MM:SS using "nn:SS" format string.
    """"  & FORMAT ( _Days, "nn:SS" ) & """"
With this format string, we observe the literal values, without digit replacement.
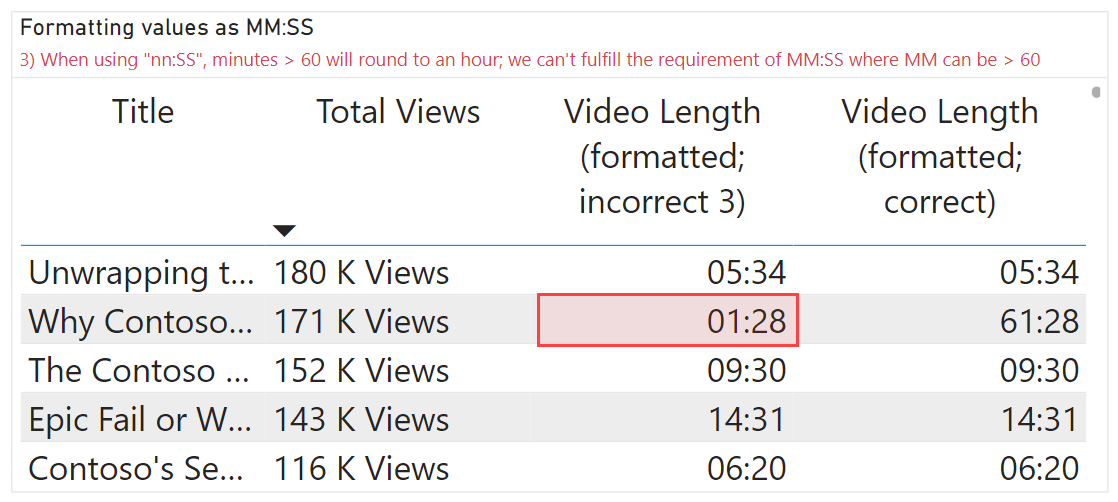
With quotes, we get the expected values for the first and third titles, but the second is still wrong; we expect 61:28 and we get 01:28. This is because FORMAT is returning only the minutes and seconds—not the hour part. The actual value would be 01:01:28, as 60 minutes carry to the hour. However, our requirement is to show the minutes above 60, as that is how it appears in video thumbnails and player.
To get the correct format, we just adjust our approach to return formatted minutes and seconds, without rounding the minutes. The correct format string is shown below:
VAR _TotalTime =
    SELECTEDMEASURE ( )

VAR _Minutes =
    -- Keeps only the integer (minutes) without rounding.
    TRUNC ( _TotalTime )

VAR _Days =
    -- Divide [Video Length (min)] by 60 to return hours.
    -- Divide hours by 24 to return days.
    SELECTEDMEASURE ( ) * ( 1 / ( 24 * 60 ) )

RETURN
    -- Format the days as MM:SS using “nn:SS” format string.
    """" & FORMAT ( _Minutes, "00" ) & FORMAT ( _Days, ":SS" ) & """"
Another consideration is that format strings do not change the sort order of your measures. When we sort the table by the incorrect length, we get the same result as if we sort by the correct length. This is due to sorting happening on the underlying measure result—the length in minutes. We can see this clearly when we sort on one of the incorrectly formatted columns. Even though 633:12 is bigger than 15:27, the column still sorts with the measure result (and not by using the format string).
Advanced scenarios for visualizations
Extrapolating these scenarios with some creativity and a bit of visual formatting, you can achieve some effective and interesting results. For instance, consider the following example of a line chart, that shows the cumulative views of a selected video compared to the average for other videos published that year. We will show you how to make this line chart and explain why it is so useful in a future article.
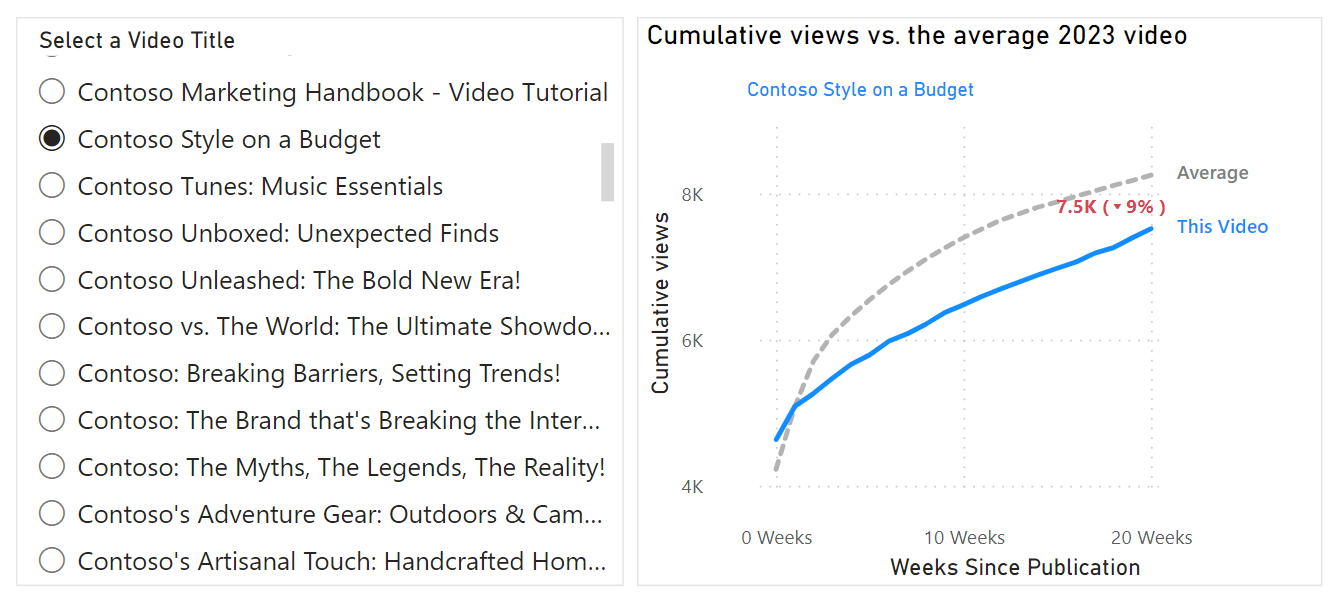
In this example, the data label provides a lot of information, and only labels the latest data point of an already informative graph. This example uses the following methods to achieve this special formatting for this particular visual:
- Conditionally displaying the label only for the latest data point.
- Adding symbols to the format string (to label performance).
- Adding other measures to the format string (to label the performance magnitude).
- Adding a suffix to the column used along the x-axis (for clarity).
This is what we used:
VAR _LatestWeek =
    CALCULATE (
        MAX ( 'Views by Week'[Weeks Since Publication] ),
        ALLEXCEPT (
            'Views by Week',
            'Videos'[Title]
        )
    )
RETURN
    IF (
        SELECTEDVALUE ( 'Weeks'[Weeks Since Publication] )
            = MIN ( _LatestWeek, 20 ),
        "#,##0" & """"
            & FORMAT (
                [Selected Title vs. Avg. Views],
                " (▴0% ); (▾0% ); (0%)"
            )
            & """",
        " "
    )
Examples like this can produce appealing visuals, but there are important considerations to keep in mind.
First, format string expressions can have performance implications for your model. You should be careful to test and measure query evaluation times before and after adding dynamic format strings for higher cardinality reports (with more data points computed) or more complex models. If used effectively, however, they can be an elegant and creative way to improve reports and add contextual information.
Second, format string expressions can be specific to a particular scenario, like the previous example. Therefore, they must be handled carefully for users who wish to use the measure in another context.
Format strings as reporting objects
Some format strings and format string expressions can be tailored for certain reports or even specific visuals. As such, these format strings can make it more difficult to use these measures and columns in other contexts. When end users are consuming your model for their own reports, pivot tables, and other analyses, your format strings could not fit their scenario.
To address reporting objects, you typically have three different options. First, you can use separate measures in thin reports – which are Power BI reports separated from the model, because they are connected to an external model. Second, you can also use composite models as a “proxy” for reporting objects. Third, you can use separate model measures that are segregated away from the standard model objects. What is important is that you isolate these situation-specific calculations, so that they are not easily visible or usable by end users, who require models and measures that work in all of their reasonable scenarios.
Format strings cannot be created for model measures in thin reports. When consuming measures from a Power BI semantic model, the report cannot define its own format strings or format string expressions. However, you can set the format of data labels and values in the formatting pane for visuals. Additionally, enhanced data labels make it possible to use custom data labels to achieve some of the advanced scenarios by using thin report measures and visual settings, alone. Regardless, overall, thin reports are not a solution to this problem.
One possible alternative is to store specially-formatted measures in a “proxy” composite model that houses other reporting objects. This way, the “original” semantic model remains undisturbed; users would connect to that model for their analyses and reports, while the “proxy” model would serve the model reports for which the format strings were defined. Additionally, the author of the “proxy” model can modify the format strings (and even the definitions) of the “original” model measures by using external tools. While this does not affect the “original” model, it can be a caveat in its own right.
On paper this seems like an elegant solution. However, it does lead to additional management overhead, and composite models have many limitations and considerations to know before you use them.
A last approach is to create separate measures for each format string (or format string expression) “variant”. Immediately, this has the added disadvantage of inflating the model, possibly bloating it with measures and columns created for narrow, specific use cases. To mitigate this, you should isolate these “niche” measures away from the rest of your model. For instance, store them in their own measure table and display folder, hide them, and include in their description the intended use case.
There is no one-size-fits-all solution. Like all things, it depends on your specific model and needs. Regardless, this is a fairly limited drawback that can be easily managed with some planning and diligent model management practices. With effective use of format strings and format string expressions, you can easily improve your models and reports.
Conclusions
Most basic formatting can be done from the Power BI Desktop “Formatting” ribbon area. Some advanced scenarios require that you create custom or dynamic format strings. For instance, you can add words, letters, symbols, or even other measures to format strings to improve your data labels. However, special care and attention should go into how you will manage these format strings to ensure performance, organization, and re-usability of your semantic model for both developers and end-users.
Converts a value to text in the specified number format.
FORMAT ( <Value>, <Format> [, <LocaleName>] )
Returns the Unicode character that is referenced by the given numeric value.
UNICHAR ( <Number> )
Returns the number (code point) corresponding to the first character of the text.
UNICODE ( <Text> )