 Marco Russo & Alberto Ferrari
If you want to build a report where the user can choose what measure to show, you have two features available in Power BI: field parameters and calculation groups. There are pros and cons to either technique – however, we are not about to talk about those. We narrow our scenario down to a specific requirement: we want to change the color of the value depending on the measure selected.
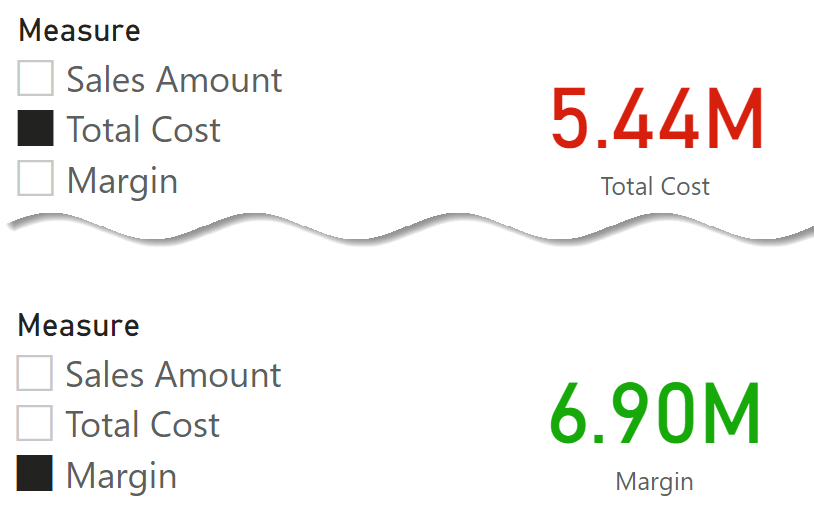
For example, suppose we let users choose between Sales Amount, Margin, or Total Cost. In that case, we might provide visual feedback about the measure selected through different colors: black for Sales Amount, green for Margin, and red for Total Cost.
The technique to provide a color depends on how we allow the user to select the measure to display. In both scenarios, you must use a measure as the source of conditional formatting. This special “formatting” measure must be aware of which measure was selected by the user, through either a field parameter or a calculation group. In both scenarios, there are some minor DAX shenanigans a developer needs to understand before successfully implementing the technique.
Using field parameters
Field parameters use a calculated table tagged as a field parameter table. The slicer places a filter on the table, then Power BI detects the value selected to change the query and returns the value of the desired measure.
In our example, the user can choose between three possible metrics: Sales Amount, Total Cost, and Margin. Power BI created this calculated table:
Measure =
{
    ( "Sales Amount", NAMEOF ( 'Sales'[Sales Amount] ), 0 ),
    ( "Total Cost", NAMEOF ( 'Sales'[Total Cost] ), 1 ),
    ( "Margin", NAMEOF ( 'Sales'[Margin] ), 2 )
}
The query that computes the result is generated dynamically (more info here: Fields parameters in Power BI). Power BI uses the slicer selection to generate a DAX query that computes the selected measure. The slicer selection is also part of the generated query, although this filter is unnecessary because the selected measure is already part of the query. However, it is handy if developers need to retrieve the name of the chosen measure.
Power BI generates the following query to compute the Card visual when the user selects Margin from the measure slicer:
// DAX Query
DEFINE
    VAR __DS0FilterTable =
        TREATAS ( { "'Sales'[Margin]" }, 'Measure'[Measure Fields] )

EVALUATE
SUMMARIZECOLUMNS ( __DS0FilterTable, "Margin", IGNORE ( 'Sales'[Margin] ) )
Because __DS0FilterTable is used as a filter in SUMMARIZECOLUMNS, during the calculation of [Margin] – or any other measure used in SUMMARIZECOLUMNS – it is possible to inspect the filter context and retrieve the selected value in the Measure table. This filter makes it possible to create a formatting measure like the following:
Dynamic Color =
VAR CurrentField =
    MAX ( 'Measure'[Measure] )
VAR Result =
    SWITCH (
        CurrentField,
        "Sales Amount", "Black",
        "Total Cost", "Red",
        "Margin", "Green"
    )
RETURN
    IF ( COUNTROWS ( 'Measure' ) = 1, Result )
First, in CurrentField it computes the maximum value of the Measure[Measure] column. Then, it returns a different color name depending on the field selected. Power BI intercepts the color names to define the font color of the Card visual.

A careful reader might notice that we used MAX to retrieve the slicer selection in Measure[Measure]. We then protected the measure’s result with IF ( COUNTROWS ( … ) ) to handle the scenario where multiple fields are selected. We did not use SELECTEDVALUE rather than MAX for a very good reason.
The Measure table automatically created by Power BI has some properties set. Specifically, the Measure[Measure] column is set using Measure[Measure Fields] and Measure[Measure Order] as GroupBy columns. The GroupBy feature is seldom used, mainly because Power BI lacks a user interface to set it. However, it lets developers define a set of columns that act as the key for the current column. You can find more information about Group By columns here: Understanding Group By Columns in Power BI. Because of the GroupBy columns set, we cannot use SELECTEDVALUE; indeed, internally, SELECTEDVALUE uses VALUES, and VALUES cannot be used on a column with Group By columns set.
Using calculation groups
Field parameters are a simple and great solution for the scenario presented. However, they lack some flexibility and cannot be used for example in Excel. Developers can use calculation groups to obtain a behavior that is very similar to that of field parameters. The following calculation group creates the same effect as the field parameter:
----------------------------------
-- Calculation Group: 'Measure CG'
----------------------------------
CALCULATIONGROUP 'Measure CG'[Measure CG]

    CALCULATIONITEM "Sales Amount" =
        [Sales Amount],
        Ordinal = 0

    CALCULATIONITEM "Total Cost" =
        [Total Cost],
        Ordinal = 1

    CALCULATIONITEM "Margin" =
        [Margin],
        Ordinal = 2
The internal implementation is entirely different despite its behavior being close to field parameters. Calculation groups are applied to the DAX code before the execution of the query starts, and there is no way to read which calculation item has been applied from inside a DAX measure.
However, the main advantage of calculation groups is their flexibility. Each calculation item can include complex DAX code. From inside this DAX code, we can apply a suitable filter that the formatting measure will detect.
To reach our goal, we must create a table with the calculation item names – a calculated table guarantees that this table is always updated:
'Measure CG Name' = ALLNOBLANKROW ( 'Measure'[Measure] )
Because the table is disconnected from the remaining part of the semantic model, there is no need to create the relationship. Each calculation item applies a filter to the table that any measure can read by looking at the currently selected value in the Measure CG Name table.
The implementation of the calculation items is the following:
----------------------------------
-- Calculation Group: 'Measure CG'
----------------------------------
CALCULATIONGROUP 'Measure CG'[Measure CG]

    CALCULATIONITEM "Sales Amount" =
        IF (
            ISSELECTEDMEASURE ( [Dynamic Color CG] ),
            CALCULATE ( SELECTEDMEASURE (), 'Measure CG Name'[Measure] = "Sales Amount" ),
            [Sales Amount]
        )
        Ordinal = 0

    CALCULATIONITEM "Total Cost" =
        IF (
            ISSELECTEDMEASURE ( [Dynamic Color CG] ),
            CALCULATE ( SELECTEDMEASURE (), 'Measure CG Name'[Measure] = "Total Cost" ),
            [Total Cost]
        )
        Ordinal = 1

    CALCULATIONITEM "Margin" =
        IF (
            ISSELECTEDMEASURE ( [Dynamic Color CG] ),
            CALCULATE ( SELECTEDMEASURE (), 'Measure CG Name'[Measure] = "Margin" ),
            [Margin]
        )
        Ordinal = 2
The Dynamic Color CG measure is very similar to the previous Dynamic Color measure. The only difference is the method used to retrieve the current field:
Dynamic Color CG =
    VAR CurrentField = SELECTEDVALUE ( 'Measure CG Name'[Measure] )
    VAR Result =
        SWITCH (
            CurrentField,
            "Sales Amount", "Black",
            "Total Cost", "Red",
            "Margin", "Green"
        )
    RETURN
        Result
Because we are retrieving the selected value from a table that is not a field parameter table – that is, there is no group by column defined – we can safely use SELECTEDVALUE.
Conclusions
In this example, we used information about which field parameter (or calculation item) was selected to change the color of a visual. Depending on the user selection, the same technique can be used in different scenarios whenever we want to change the behavior of the DAX code.
The two techniques are based on the same idea, although the calculation item detection requires an extra table due to the implementation differences between calculation groups and field parameters.
Create a summary table for the requested totals over set of groups.
SUMMARIZECOLUMNS ( [<GroupBy_ColumnName> [, [<FilterTable>] [, [<Name>] [, [<Expression>] [, <GroupBy_ColumnName> [, [<FilterTable>] [, [<Name>] [, [<Expression>] [, … ] ] ] ] ] ] ] ] ] )
Returns the largest value in a column, or the larger value between two scalar expressions. Ignores logical values. Strings are compared according to alphabetical order.
MAX ( <ColumnNameOrScalar1> [, <Scalar2>] )
Checks whether a condition is met, and returns one value if TRUE, and another value if FALSE.
IF ( <LogicalTest>, <ResultIfTrue> [, <ResultIfFalse>] )
Counts the number of rows in a table.
COUNTROWS ( [<Table>] )
Returns the value when there’s only one value in the specified column, otherwise returns the alternate result.
SELECTEDVALUE ( <ColumnName> [, <AlternateResult>] )
When a column name is given, returns a single-column table of unique values. When a table name is given, returns a table with the same columns and all the rows of the table (including duplicates) with the additional blank row caused by an invalid relationship if present.
VALUES ( <TableNameOrColumnName> )