 Kurt Buhler
Creating good data models and reports for Power BI takes time and effort. Simple reports that you make for a small audience from a few Excel files are straightforward… However, larger models and reports – especially those consumed by wider audiences or upon which important decisions are made – can be complex to build and manage. This complexity increases with Microsoft Fabric, because there are more possibilities to both build and use semantic models. This allows you to address more scenarios and get more value from your data, but it requires more deliberate planning, development, and testing of your models. Thankfully, Power BI has a growing, rich ecosystem of tools that can help you and save you cost.
In general, the process to build and manage both models and reports in Power BI can be simplified to a few sequential steps that describe the “lifecycle” of this content. You can see this depicted below, as well as some examples of the various tools that you might use to support each of these steps. Shameless plug, Bravo, Vertipaq Analyzer, and Analyze in Excel were created by SQLBI, and SQLBI is involved in the development of DAX Studio, DAX Optimizer, and Tabular Editor.
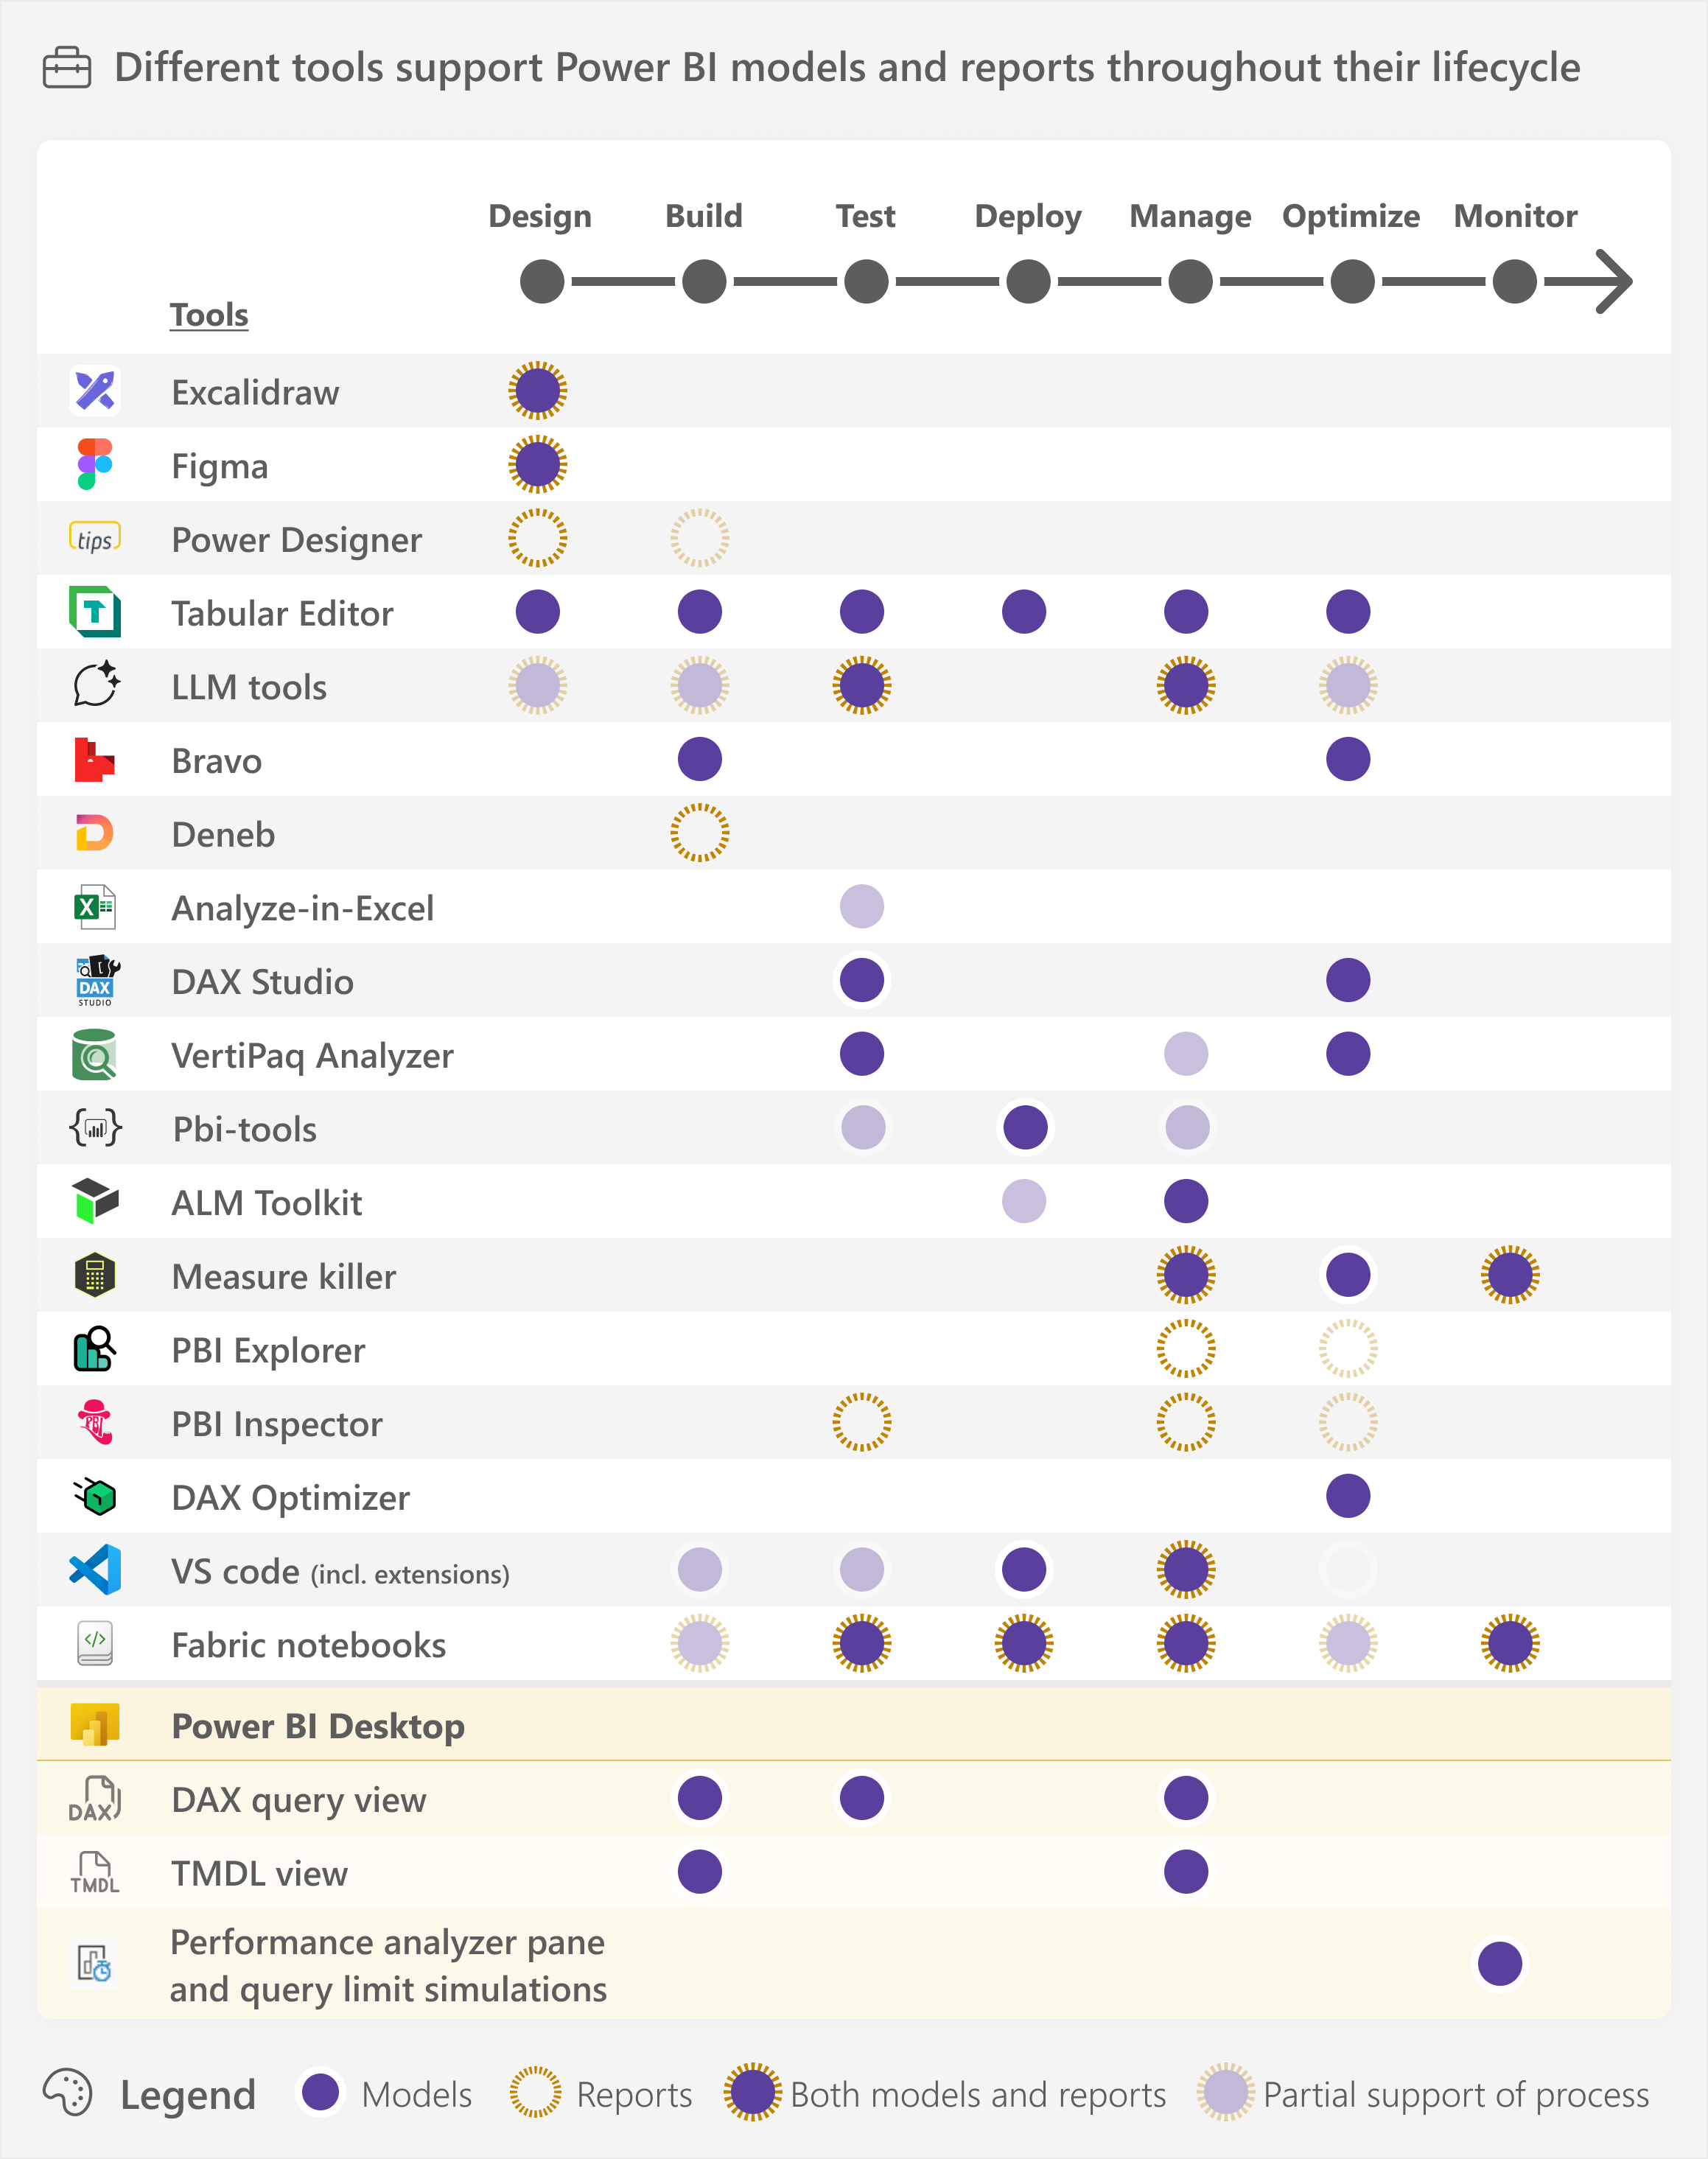
Note that we are simplifying and generalizing these steps to provide a high-level overview that we can address in the scope of a single article. In future articles, we may explain some of these steps in more detail, and the role of various tools in supporting them. In the real world, workflows typically iterate between several of these steps and might include additional (sub-)processes that we do not list here, to be concise:
- Design: The requirements gathering phase, when you understand the underlying business process and plan how you will report on it and what you need to do so. Design does not refer exclusively to visualization or aesthetics, and might include creating mock-ups, wireframes, or prototypes. During this phase, you also validate whether the data is suitable in quality and completeness for reporting, or whether other dependent tasks must be done first to make that so.
- Build: The implementation of the model and reports, where you set up the functionality.
- Test: The validation of what you built, including performing quality assurance and control (QA/QC).
- Deploy: Publishing the model and reports to a workspace in the Power BI service (or Fabric) so that you can share them for others to use. Steps 2-4 typically occur in multiple iterative stages throughout development until you are ready to release the model or report for consumption.
- Manage: Supporting the model and reports as they get used. This includes performing fixes and changes, or implementing new functionality or adding additional data with new developments.
- Optimize: Improving the performance or efficiency of a model or report.
- Monitor: Following key metrics about models or report to inform and decide whether management or optimization actions are necessary.
It is important to emphasize that you do not need to use any of these tools. Rather, you typically turn to them when you have specific problems that you want to solve, or scenarios that you aim to address. However, some tools cover a broad range of use cases, and you might use them to assist you throughout most of your development tasks.
The following diagram shows a hypothetical example of how different scenarios and problems lead you to different tools. This is not intended to be a complete or generalized example with all possible tools that fit a use case; rather, it just shows how various tools support you in different tasks or situations.
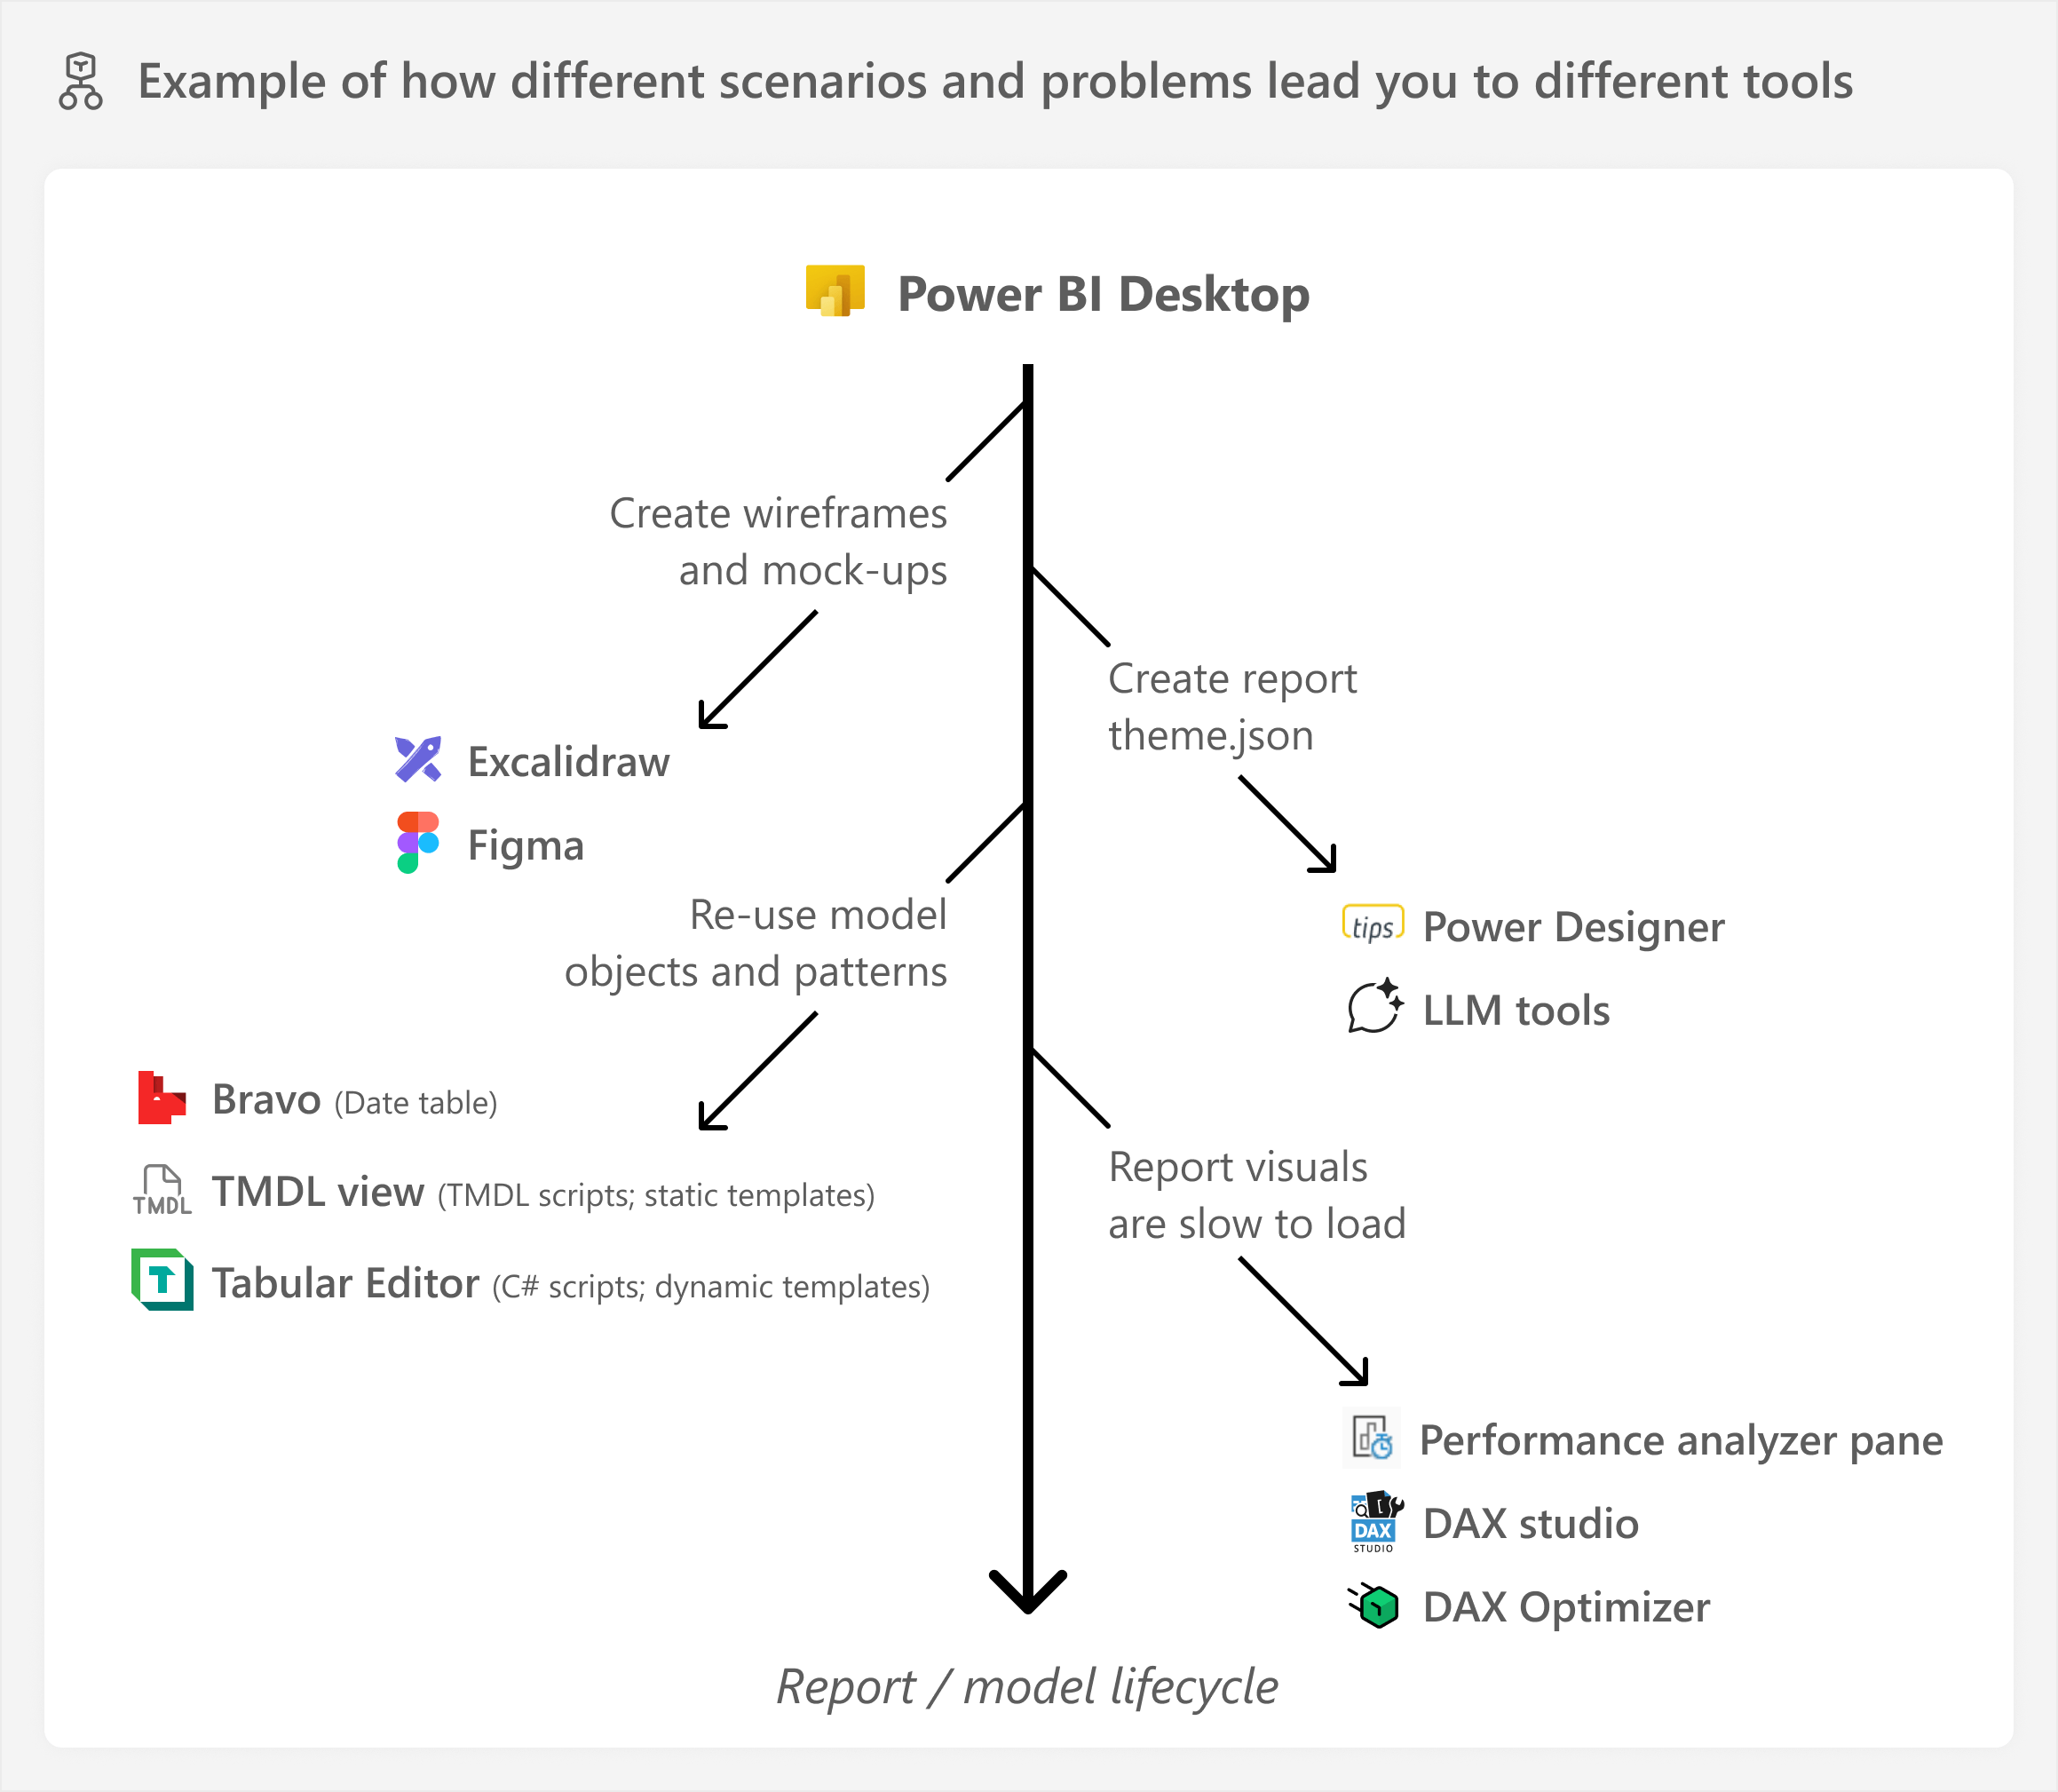
In this article, we provide a high-level overview and directions for each of these tools, so that you are aware of their potential use cases and benefits for you, and can choose to use them when you need them. Note that this article focuses on the most commonly used third-party tools in the Power BI ecosystem; it is also not a comprehensive list. We will also mention recently released first-party features or items in both Power BI and Fabric.
This article is intended more as a reference; the tools mentioned below are explained in brief, non-technical terms that anyone can understand. We link additional resources for each, should you need more information. We categorize these tools generally in terms of tools that support semantic models and tools that support reports. Tools that do both things are therefore in both sections of the article.
Tools that support semantic models
In general, there are many tools that exist to help you develop and manage semantic models.
- Figma and Excalidraw: general-purpose design tools that you can use to facilitate the design for anything. For models, you might use Figma (FigJam, likely) or Excalidraw to create the conceptual or logical model for your semantic model during the design There are many other tools for doing this, including Visio or even the diagram view in Tabular Editor 3.
- Example use cases: You might use Figma or Excalidraw for the following tasks:
- Wireframes and mock-ups. You can also make prototypes in Figma, but this is a time-intensive task reserved only for very critical projects.
- Creating or supporting documentation.
- Brainstorming or visualizing concepts, ideas, etc. in a model.
- Publishers: Figma and open source (Excalidraw).
- Cost: Various licensing and freemium models.
- Download and information: Both tools can be used from the web, but Figma has a desktop application and Excalidraw has extensions for VS Code and a plug-in for Obsidian.
- Example use cases: You might use Figma or Excalidraw for the following tasks:
- Tabular Editor: an end-to-end development tool that you can use either together with Power BI Desktop or as an alternative. Tabular Editor is an integrated development environment specialized for working with semantic models. It is designed from the ground up, to empower semantic model developers with everything they need to build good semantic models while being efficient.
-
- Example use cases: You might use Tabular Editor for the following tasks:
- Designing a semantic model and business logic based on requirements before you have access to data
- Expert semantic model authoring, leveraging features to improve productivity, like DAX code assistance, C# scripts and macros, custom keyboard shortcuts and toolbars, and a customizable user interface.
- Debugging complex DAX code to view intermediate evaluation results, watch variables, and modify the context of a DAX expression.
- Simple quality-of-life enhancements, like copy/paste between models, Ctrl+Z to undo, undocking and moving windows, and more.
- Publisher: Tabular Editor ApS.
- Disclaimer: SQLBI has a commercial relationship with Tabular Editor via Tabular Tools, and the author of this article (Kurt Buhler) has a commercial relationship with Tabular Editor ApS to produce training content.
- Example use cases: You might use Tabular Editor for the following tasks:
- Cost: There are two versions of Tabular Editor:
- Tabular Editor 2, free and open source, with only basic features.
- Tabular Editor 3, paid, with all features and monthly updates.
-
- Large language models (LLMs) and other generative AI tools: Generative AI can support you with a variety of tasks as you create a model, including suggesting code and metadata as well as streamlining mundane or repetitious tasks. We refer to LLMs and related tools in general, which includes but is not limited to the various Copilot for Power BI experiences.
- Example use cases:
- Suggesting measure descriptions or translations and then correcting them either using Copilot for Power BI, TMDL scripts, or C# scripts in Tabular Editor.
- Generating DAX or Power Query (M) code.
- Generating suggestions for content to support documentation.
- Publisher: Various.
- Cost: Varies depending on the model and service.
- Example use cases:
- Bravo: A simple tool for beginners that helps you with common tasks and problems that you run into when building a semantic model. Advanced users can still make use of Bravo, because it can quickly and conveniently set up date templates and patterns in DAX.
- Example use cases:
- Add a DAX date table and time intelligence template to your model.
- Optimize and reduce model size.
- Export data or format DAX code in a model.
- Publisher: SQLBI
- Cost: Free (Open Source)
- Download and information: http://bravo.bi
- Example use cases:
- Analyze in Excel: Analyze in Excel can refer to multiple things. First, it could be a first-party Excel add-in that lets you (or users) connect to published semantic models from Excel pivot tables and query the model with MDX. However, there is also a third-party external tool for Power BI Desktop that lets you query local models to explore the data in Excel. Analyze in Excel can be a useful tool for exploring and testing a model if you are experienced with Excel, or expect Excel to be the primary way for users to consume and analyze data.
- Example use case:
- Connect to and analyze data from models with Pivot Tables to facilitate testing and validation.
- Publisher: Microsoft (Excel add-in) and SQLBI (external tool)
- Cost: Free
- Download and information: Available from the Power BI Service (add-in) and SQLBI (external tool)
- Example use case:
- DAX Studio: A read-only tool that specializes in helping you write and run DAX queries and identify performance bottlenecks in those queries to improve your DAX code.
- Example use cases:
- Test and examine DAX performance in detail, looking at engine timings and query plans.
- Query and explore a model by using DAX, and export model data.
- Optimize a model by running the VertiPaq Analyzer to identify large columns and referential integrity violations in relationships. You can also run the VertiPaq Analyzer from Tabular Editor 3 or Fabric notebooks.
- Publisher: Darren Gosbell
- Disclaimer: Sponsored by SQLBI and Tabular Editor, among others.
- Cost: Free (Open Source)
- Download and information: https://daxstudio.org/downloads/
- Example use cases:
- Pbi-tools: A command-line tool that supports source control and DevOps practices for Power BI.
- Example use cases:
- Facilitate DevOps and deployment of Power BI artifacts, including models and reports, and ensure more robust development practices.
- Publisher: pbi-tools
- Cost: Free (Open Source)
- Download and information: https://pbi.tools/
- Example use cases:
- ALM toolkit: An elegant and simple tool that lets you compare semantic models and push changes between them.
- Example use cases:
- Compare two semantic models and identify what is different.
- Push changes or definitions from one semantic model to another.
- Deploy a semantic model to a Power BI PPU or Fabric workspace.
- Publisher: (http link): ALM Toolkit (open source GitHub)
- Cost: Free
- Download and information: (http link): https://github.com/microsoft/Analysis-Services/releases
- Example use cases:
- VertiPaq Analyzer: While not technically a standalone tool, the VertiPaq Analyzer is a library that you can use in multiple tools including Tabular Editor 3, DAX Studio, and notebooks to analyze the metadata for a model to identify things like large columns, referential integrity violations, and other information. This is valuable to manage and optimize models (particularly large ones). There is also a standalone Excel file which provides the most information for when you really need details.
- Example use cases:
- Find columns and tables that take up significant size, or referential integrity violations for relationships.
- Document a model and include relevant statistical information that impacts its performance.
- Extract a .vpax file or obfuscated .vpax (.ovpax) file to provide to consultants to advise about the model. This can be a good way to share the model without sharing sensitive information.
- Publisher: SQLBI
- Cost: Free (open source)
- Download and information: VertiPaq Analyzer by SQLBI
- Example use cases:
- Measure killer: A tool that facilitates the management and optimization of semantic models and also provides insights about their use. Measure killer can also be useful beyond semantic models and reports, since you can use it to facilitate the management and auditing of an entire tenant.
- Example use cases:
- Identify which columns and measures are used in which downstream items, and where.
- Various tasks to support model and report management and optimization.
- Support for various tenant management and auditing tasks like lineage, access, and report views.
- Publisher: Brunner BI
- Cost: Free and licensed versions. Some features and priority support are for paid licenses only.
- Download and information: https://www.brunner.bi/measurekiller
- Example use cases:
- DAX Optimizer: DAX optimizer is a tool focused on model optimization. It identifies bottlenecks so that you can improve the model performance.
- Example use cases:
- Identify and resolve model bottlenecks to improve performance.
- Proactively improve models during development and leverage integration in Tabular Editor 3.
- Publisher: Tabular Tools
- Disclaimer: SQLBI is affiliated with Tabular Tools.
- Cost: Various licensing models
- Download and information: https://www.daxoptimizer.com/
- Example use cases:
- VS Code: A lightweight code editor that has become a popular development environment. VS code has many free extensions that also aid in development in Power BI and Fabric, including TMDL, Fabric Studio, Microsoft Fabric, Fabric User Data Functions, and Fabric Data Engineering.
- Example use cases:
- Use as your main Git client to clone repositories, commit changes, submit PRs, etc.
- View and change metadata including TMDL metadata files and scripts, aided by GitHub Copilot, if necessary.
- Manage and configure workspace items.
- Publisher: Microsoft
- Cost: Free
- Download and information: https://code.visualstudio.com/
- Example use cases:
- Fabric notebooks: If you have Fabric, then you can use notebooks to connect to and manage published semantic models in the Power BI service. Notebooks can do this by leveraging libraries such as semantic link and semantic link labs.
- Example use cases:
- Connect to, explore, and analyze a semantic model by using Python from a code notebook.
- Make changes to multiple models at once, scaling tasks across multiple models and workspaces – and even your entire tenant. For instance, you can save and re-use objects and patterns.
- Schedule queries to run against a semantic model to facilitate automated testing.
- Publisher: Microsoft
- Cost: Requires a Fabric capacity
- Download and information: Microsoft Documentation
- Example use cases:
- Power BI Desktop tools: New features and tools in Power BI Desktop also support a variety of use cases.
- DAX query view: You can write and evaluate DAX queries in Power BI Desktop. You can also define measures upstream of the query, format DAX, and then write changes back to the model. With the integration of Copilot for Power BI, you can also leverage AI for adding comments, simplifying queries, or suggesting code.
- TMDL view: You can use TMDL scripts to programmatically make changes to models, including changes to properties and objects that do not have a user interface, like perspectives, translations, and object-level security. The scripts use the Tabular Model Definition Language (TMDL) syntax of the serialized model metadata, and are specific to a single model.
- Performance Analyzer pane and query limit simulations: While not a separate view or tool per se, the Performance Analyzer pane and query limit simulation options of Power BI Desktop are so valuable that they deserve to be called out on their own. They let you inspect and extract a DAX query from a Power BI visual (Performance Analyzer pane) and simulate concurrent queries against a model (query limit simulations) to aid in optimization.
Tools that support reports
Compared to tools that support semantic models, there are significantly fewer.
It is important to mention that if you plan to use tools with your Power BI reports, then you might want to consider using the Power BI project (.pbip) format with the enhanced Power BI Report (PBIR) format enabled. This PBIR format is a more structured version of the metadata that makes it easier to read and use. This is particularly relevant because some tools (like semantic-link-labs and PBI Inspector V2) have functionalities that only work with reports that use this PBIR format.
- Excalidraw and Figma: In general, Excalidraw and Figma have the same use cases and applications as with semantic models; you use them in the requirements gathering stage to create a design, such as mock-ups and wireframes. You can also use them to create supporting elements, like images or diagrams for various purposes (including background images, icons, or documentation).
- Power Designer: One of the most high-impact tasks that you can achieve when you start building Power BI reports is to create a theme file and re-use formatting across visuals and reports. However, theme files are complex and time-consuming to make. PowerBI.tips has created a tool that helps you design theme files and wireframes which you can use to support the design of reports. While “Power Designer” was the original name of Power BI Desktop, this new tool with the same name helps you style and template reports. Power Designer is a custom workload available in Fabric.
- Example use cases: Power Designer can help you create Power BI theme files, and can support you when you need to make decisions about styles for your reports. It can also be a useful tool for creating wireframes.
- Publisher: PowerBI.tips LLC
- Cost: See their offering on Azure marketplace
- Download and information: Power Designer
- LLM tools: Likewise, you can use LLM tools to facilitate various aspects of report development, including the creation of custom visuals in DAX (via SVG visuals), R, Python, and Deneb.
- Deneb: While technically not a tool, Deneb is a custom visual that you can get in Power BI Desktop from AppSource, which lets you create your own custom visuals by using the Vega or Vega-Lite specifications.
- Example use cases: Deneb is used for any use cases where you need to create your own custom visuals to support specific reporting requirements in Power BI. You can also save visuals as templates for easy re-use, later.
- Publisher: Daniel Marsh-Patrick
- Cost: Free (Open Source)
- Download and information: https://deneb.guide/
- PBI Explorer: PBI explorer is a lightweight tool for exploring Power BI reports.
- Example use cases:
- Inspect and compare differences between versions of a report.
- View report features that are difficult to visually identify, such as bookmarks and visual-level filters.
- Set up and use a report analyzer to get key insights about the report contents and optimize it. You can set up custom rules to analyze and optimize the report, further.
- Publisher: Tabular Tools
- Cost: Free.
- Download and information: https://www.pbiexplorer.com/
- Example use cases:
- PBI Inspector (and PBI Inspector v2): A tool for facilitating the testing and optimization of Power BI reports and visuals. PBI Inspector supports the “legacy” (.pbix) format of Power BI report metadata, while PBI Inspector V2 supports only the PBIR format of reports.
- Example use cases: Create and validate “best practice rules” against one or more reports in a Power BI tenant, run either with a graphical user interface, command line interface, or notebook.
- Publisher: Nat Van Gulck
- Cost: Free (Open Source)
- Download and information: https://github.com/NatVanG/PBI-InspectorV2/
- VS Code: VS code can be used with its various extensions the same as reports; mainly to manage metadata and Power BI or Fabric workspaces.
- Fabric notebooks: With packages like semantic link and semantic link labs, you can interact not only with models, but also reports. The report module has additional functionality working with the PBIR metadata format, only.
- Example use cases:
- View a report in a notebook as an output beneath a code cell.
- Migrate thin-report measures to the underlying semantic model.
- Bulk or mass-formatting of reports.
- Change the theme of a published report, move reports between workspaces, or make other programmatic changes to reports using Python code (including copying and re-using entire visual or page templates).
- Publisher: Microsoft
- Cost: Requires a Fabric capacity
- Download and information: Microsoft Documentation
- Example use cases:
In conclusion
There are a variety of tools out there that can make your life easier when you build Power BI semantic models or reports. You do not need to learn or use all of them. However, it is important to know that they exist, and when you might apply them to your specific scenario. In the long run, this will save you time, and it will certainly help you to make more useful models and reports, too.
In this article we have summarized some of the most commonly-used tools, but there are others too. We also expect the Power BI tool ecosystem to grow significantly, thanks to the ability to deliver custom workloads in Fabric which can provide unique developer and user experiences to solve problems across the Fabric platforms.