Topic: Time Intelligence
-
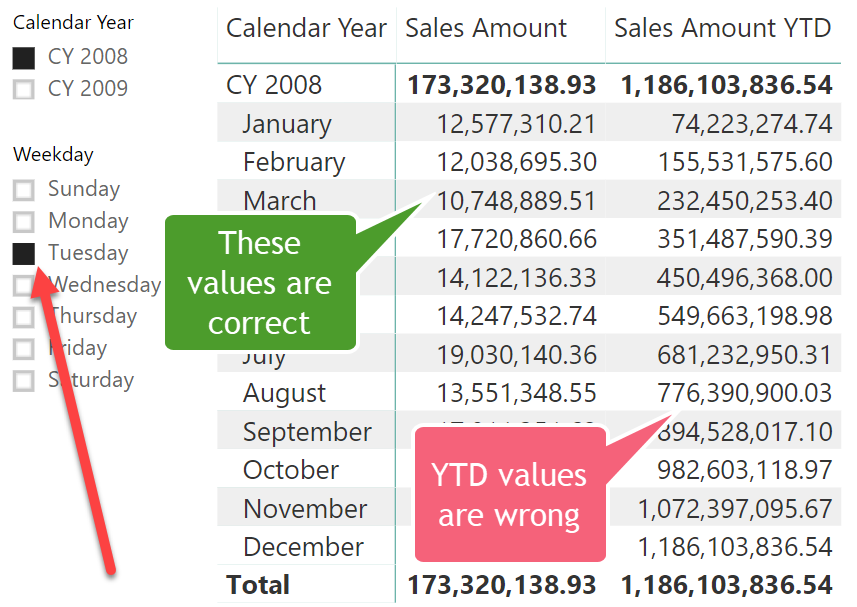
Time intelligence functions oftentimes hide an automatic ALL statement meant to make time intelligence calculations easier. This article describes this behavior and what to do in case it ends up breaking your calculation. Read more
-
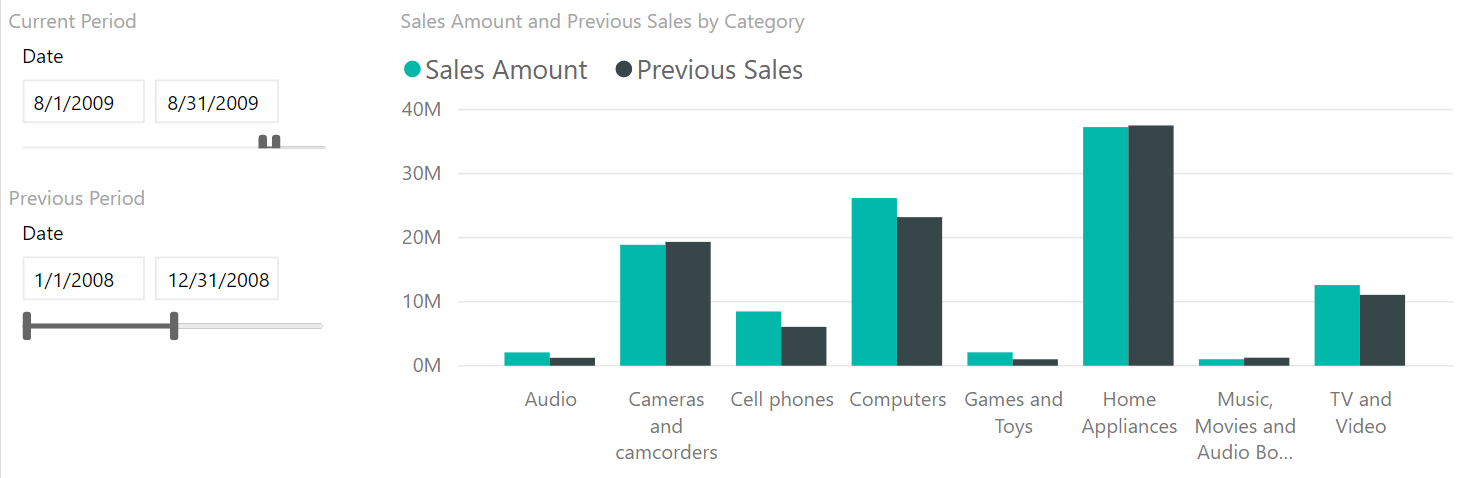
This article introduces a technique to filter and productively compare two time periods with Power BI. Read more
-
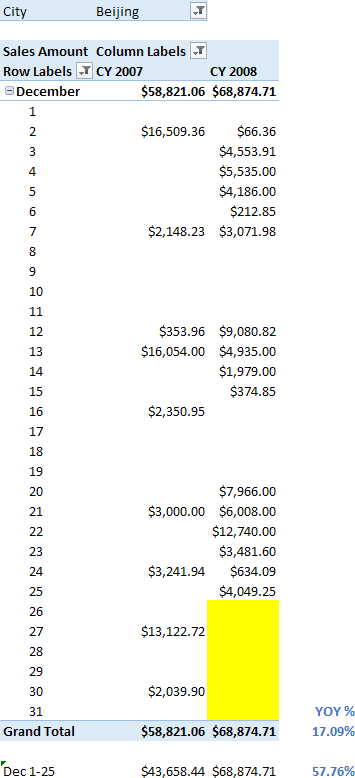
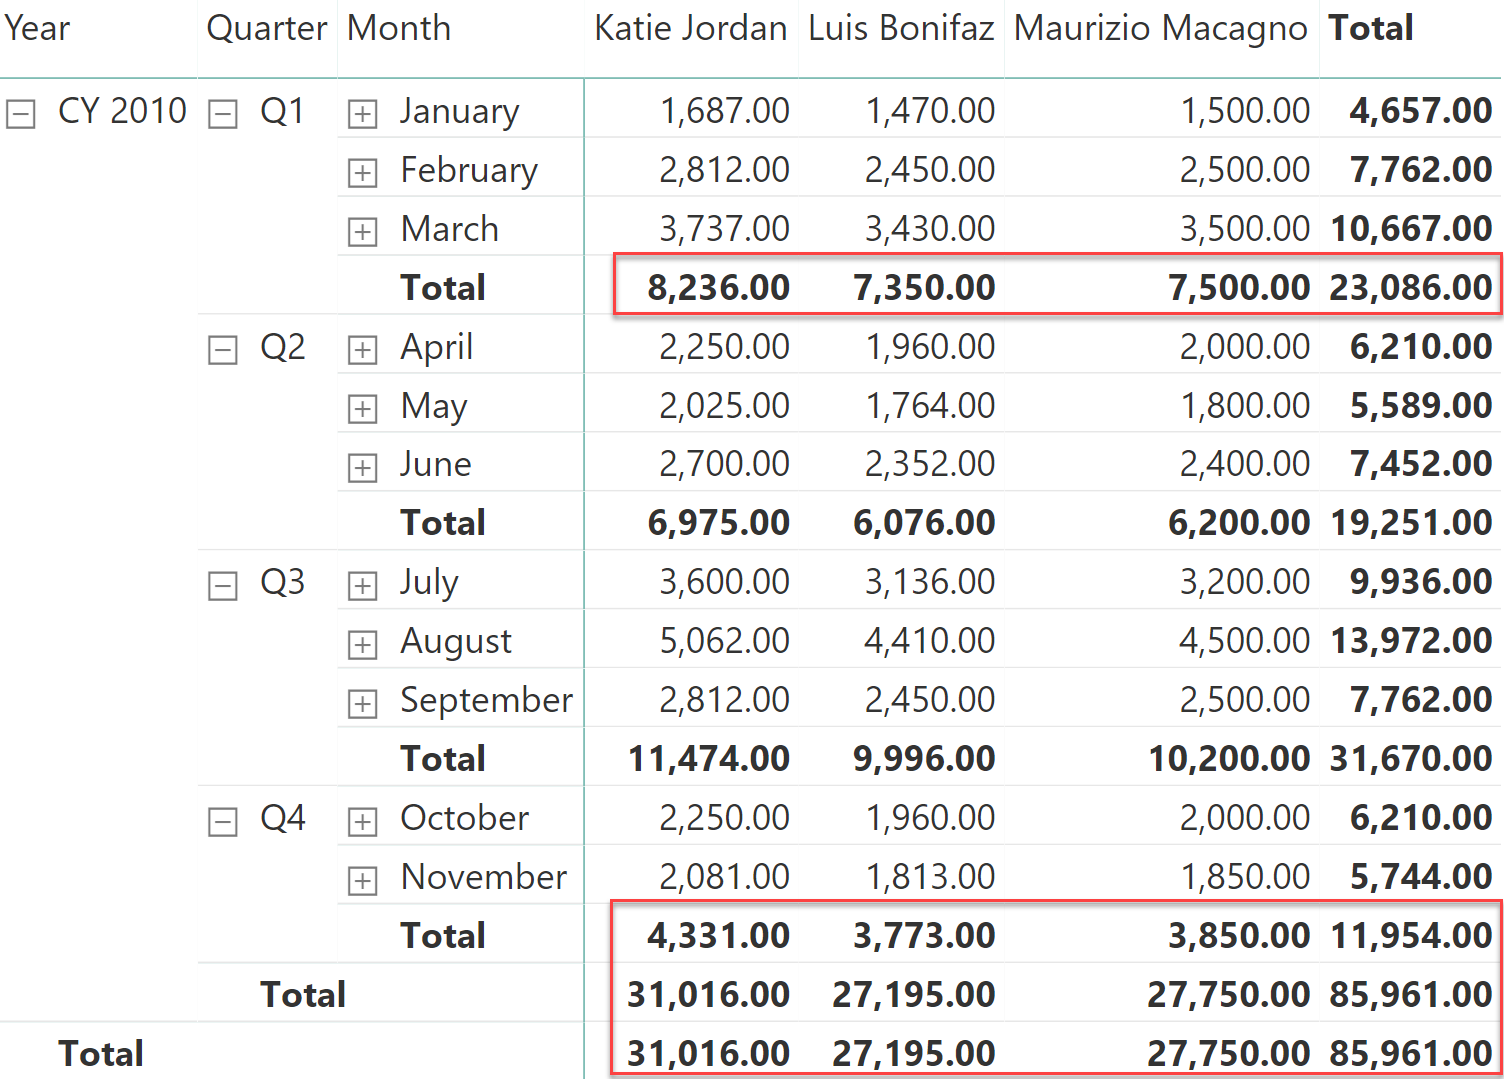
If you do not have a full month with data, comparisons such as year-over-year (YOY) might require particular filters in order to do a like for like comparison in DAX. This article describes how to write DAX expressions comparing equivalent… Read more
-
In Power BI Desktop (as of February 2016) you have to use DAX to apply calculations over dates (such as year-to-date, year-over-year, and others), but you do not have the Mark as Date Table feature. This article describes which scenarios… Read more
-
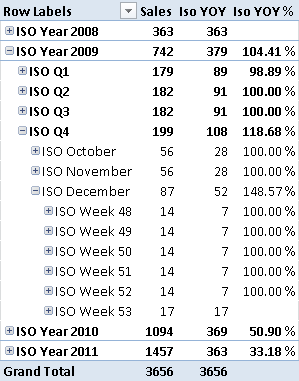
This article describes how to implement a custom year-over-year calculation in DAX based on arbitrary associations between different periods. As an example, we describe the comparison of the 53rd week in a ISO Calendar. Read more
-
Values such as inventory and account balance, usually calculated from a snapshot table, require the use of semi-additive measures. This article describes how to implement these calculations in DAX according to your specific requirements. Read more
-
Values such as inventory and balance account, usually calculated from a snapshot table, require the use of semi-additive measures. In Multidimensional you have specific aggregation types, like LastChild and LastNonEmpty. In PowerPivot and Tabular you use DAX, which is flexible… Read more
-
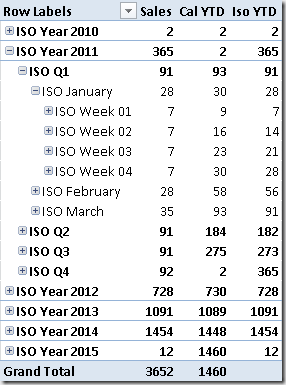
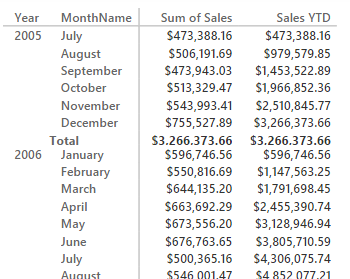
The DAX language provides several Time Intelligence functions that simplify writing calculations such as year-to-date (YTD), year-over-year (YOY) and so on. However, if you have a special calendar structure such as a 4-4-5 weeks’ calendar, you need to write your… Read more
-
This article explains the behavior of LASTNONBLANK, LASTNONBLANKVALUE, and similar DAX functions, also providing patterns for performance optimization. Read more
-
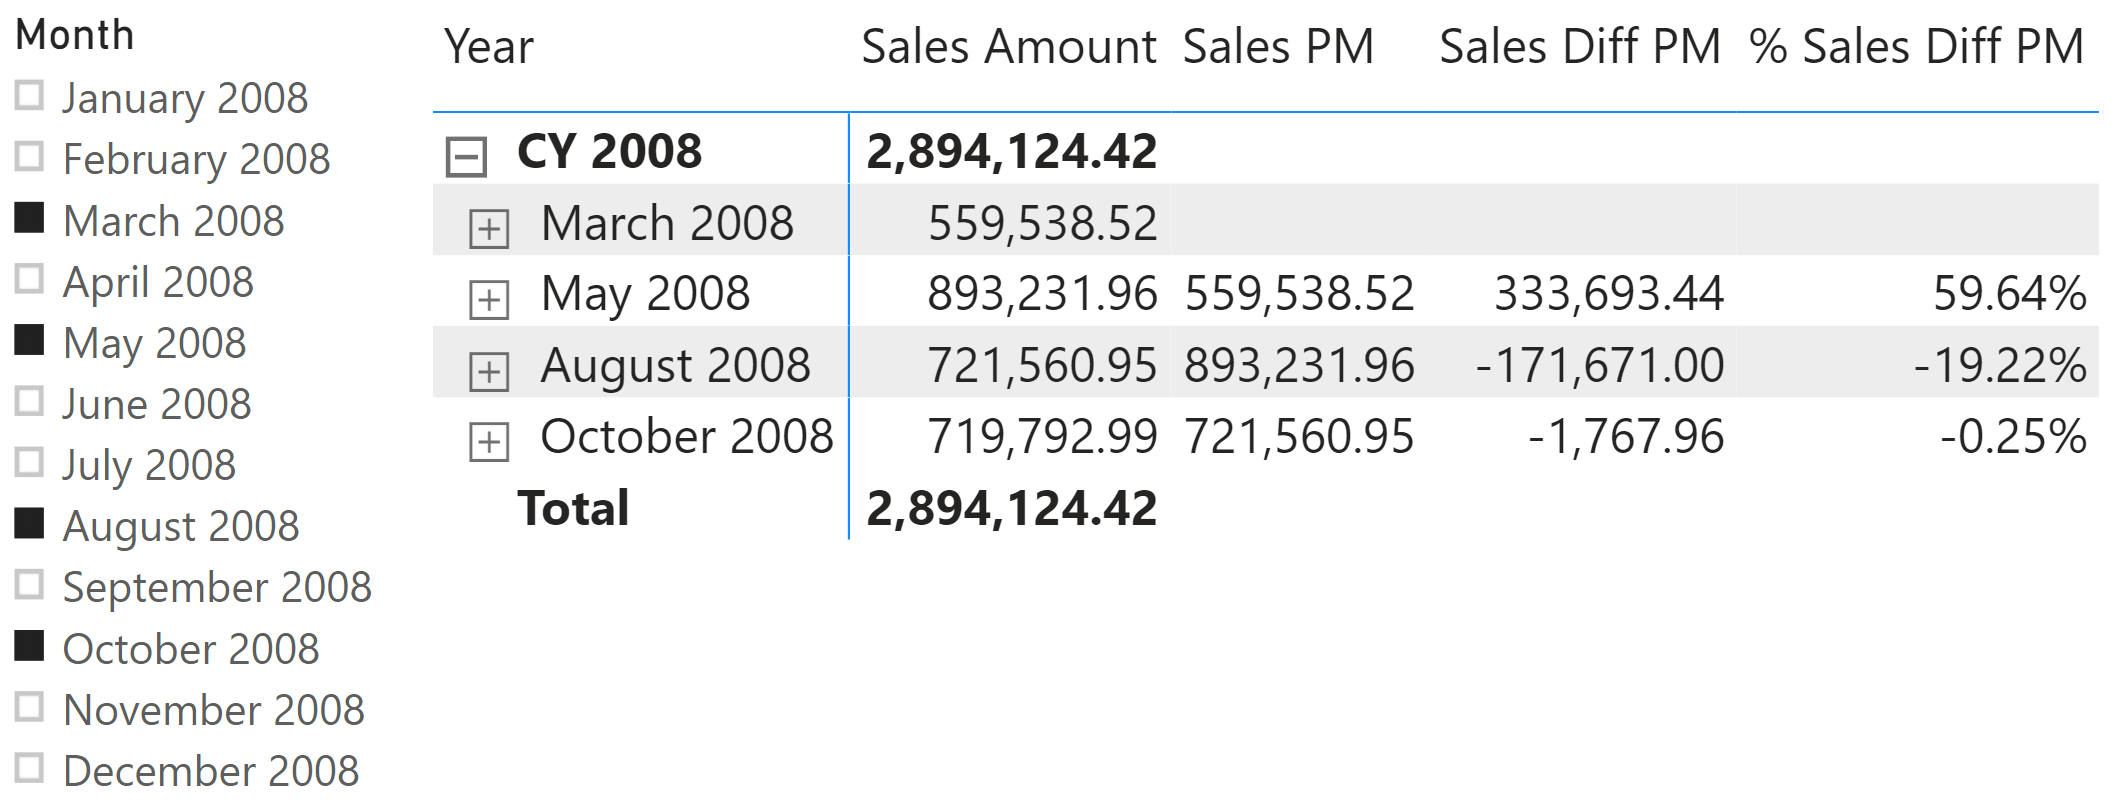
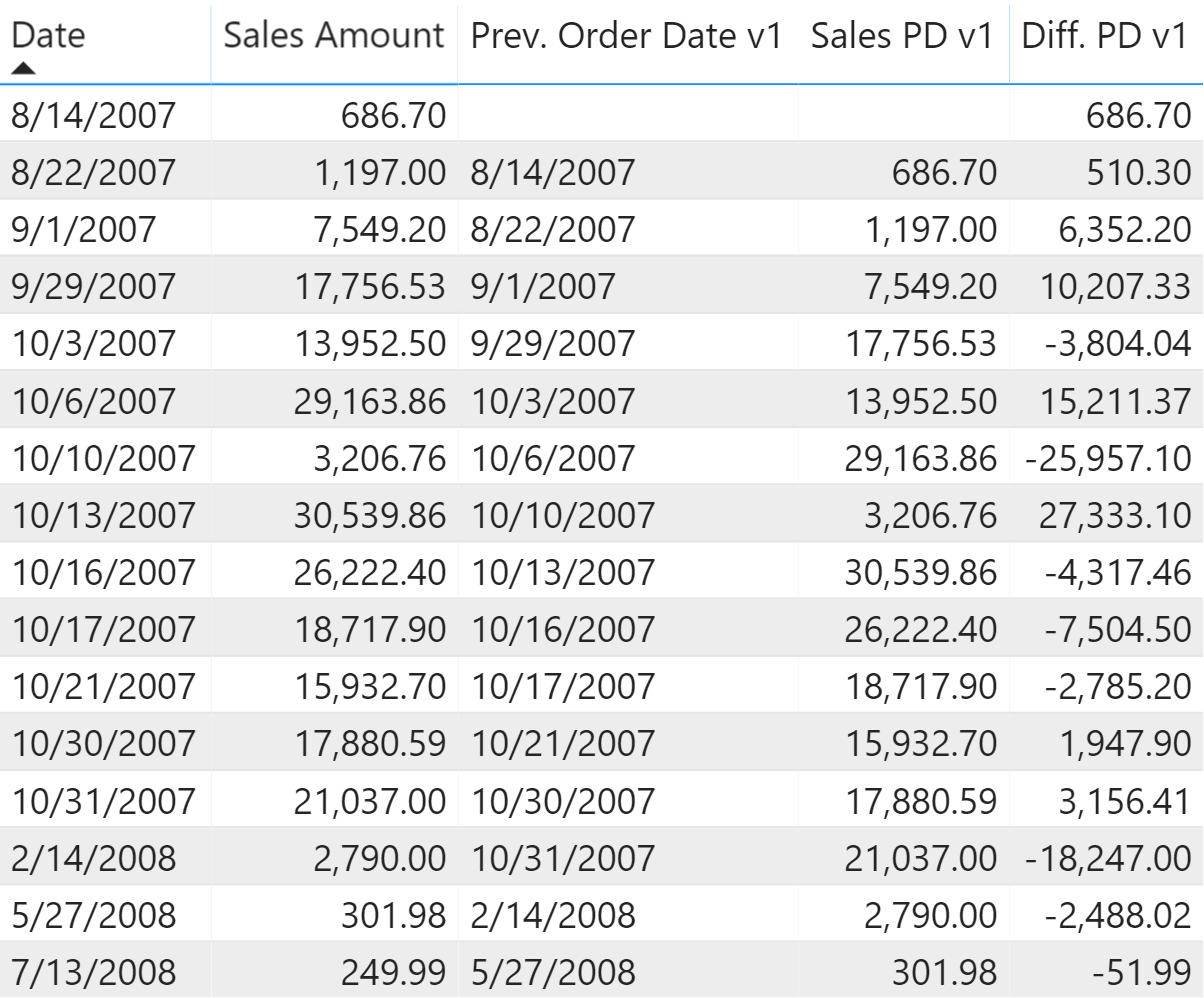
This article describes how you can create a comparison with the previous time period in a visualization, regardless of whether the time periods are consecutive or not. Read more