 Alberto Ferrari
UPDATE 2020-11-10: You can find more complete detailed and optimized examples for semi-additive calculations in the DAX Patterns: Semi-additive calculations article+video on daxpatterns.com.
NOTE: this article replaces a previous versions published in 2013 and based on Power Pivot.
Semi-additive calculations are quite the challenge for any BI developer, and DAX is no exception. These measures are not hard to compute; the complex part is understanding the desired behavior precisely.
First things first: what is a semi-additive calculation? Any calculation can be either additive, non-additive or semi-additive. An additive measure uses SUM to aggregate over any attribute. The sales amount is a perfect example of an additive measure. Indeed, the sales amount for all customers is the sum of the individual sales for each customer; at the same time, the amount over a year is the sum of the amounts for each month.
A non-additive measure does not use SUM over any dimension. Distinct count is the simplest example: the distinct count of products sold over a month is not the sum of the distinct counts of individual days. The same happens with any other dimension: a distinct count of products sold in a country is not the sum of the distinct counts of the products sold in each city in the country.
Semi-additive calculations are the hardest ones: a semi-additive measure uses SUM to aggregate over some dimensions and a different aggregation over other dimensions – a typical example being time.
As an example, we use a model that contains the balance of current accounts. Over the customers, the measure must be additive: the total balance for all customers is the sum of the balance for each customer. Nevertheless, when aggregating over time you cannot use the SUM function. The balance of a quarter is not the sum of individual monthly balances. Instead, the measure should report the last balance of the quarter.
Therefore when aggregating balances, the measure must use a different behavior when aggregating over time or over other dimensions. This makes the measure semi-additive: sometimes it is additive, sometimes it is not.
As you can see, a simple SUM to aggregate balances returns the wrong result both at the quarter and at the year levels:
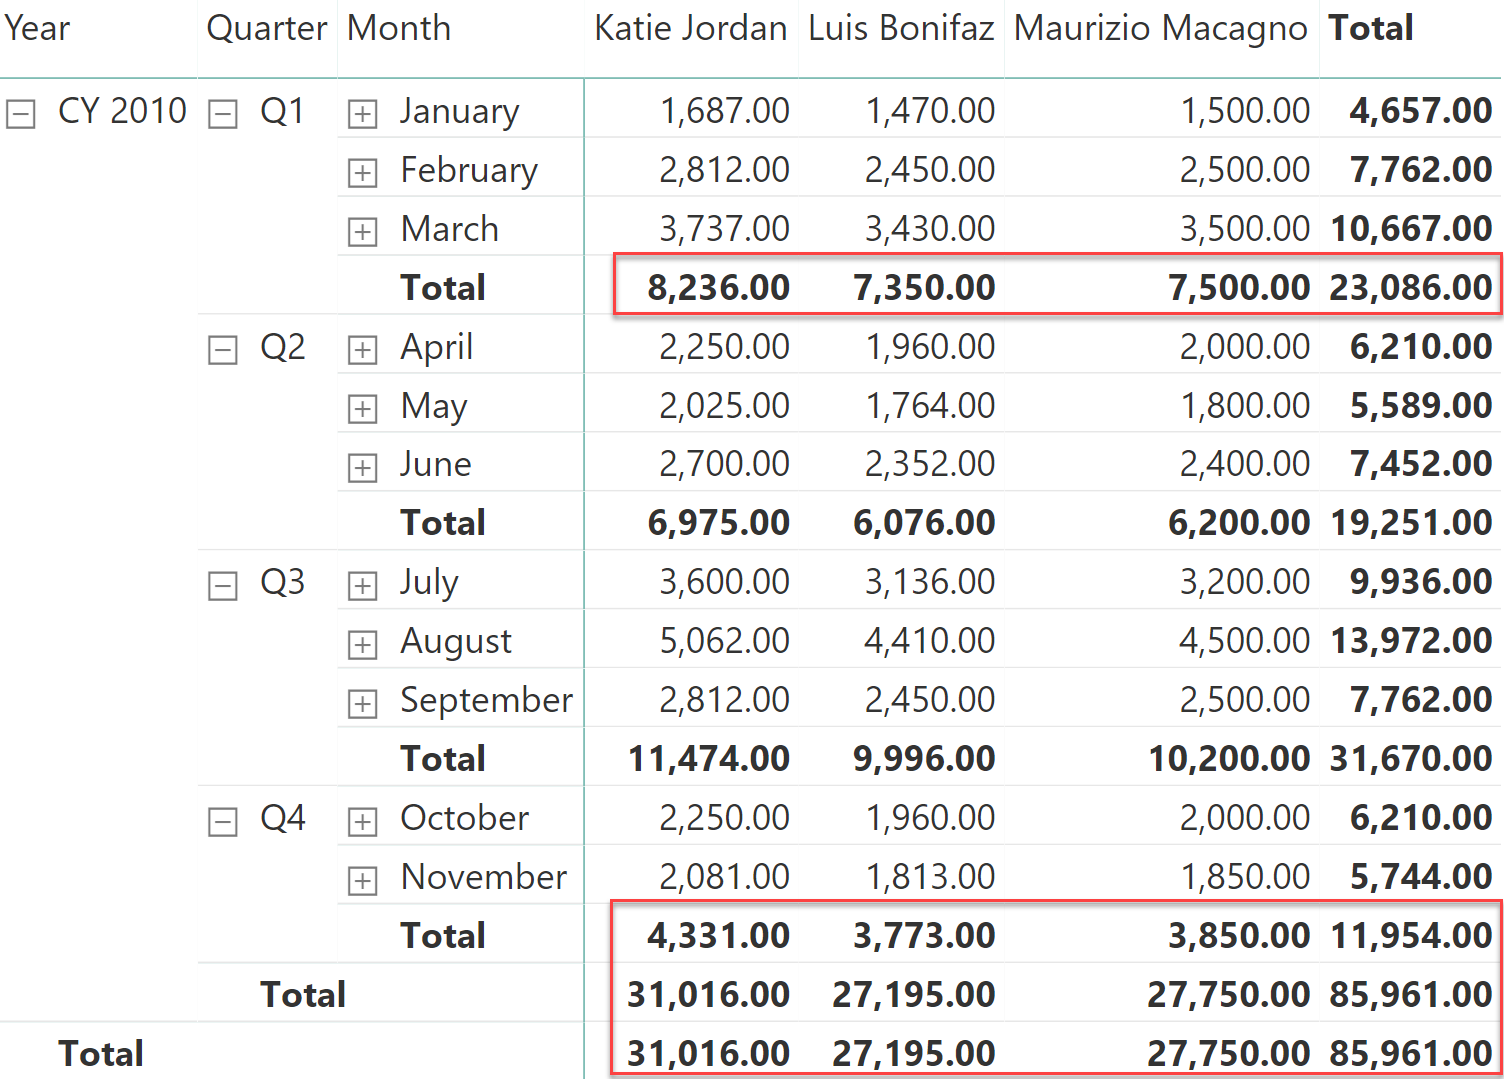
The total at the quarter level cannot be computed by summing the individual months. Instead, the formula must only consider the last value. A first solution to this scenario is to rely on the LASTDATE function, which returns the last visible date in the filter context, packed in a table suitable as a filter argument of CALCULATE:
LastBalance LD :=
CALCULATE (
    SUM ( Balances[Balance] ),
    LASTDATE ( 'Date'[Date] )
)
LASTDATE returns the last date visible in the filter context. Therefore, for a quarter it returns the last day of the quarter and for a year it returns the last date of the year. Though it is a very simple function, in our sample data it still does not provide the correct result.
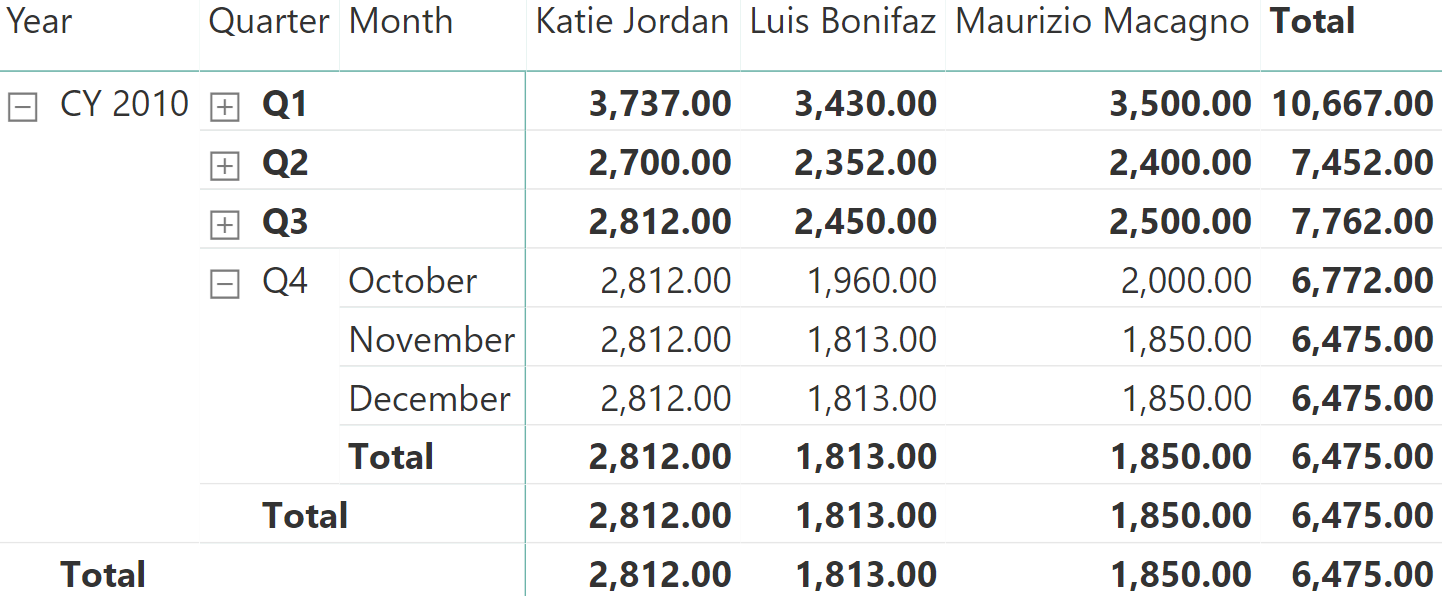
In the next figure, you can appreciate that the totals at the quarter level are now correct, because they report the last balance. Nevertheless, the results are wrong (being empty) in the last quarter and at the year level.
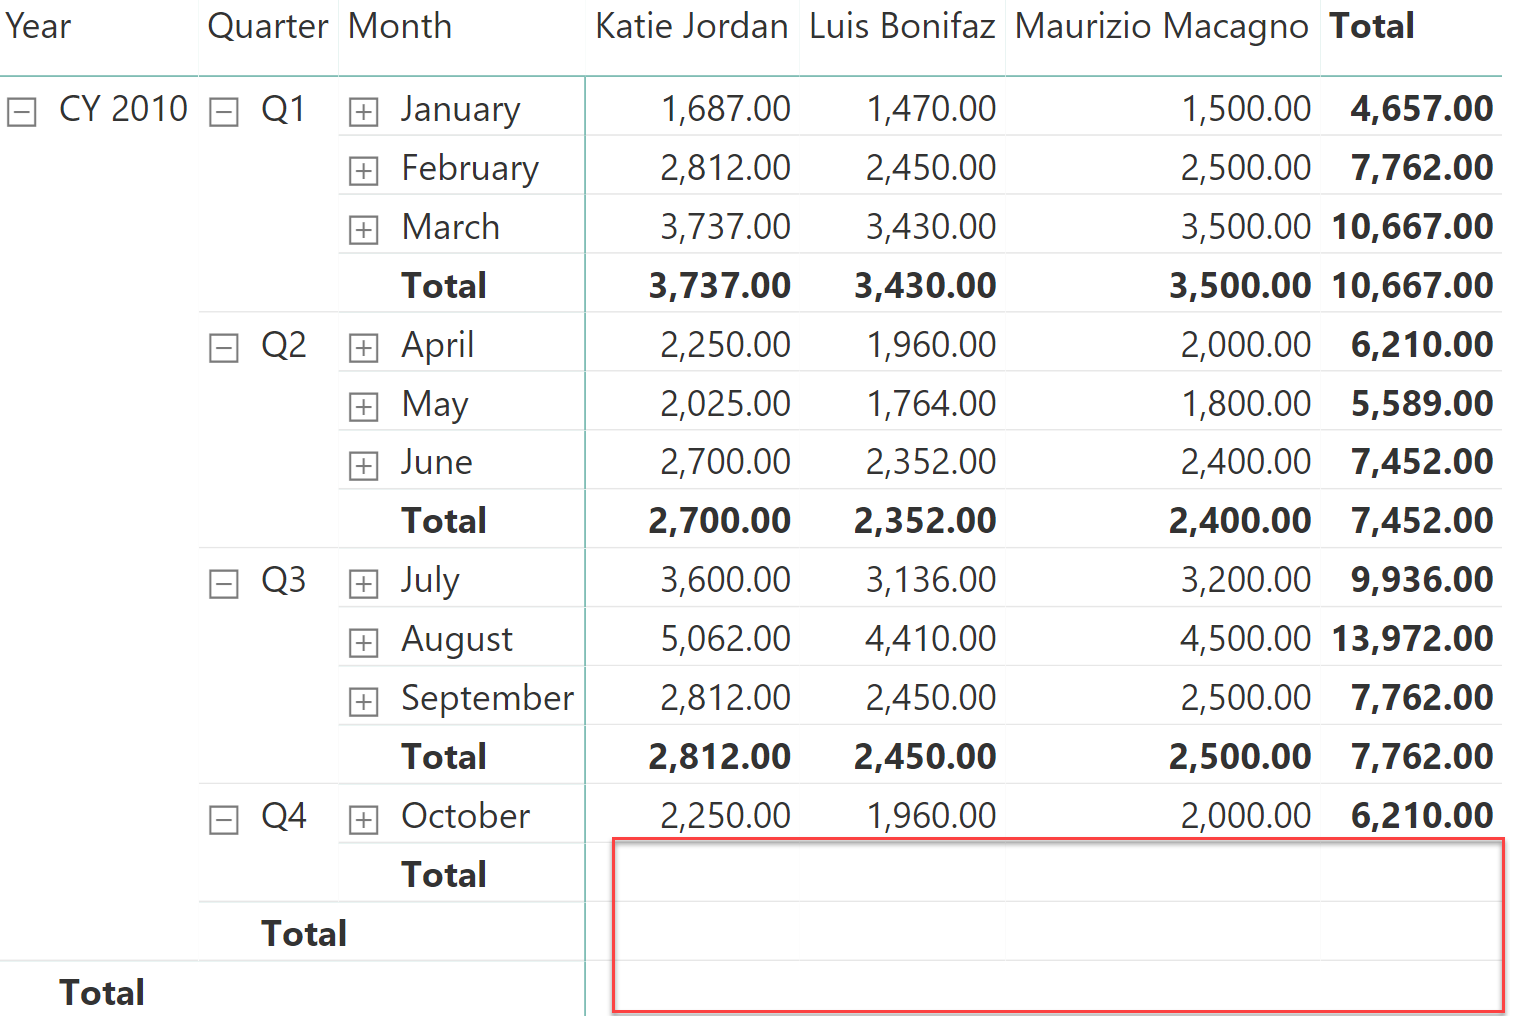
Moreover, it is worth noting that the month of November – which was visible in the previous figure – has now disappeared from the report.
The reason is that LASTDATE works on the Date table. The last date returned is the last day of the month (that is, the end of November) or of the year (December 31). If data is not available on the last date as with our model, the measure returns a BLANK.
A better solution would be to search for the last date for which there is data. Indeed, instead of searching for the last date in the Date table, the formula can compute the last date from the Balances table, making sure that the date returned contains information. The second trial is much more promising:
LastBalance MD :=
VAR LastBalanceDate = MAX ( Balances[Date] )
RETURN
    CALCULATE (
        SUM ( Balances[Balance] ),
        'Date'[Date] = LastBalanceDate
    )
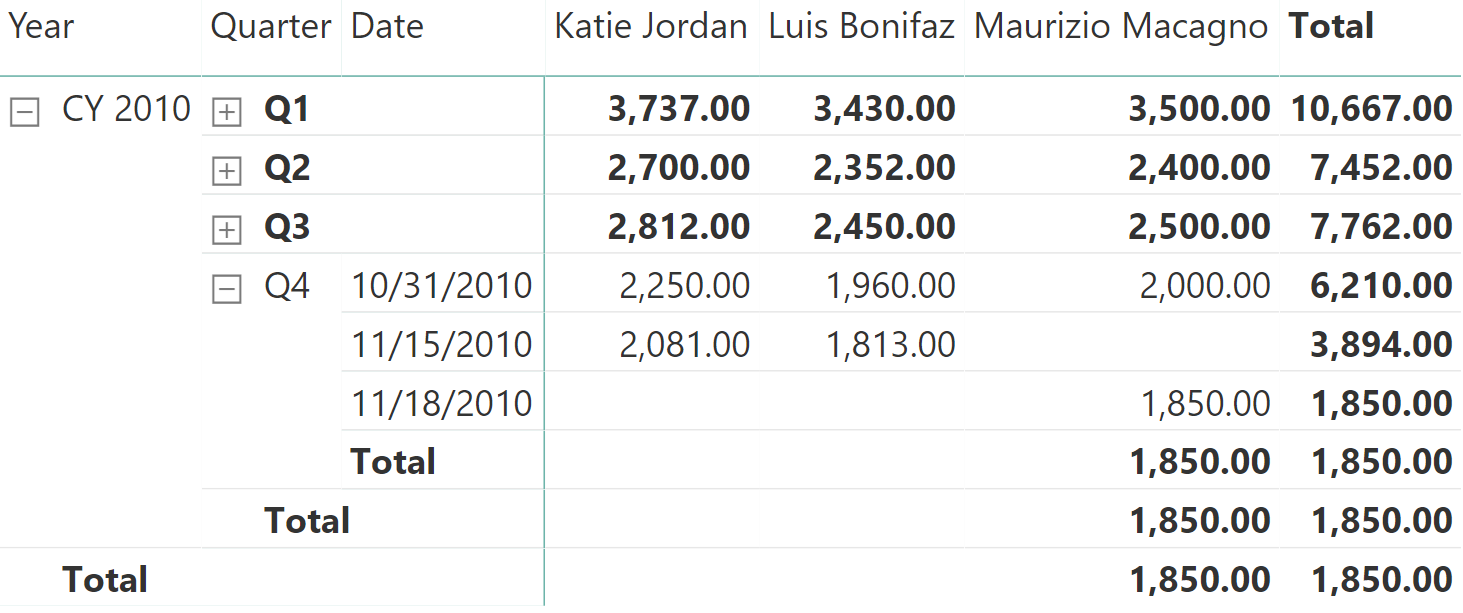
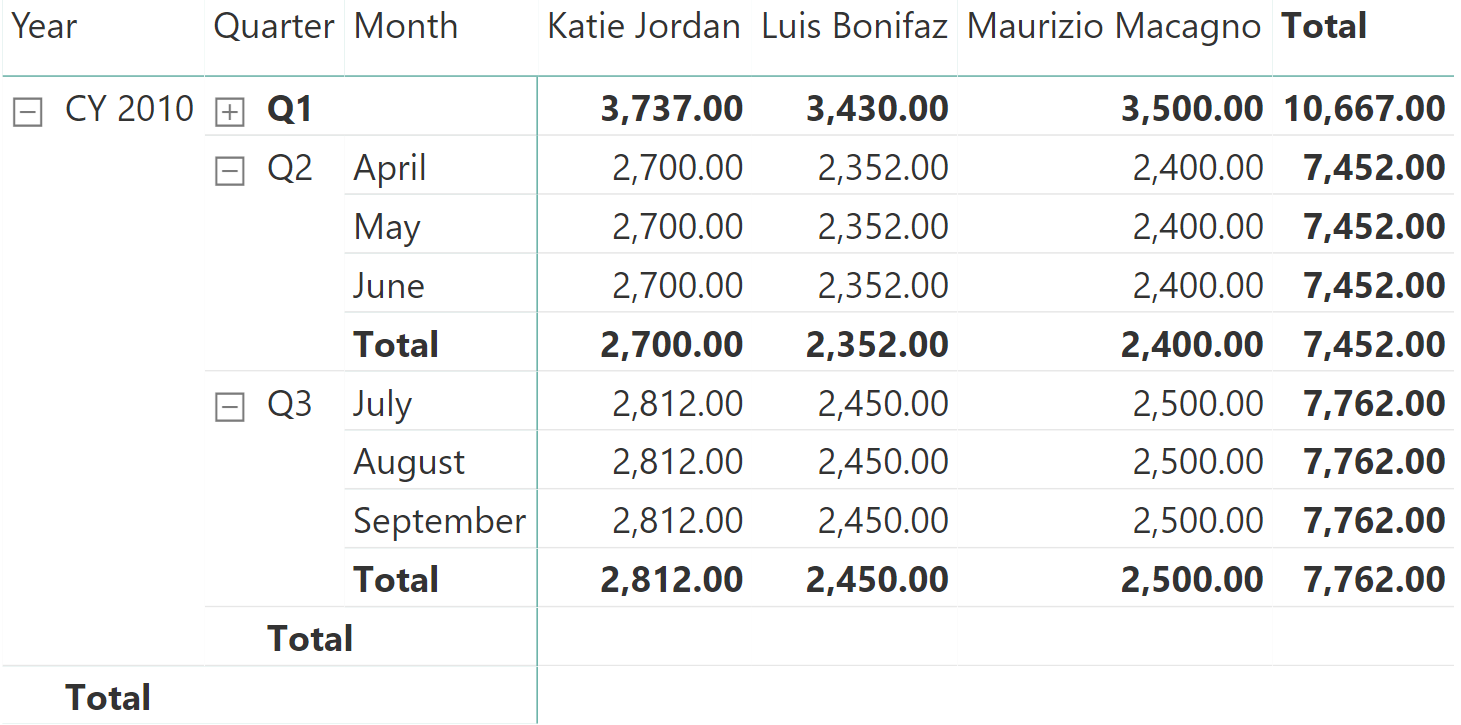
As you can see in the next figure, the result for November is now back, along with the totals at the year level. Unfortunately, if you carefully look at the grand total, it is still wrong.
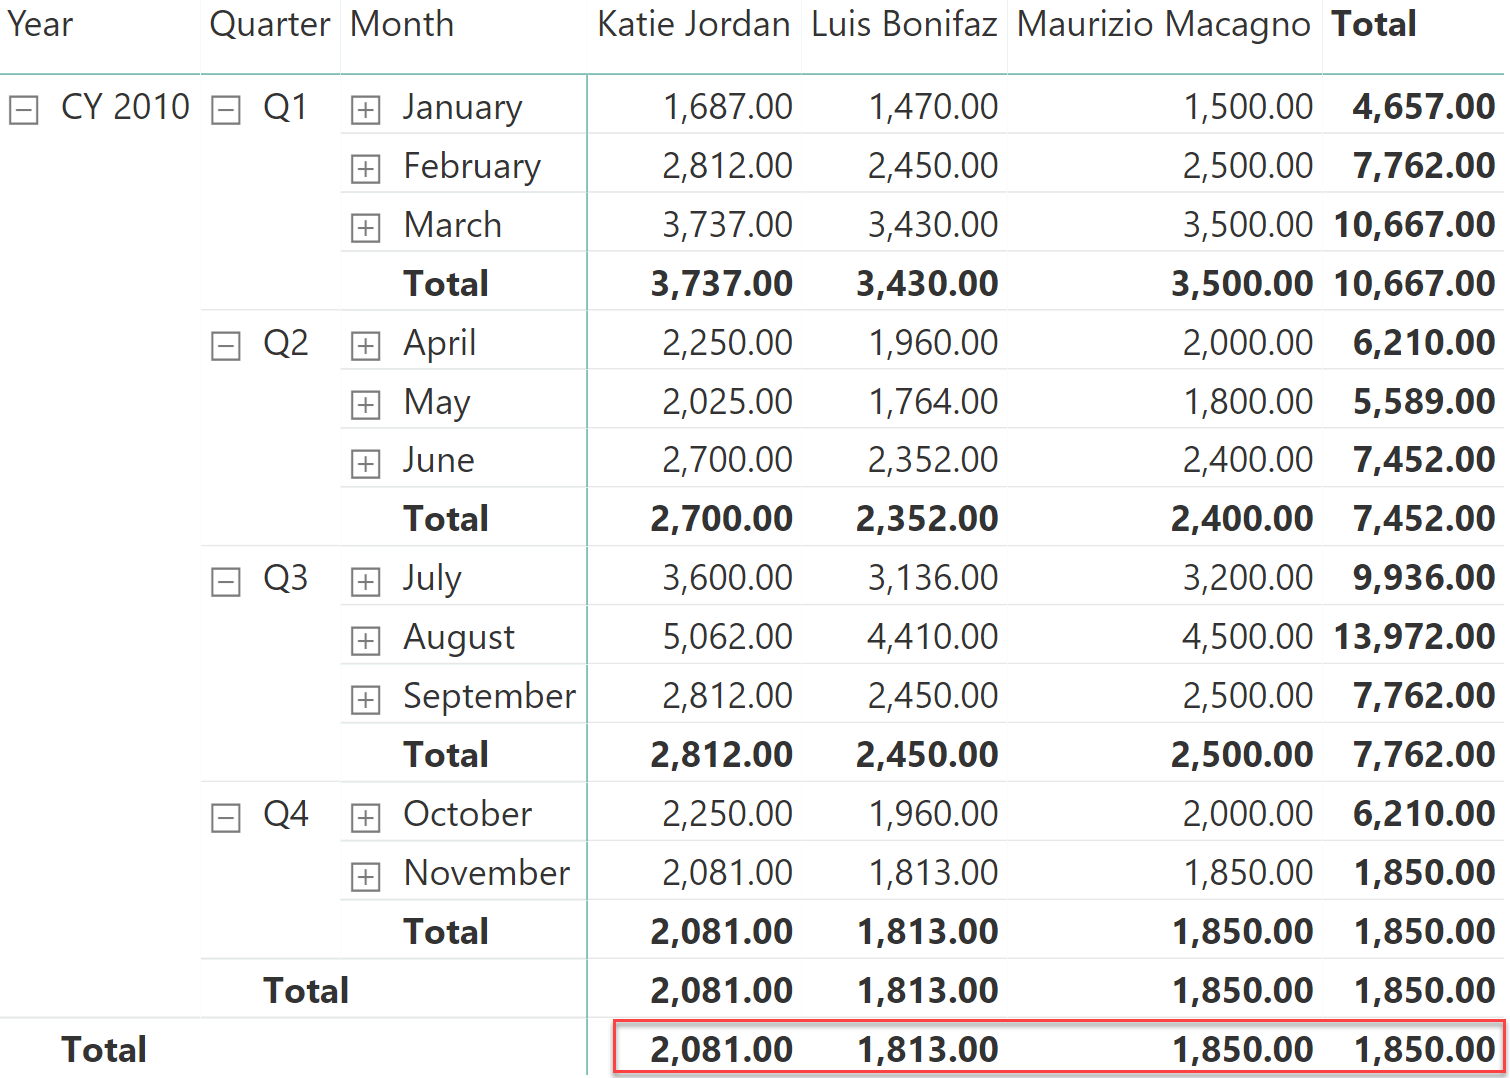
Taken individually for each customer, the totals make sense. Nevertheless, the grand total is not the sum of the customer values; instead it only reports the value for Maurizio Macagno. To make sense of the number reported, we need to replace the month with the actual dates of the balance:
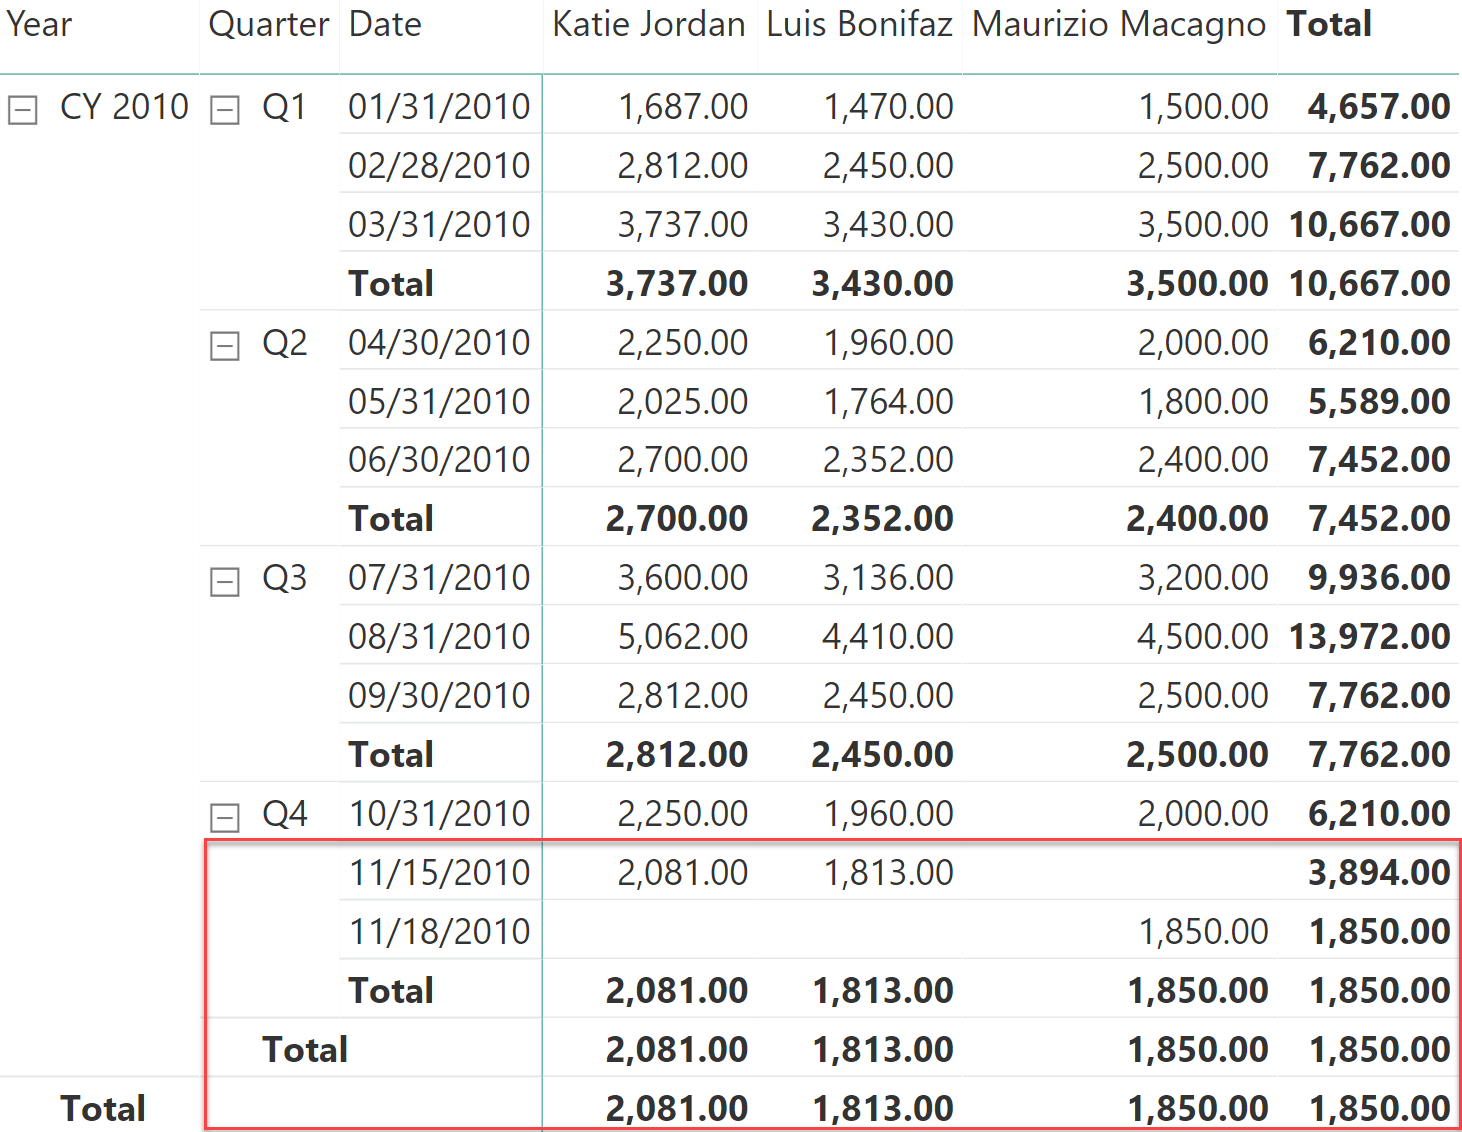
As you can see, Katie Jordan and Luis Bonifaz reported the balance on November 15, whereas Maurizio Macagno reported the last balance on November 18. As a consequence, when DAX computes the last date for the first two customers, it computes November 15. When it computes the last date for Maurizio Macagno, the last date is November 18. Alas, when no customer is in the filter context, the last date is the last date of all the customers, that is, November 18. It turns out that on November 18, there is no data for Katie Jordan nor for Luis Bonifaz.
As it always goes with DAX, it is not that the formula is wrong: it is computing exactly what we are asking for. The problem is that we are asking the wrong question. There are two possible solutions to this scenario, and the right choice depends on specific requirements:
- We change the grand total, summing the values of individual customers.
- We blank the value of Katie Jordan and Luis Bonifaz, because their last date is earlier than the last date for other customers.
The latter is easier to solve. Instead of computing the last date for the current customer, we use ALL to compute the last date for any customer:
LastBalance MDA :=
VAR LastBalanceDate = CALCULATE ( MAX ( Balances[Date] ), ALL ( Balances[Name] ) )
RETURN
    CALCULATE (
        SUM ( Balances[Balance] ),
        'Date'[Date] = LastBalanceDate
    )
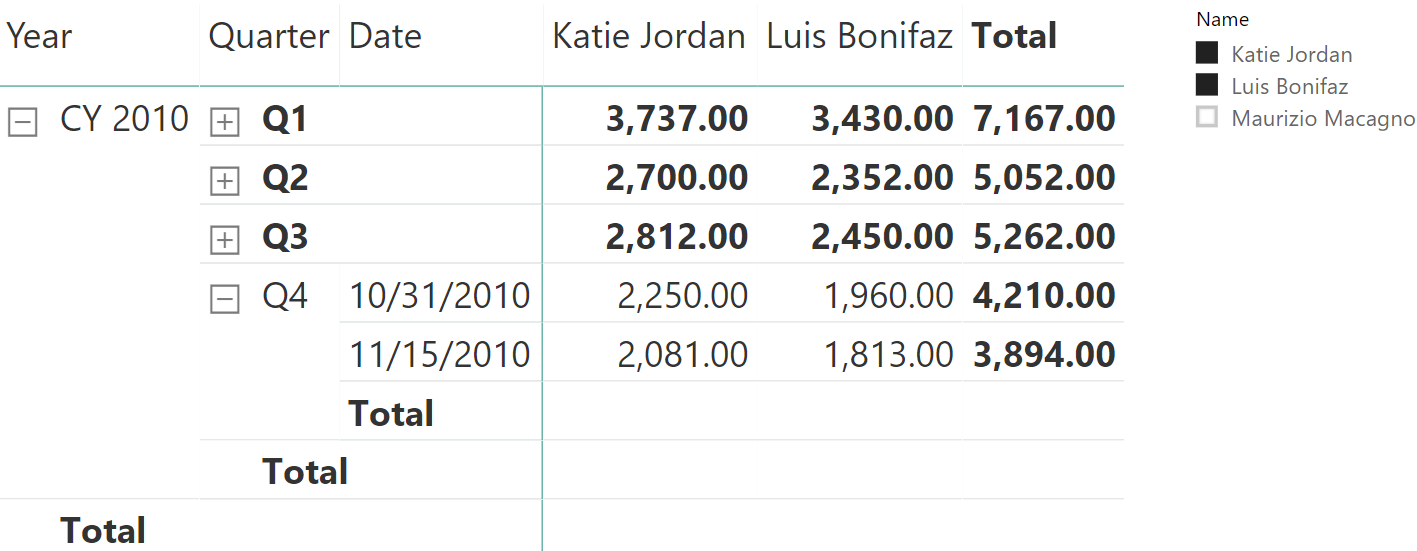
The result is that now, the first two customers show a blank balance but the total looks more meaningful.
The major drawback of this solution is that if one removes Maurizio Macagno with a slicer, the numbers are hard to interpret.
Be mindful that – despite being hard to read – the result is correct, because it satisfies the requirement of the business. In such a case, it is helpful to add to the report a label clearly stating the last considered day for the calculation, so that users have a quick insight that the last day reported is not the last day used for the calculation.
The other solution is to compute the grand total by summing individual values. You can obtain this by using a simple SUMX over the customers:
LastBalance MDS :=
SUMX (
    VALUES ( Balances[Name] ),
    VAR LastBalanceDate = CALCULATE ( MAX ( Balances[Date] ) )
    RETURN
        CALCULATE (
            SUM (Balances[Balance]),
            'Date'[Date] = LastBalanceDate
        )
)
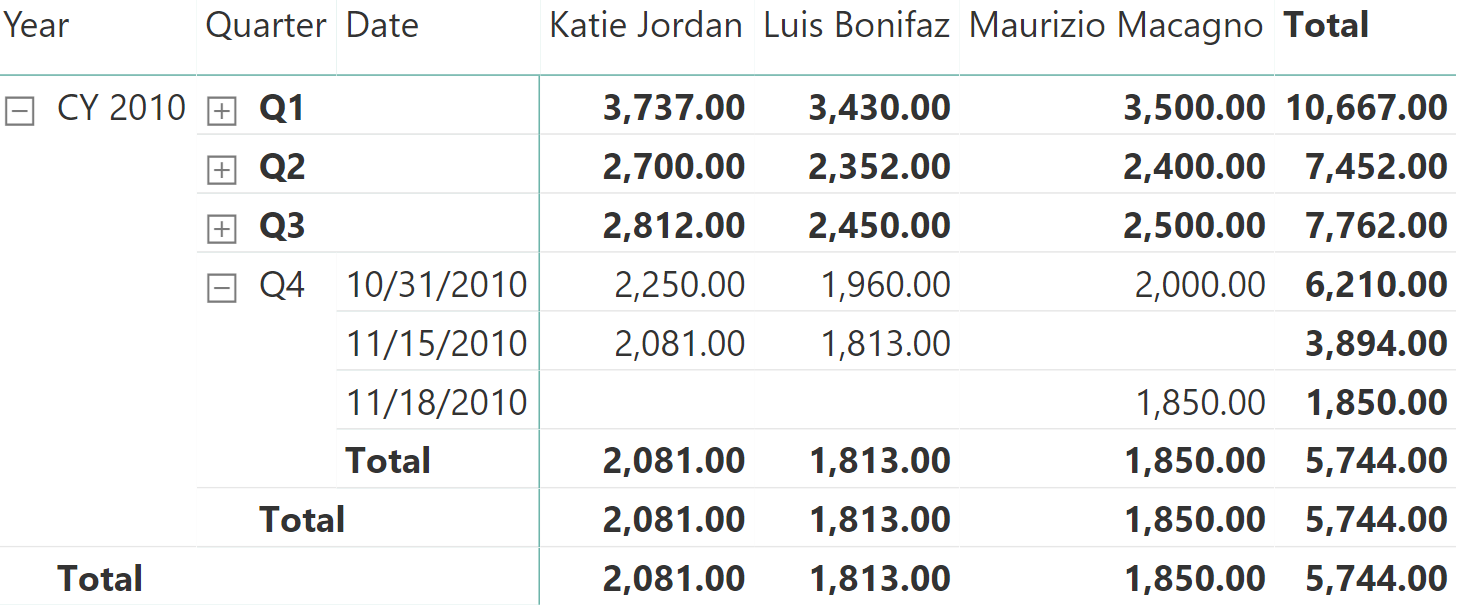
The result is neat, though depending on the business requirement, it might not be what the users need.
The only drawback of this last formula is the presence of the SUMX iteration, which might lead to bad performance if there are many customers. A better solution requires you to understand data lineage. It requires you to compute the last date for each customer and then use it as a filter argument of CALCULATE, after updating its lineage to the correct one:
LastBalance MDS optimized :=
VAR LastDates =
    ADDCOLUMNS (
        VALUES ( Balances[Name] ),
        "LastDay", CALCULATE (
            MAX ( 'Balances'[Date] )
        )
    )
VAR LastDatesWithLineage =
    TREATAS (
        LastDates,
        Balances[Name],
        'Date'[Date]
    )
RETURN
    CALCULATE (
        SUM ( Balances[Balance] ),
        LastDatesWithLineage
    )
The result is the very same as the previous figure.
The final consideration is that the last date by customer might be outside of the current filter context, leading to inaccurate results. To highlight this, let us tweak the data and remove all balances for Katie Jordan in Q4. Therefore, the last date for Katie Jordan will be September 30.
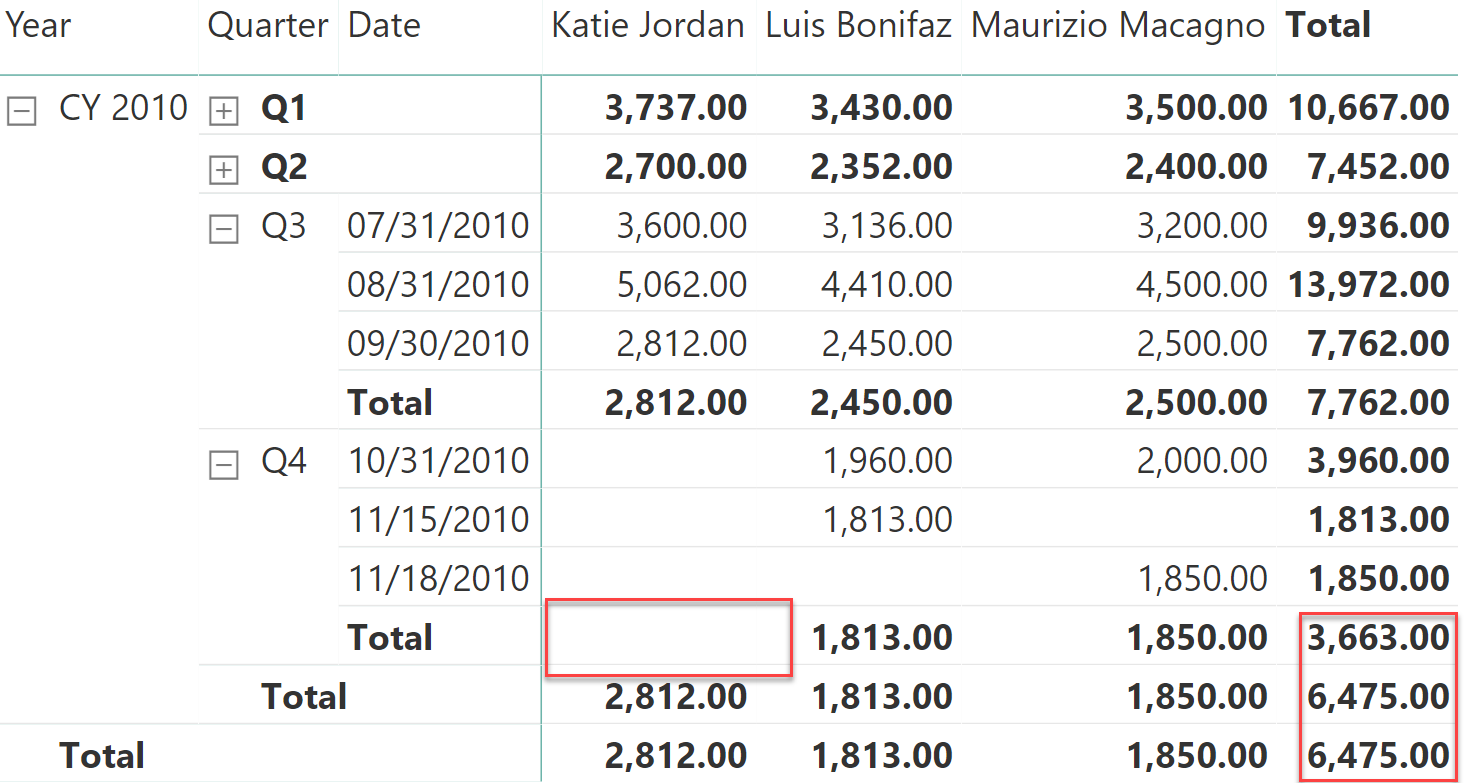
As you see, in Q4 Katie Jordan reports a blank which is also reflected in the row total of Q4. However at the year level, her value goes back to the last available value, therefore changing the totals.
Computing the last value even when it appears outside of the current context requires higher attention to detail and the code is more complex:
LastBalance Ever :=
VAR MaxDate =
    MAX ( 'Date'[Date] )
VAR LastDates =
    ADDCOLUMNS (
        CALCULATETABLE (
            VALUES ( Balances[Name] ),
            ALL ( 'Date' )
        ),
        "LastDay", CALCULATE (
            MAX ( 'Balances'[Date] ),
            ALL ( 'Date' ),
            'Date'[Date] <= MaxDate
        )
    )
VAR LastDatesWithLineage =
    TREATAS (
        LastDates,
        Balances[Name],
        'Date'[Date]
    )
VAR Result =
    CALCULATE (
        SUM ( Balances[Balance] ),
        LastDatesWithLineage
    )
RETURN
    Result
This last formula reports the value for Katie Jordan, although it happens to be earlier than the current selection.
Let us quickly recap the article so far. To solve semi-additive calculations, you can use the LASTDATE function which comes with a strong limitation: it only searches in the date table because it fails to find the most desirable outcome, which is the last date with transactions. Therefore, you can build your own set of calculations by authoring DAX code of increasing complexity, which strongly depends on the requirements.
Similar to LASTDATE, there is a rich set of predefined functions in DAX. For example, LASTNONBLANK is an iterator that performs a calculation similar to the ones we have shown, although it is typically slower than searching for the max date in the fact table. This is the reason we did not cover it in this article. However, LASTNONBLANK could be the right function to use in case the last date condition depends on a complex set of requirements that have to be expressed in a DAX measure. Therefore, use LASTNONBLANK only when it is not possible to use a simpler and more efficient solution based on the patterns described in this article.
Another set of DAX functions that are not commonly used is the set of opening and closing dates. For example, STARTOFQUARTER returns the opening date of the current quarter, whereas ENDOFMONTH returns the closing date of the month. There are many other similar functions, for different periods (month, quarter, and year). Nevertheless, all these functions operate on the date table only, therefore they do not return the first or last date in the period for which there is data. They behave much like LASTDATE, and they display similar issues. You can use these functions whenever the underlying snapshot data is always present in the expected dates.
In the sample model used in this article, the starting balance of the quarter cannot be computed using these functions. For example, consider the following measure using STARTOFQUARTER:
Opening Quarter Balance :=
CALCULATE (
    SUM ( Balances[Balance] ),
    STARTOFQUARTER ( 'Date'[Date] )
)
The result is a completely empty report, because the first date of the quarter has no data in our dataset. Trying with ENDOFQUARTER produces a better result, albeit still wrong. As you can see, Q4 and year totals are still missing. This scenario is very similar to what happened with the first implementation using LASTDATE.
The STARTOFMONTH, STARTOFQUARTER, STARTOFYEAR, ENDOFMONTH, ENDOFQUARTER, and ENDOFYEAR functions are only useful when the dataset is complete with all the start and end dates of each time period. When this is not the case, you can implement a custom logic using the other techniques previously described in this article.
As you have seen, semi-additive calculations require paying attention to small details. It is very easy to author a wrong calculation, which seems to work on some scenarios but fails when the report is laid out differently, or when the data is updated.
Clearly understanding the requirement, DAX is flexible enough to allow you to implement any semi-additive calculation in an efficient way.
Adds all the numbers in a column.
SUM ( <ColumnName> )
Returns last non blank date.
LASTDATE ( <Dates> )
Evaluates an expression in a context modified by filters.
CALCULATE ( <Expression> [, <Filter> [, <Filter> [, … ] ] ] )
Returns a blank.
BLANK ( )
Returns all the rows in a table, or all the values in a column, ignoring any filters that might have been applied.
ALL ( [<TableNameOrColumnName>] [, <ColumnName> [, <ColumnName> [, … ] ] ] )
Returns the sum of an expression evaluated for each row in a table.
SUMX ( <Table>, <Expression> )
Returns the last value in the column for which the expression has a non blank value.
LASTNONBLANK ( <ColumnName>, <Expression> )
Returns the start of quarter.
STARTOFQUARTER ( <Dates> )
Returns the end of month.
ENDOFMONTH ( <Dates> )
Returns the end of quarter.
ENDOFQUARTER ( <Dates> )
Returns the start of month.
STARTOFMONTH ( <Dates> )
Returns the start of year.
STARTOFYEAR ( <Dates> [, <YearEndDate>] )
Returns the end of year.
ENDOFYEAR ( <Dates> [, <YearEndDate>] )