 Marco Russo
Time intelligence calculations in DAX are usually created considering consecutive periods in any type of comparisons. This approach might not work well when the requirement is to compare the differences between a selection of non-consecutive periods. In that case, the “previous” element in a visualization might not correspond to the previous element in the data model.
For example, consider the following report where the slicer selects an arbitrary set of months within a year: March, May, August, and October 2008.
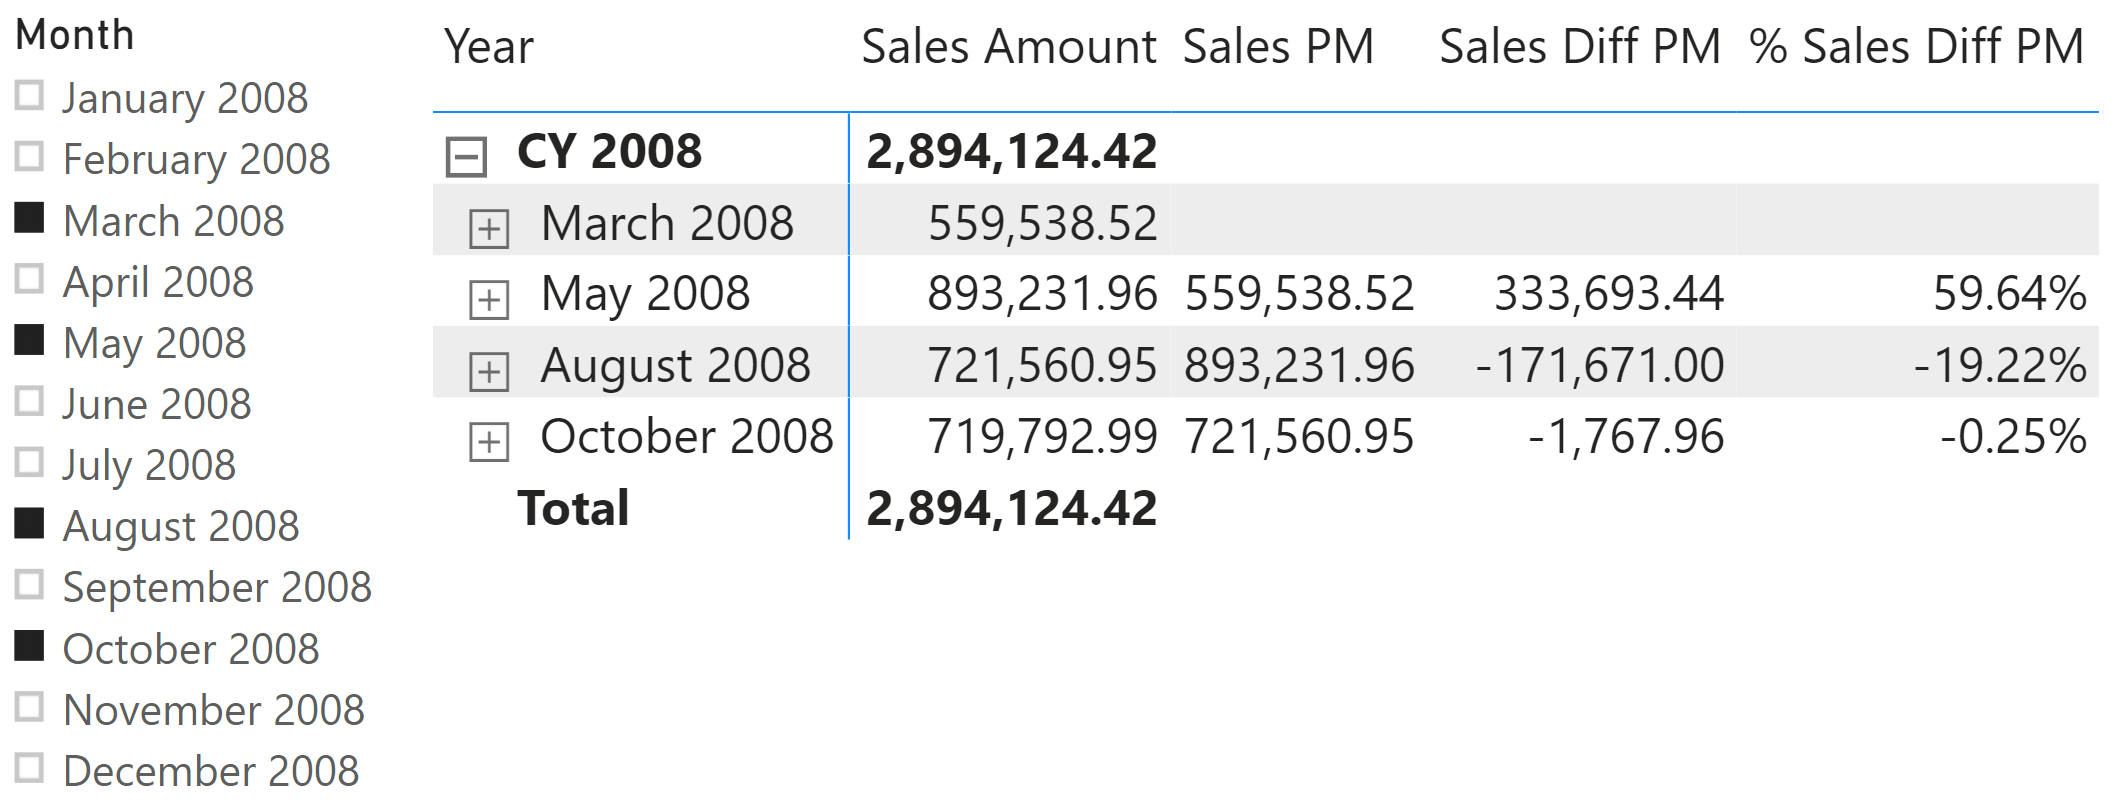
The Sales Diff PM and % Sales Diff PM measures provide the difference between the Sales Amount of the month displayed in the row and the month displayed in the previous row of the matrix visualization. These two measures are based on the Sales PM measure, which returns the Sales Amount of the previous selected month in the same visualization.
Sales Diff PM :=
VAR SalesCurrentMonth = [Sales Amount]
VAR SalesPreviousMonth = [Sales PM]
VAR Result =
    DIVIDE (
        SalesCurrentMonth - SalesPreviousMonth,
        ( NOT ISBLANK ( SalesCurrentMonth ) ) * ( NOT ISBLANK ( SalesPreviousMonth ) )
    )
RETURN
    Result

% Sales Diff PM =
DIVIDE (
    [Sales Diff PM],
    [Sales PM]
)
The main goal of this article is to describe how to write the Sales PM measure of this example. From a DAX standpoint, the previous row of the matrix is not a concept that can be directly expressed in a formula. In order to author a measure that can do so, we have to start with an assumption: each row displays a month, and the months are sorted according to their natural sort order (January, February, March, and so on). However, the previous month in the visualization is not necessarily the previous month in the calendar. In the example we are considering, the selection made on the slicer shows just a few months. We should redefine the concept of “previous month” as “previous month in the selection made outside of the matrix”. Now we can call upon a Power BI concept with a close enough representation in DAX: the ALLSELECTED modifier allows a CALCULATE function to retrieve the filter context defined outside of a visual, which in this case is the selection made on filters and other visuals on the same report page.
Knowing the current month of a cell in the visualization, the previous month is the maximum month number available in the filter context provided by ALLSELECTED excluding the current and following months. This evaluation is made by the PreviousYearMonth variable in the Sales PM measure. The PreviousYearMonth variable is used to filter the Year Month Number in the CALCULATE function that evaluates Sales Amount for the previous selected month:
Sales PM :=
VAR CurrentYearMonth = SELECTEDVALUE ( 'Date'[Year Month Number] )
VAR PreviousYearMonth =
    CALCULATE (
        MAX ( 'Date'[Year Month Number] ),
        ALLSELECTED ( 'Date' ),
        KEEPFILTERS ( 'Date'[Year Month Number] < CurrentYearMonth )
    )
VAR Result =
    CALCULATE (
        [Sales Amount],
        'Date'[Year Month Number] = PreviousYearMonth,
        REMOVEFILTERS ( 'Date' )
    )
RETURN
    Result
The technique shown in this article can be used whenever you need to retrieve a “previous item” displayed in a Power BI visualization where non-consecutive items are filtered and the requirement is to consider strictly the items that are selected and visible.
Returns all the rows in a table, or all the values in a column, ignoring any filters that might have been applied inside the query, but keeping filters that come from outside.
ALLSELECTED ( [<TableNameOrColumnName>] [, <ColumnName> [, <ColumnName> [, … ] ] ] )
Evaluates an expression in a context modified by filters.
CALCULATE ( <Expression> [, <Filter> [, <Filter> [, … ] ] ] )