Topic: Power BI
-
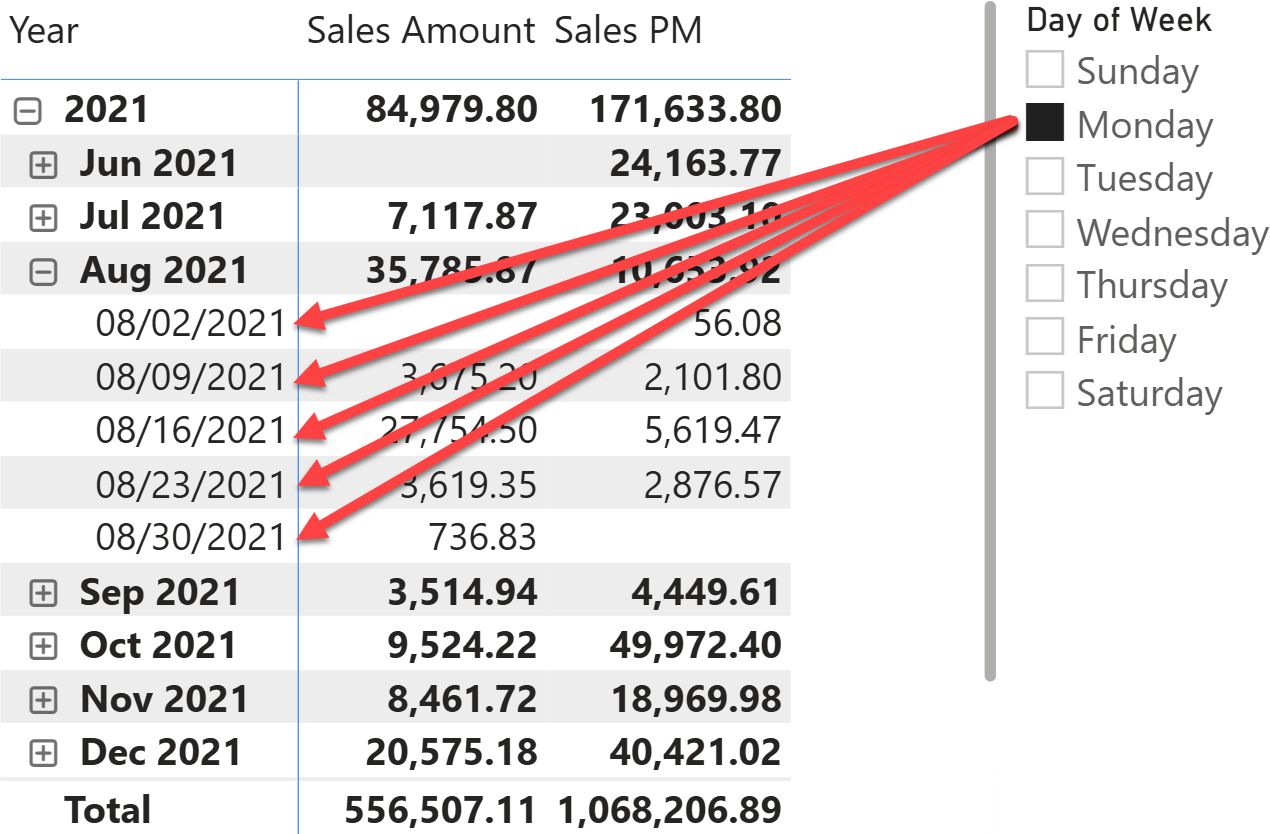
When using time intelligence functions, the automatic REMOVEFILTERS on Date can make maintaining filters on the Date table challenging. This article shows a technique to handle filter-preserving columns in DAX. Read more
-
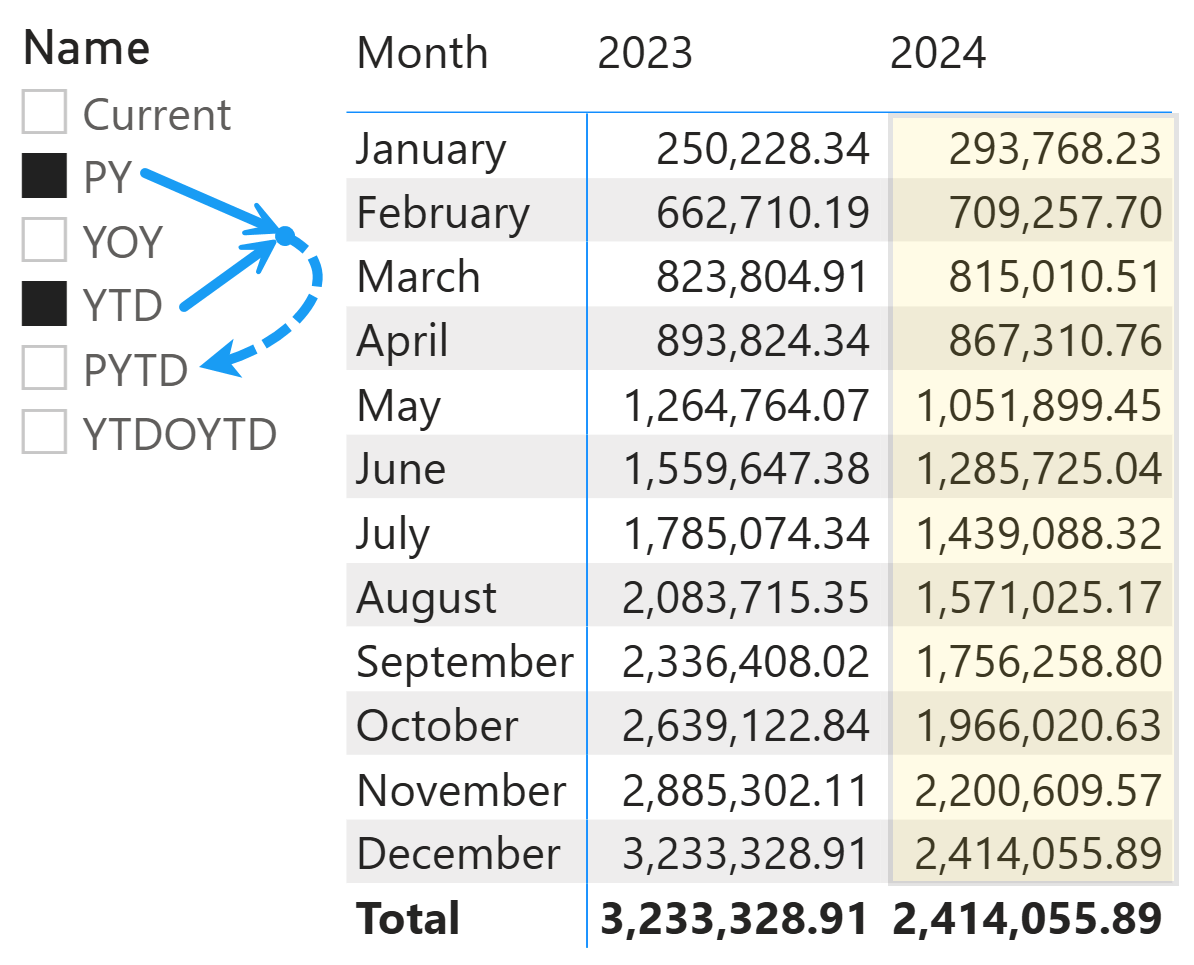
This article describes how to control the execution of DAX code when there are either multiple or empty selections of calculation items in calculation groups. Read more
-
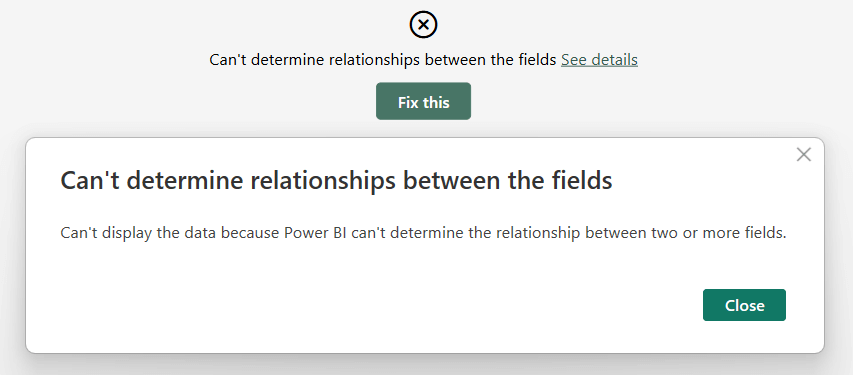
This article explains why you might encounter a curious error when placing columns from unrelated tables in a Power BI matrix. Read more
-
Direct Lake + Import composite mode explained—architecture, performance tests, and where it outperforms pure Import or Direct Lake. Re‑recorded after my Fabric Conf 2025 session (the original wasn’t recorded), this walkthrough offers a critical take without the usual marketing pitch, so you can decide which storage… Watch now
-
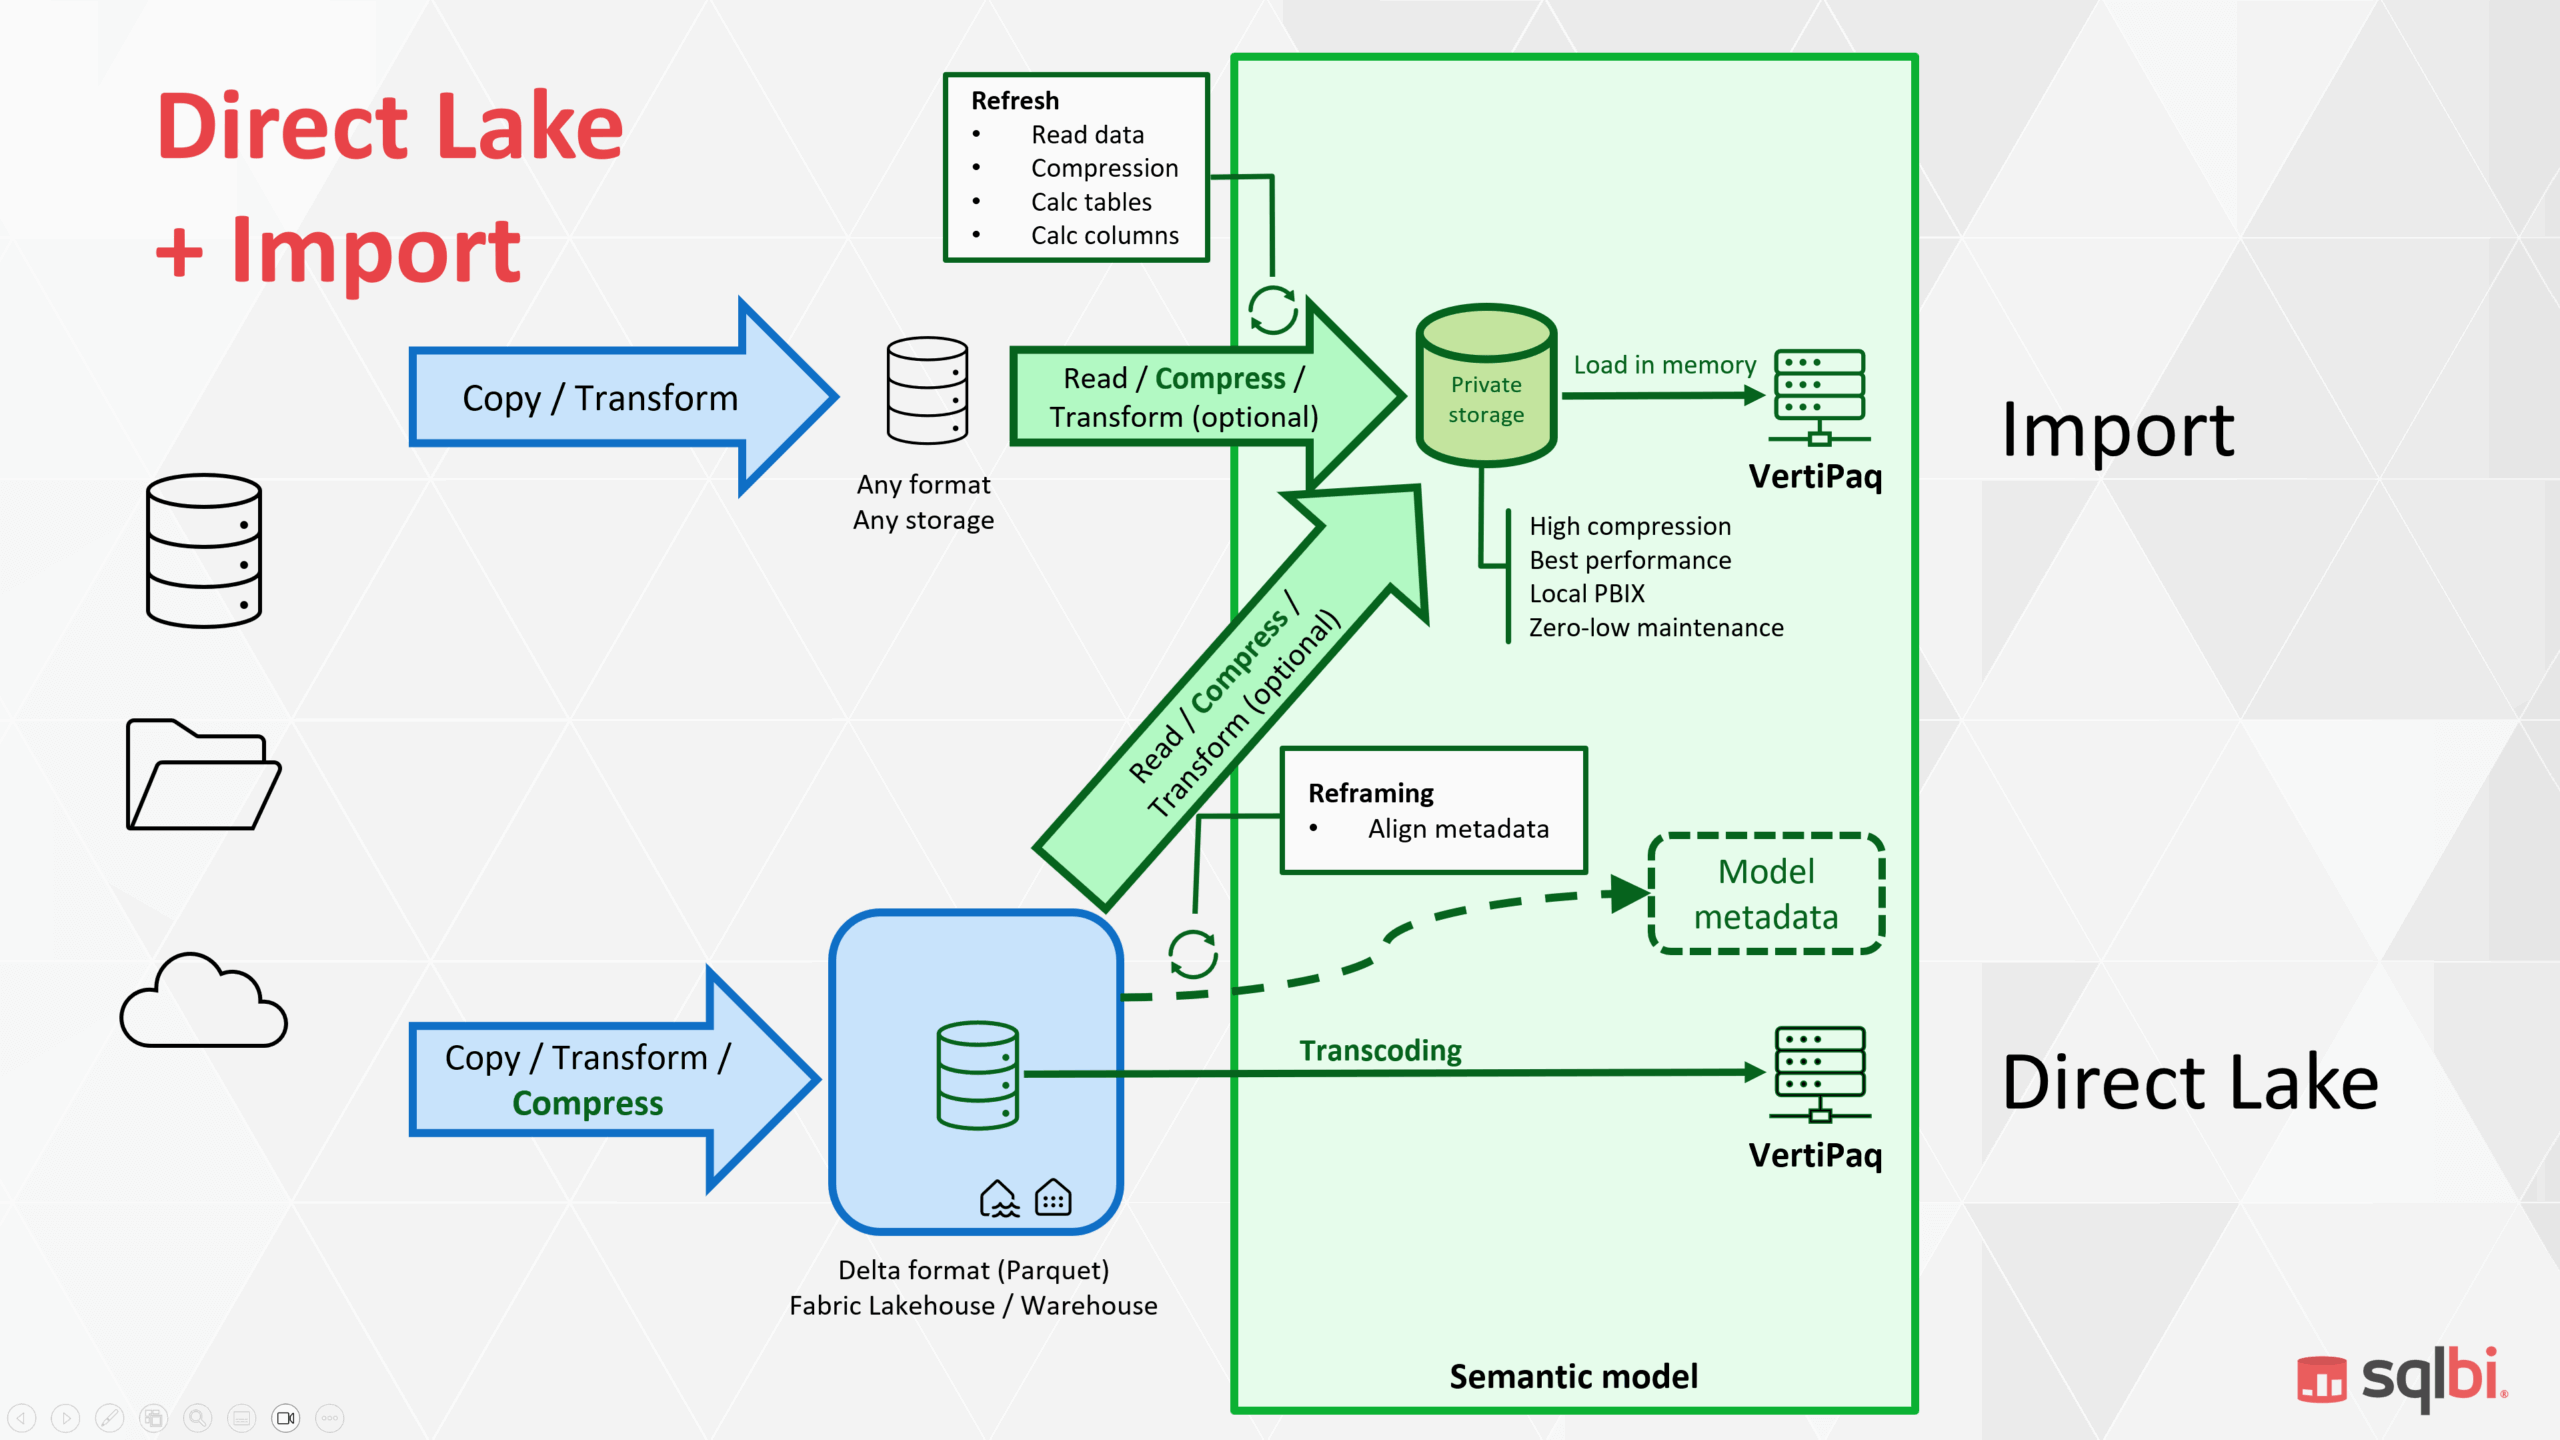
When I presented “Choosing Between Import Mode, Direct Lake, and Composite Models” at Fabric Conf 2025 in Las Vegas, the room overflowed, and the session was not recorded. I promised to publish the material once the new Direct Lake + Import composite model… Read more
-
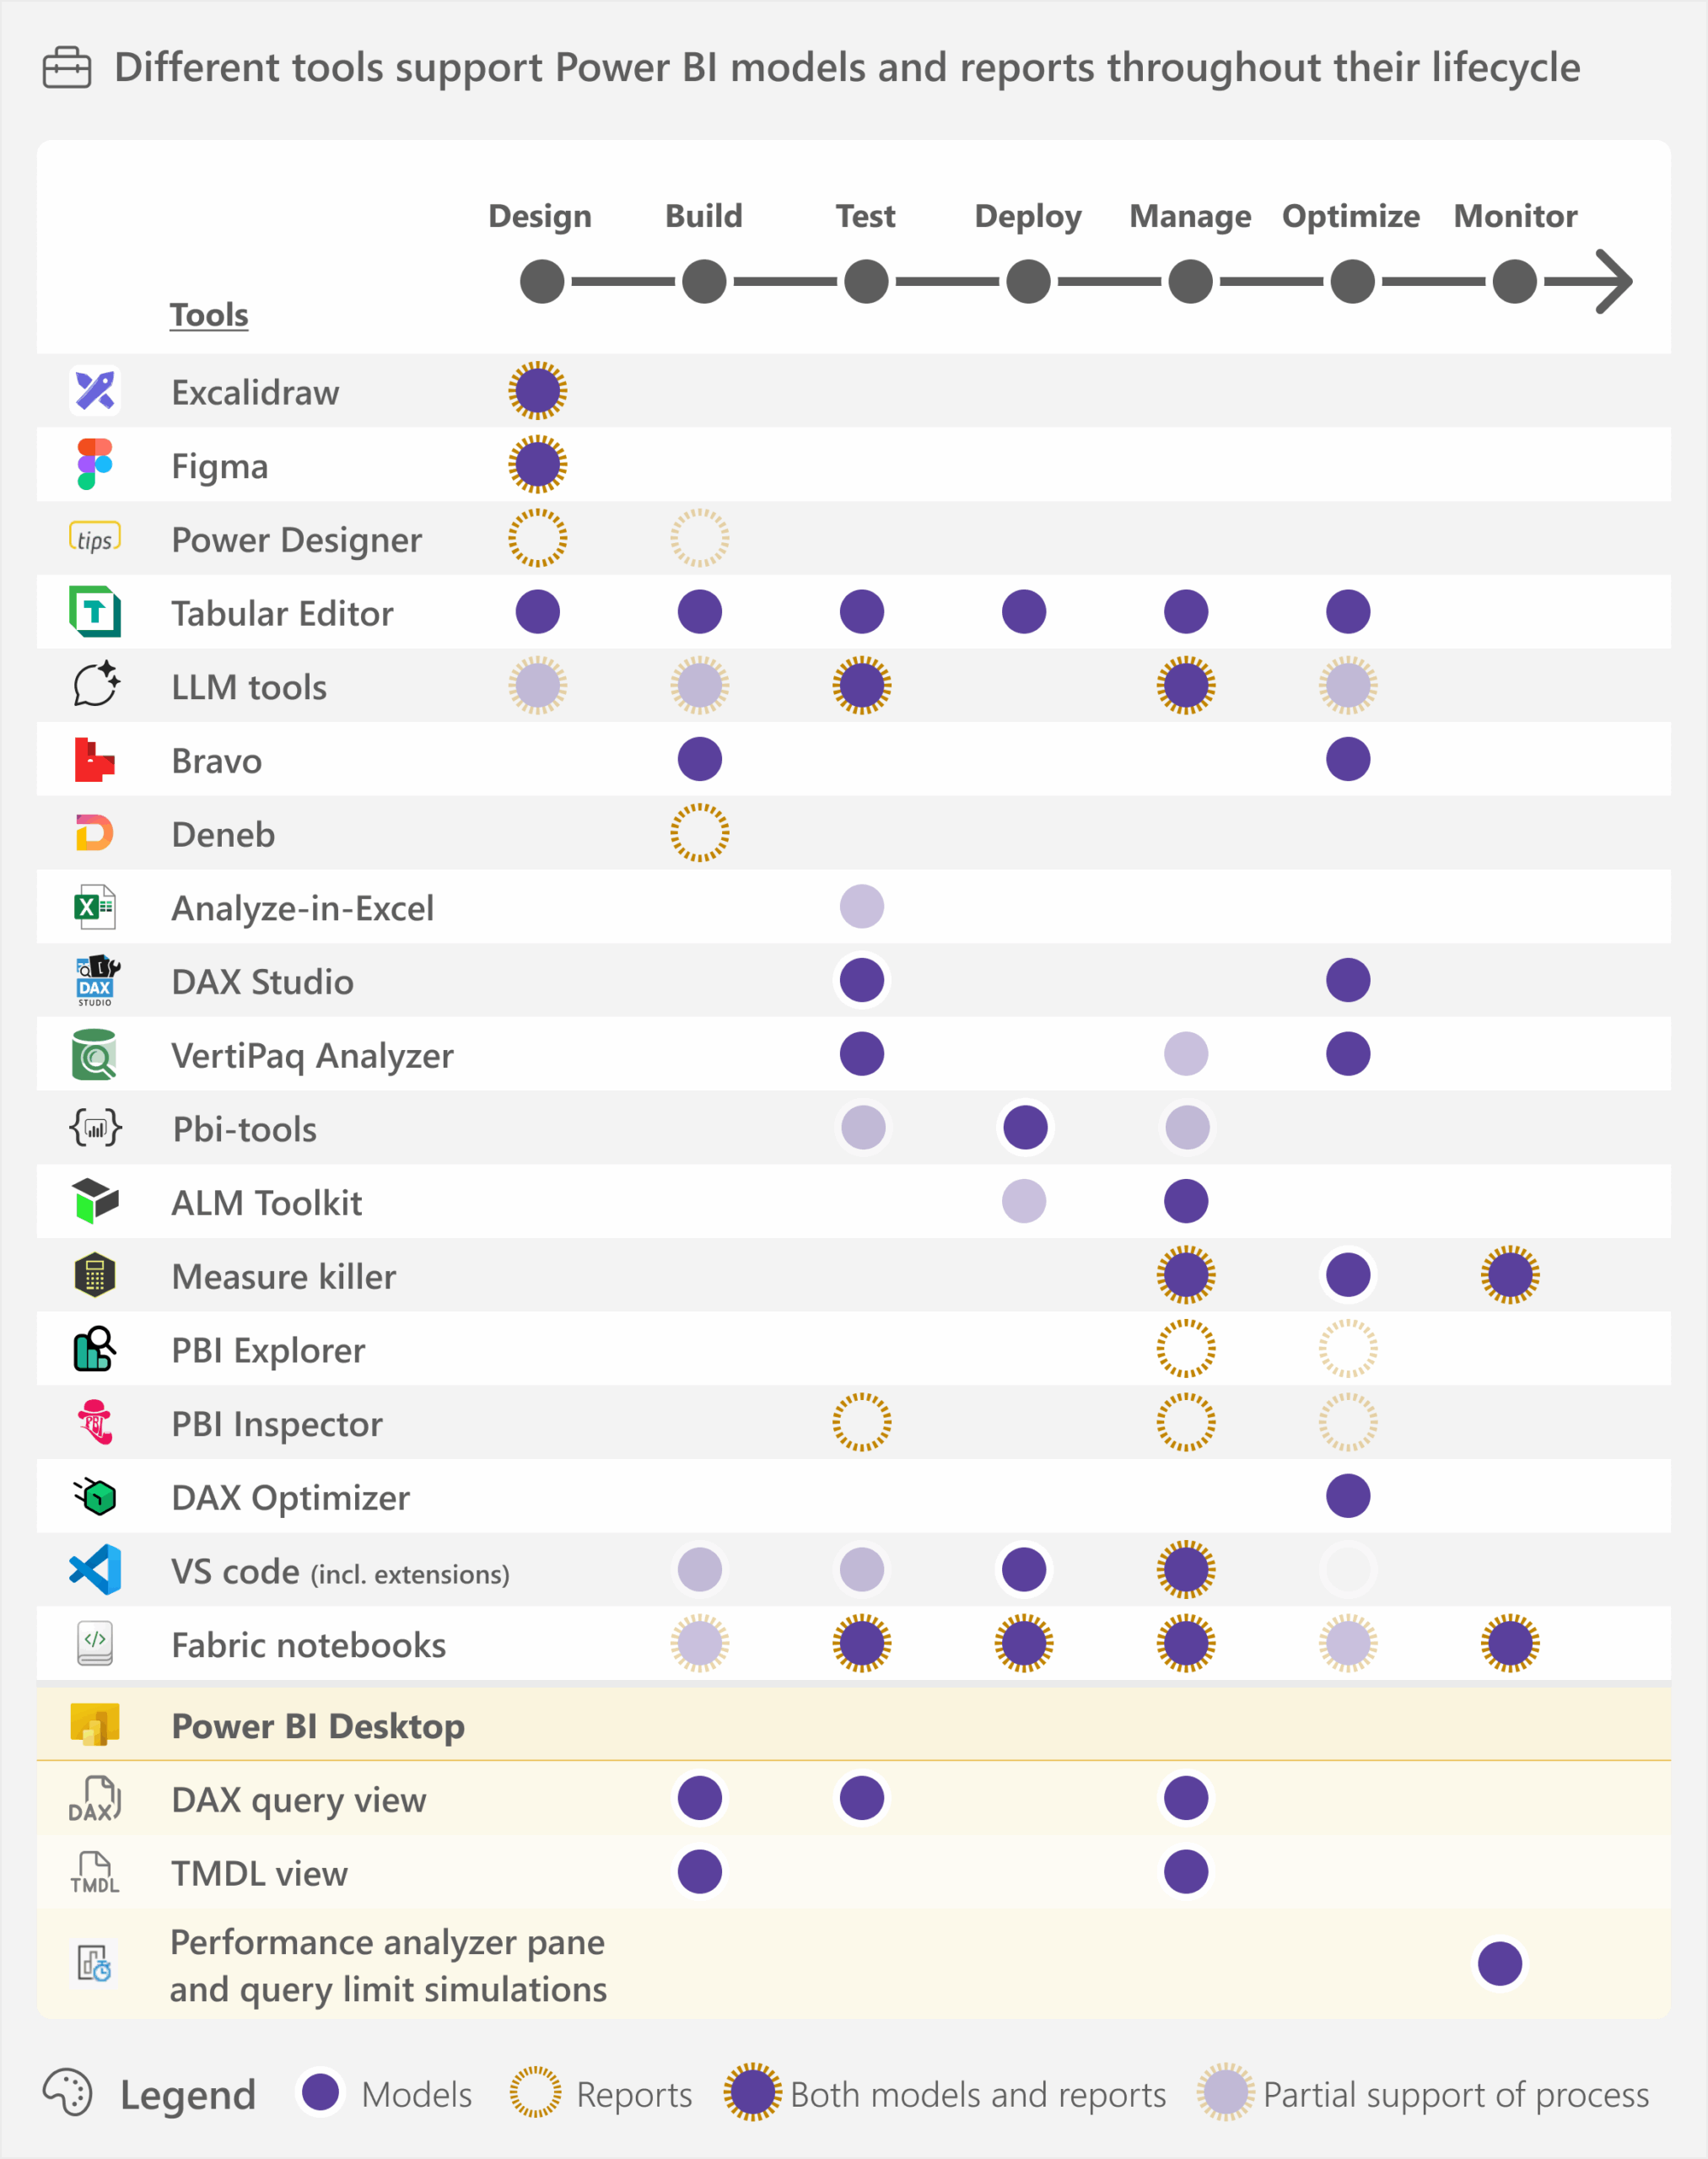
This article gives an overview of some of the available tools that can help you create semantic models and reports. Read more
-

We released a new course for our SQLBI+ subscribers: Security in Tabular Semantic Models. This course explains how to implement security in Tabular semantic models, considering different requirements, data model design, DAX implementation, and performance. The training is reference material… Read more
-
How to implement security in Tabular semantic models considering different requirements, data model design, DAX implementation, and performance. Read more
-
Learn how to write DAX queries and how to manipulate tables in DAX measures and calculated columns. Read more
-
Learn the internals of Power BI semantic models created by using VertiPaq, DirectQuery over SQL, and DirectQuery for Power BI datasets and Analysis Services. Read more
