Topic: Power BI
-
This video explains how to navigate the lattice of visual calculations in DAX. The visual context goes beyond the row context and filter context by adding the concept of levels within the lattice. The video shows how to use COLLAPSEALL… Watch now
-
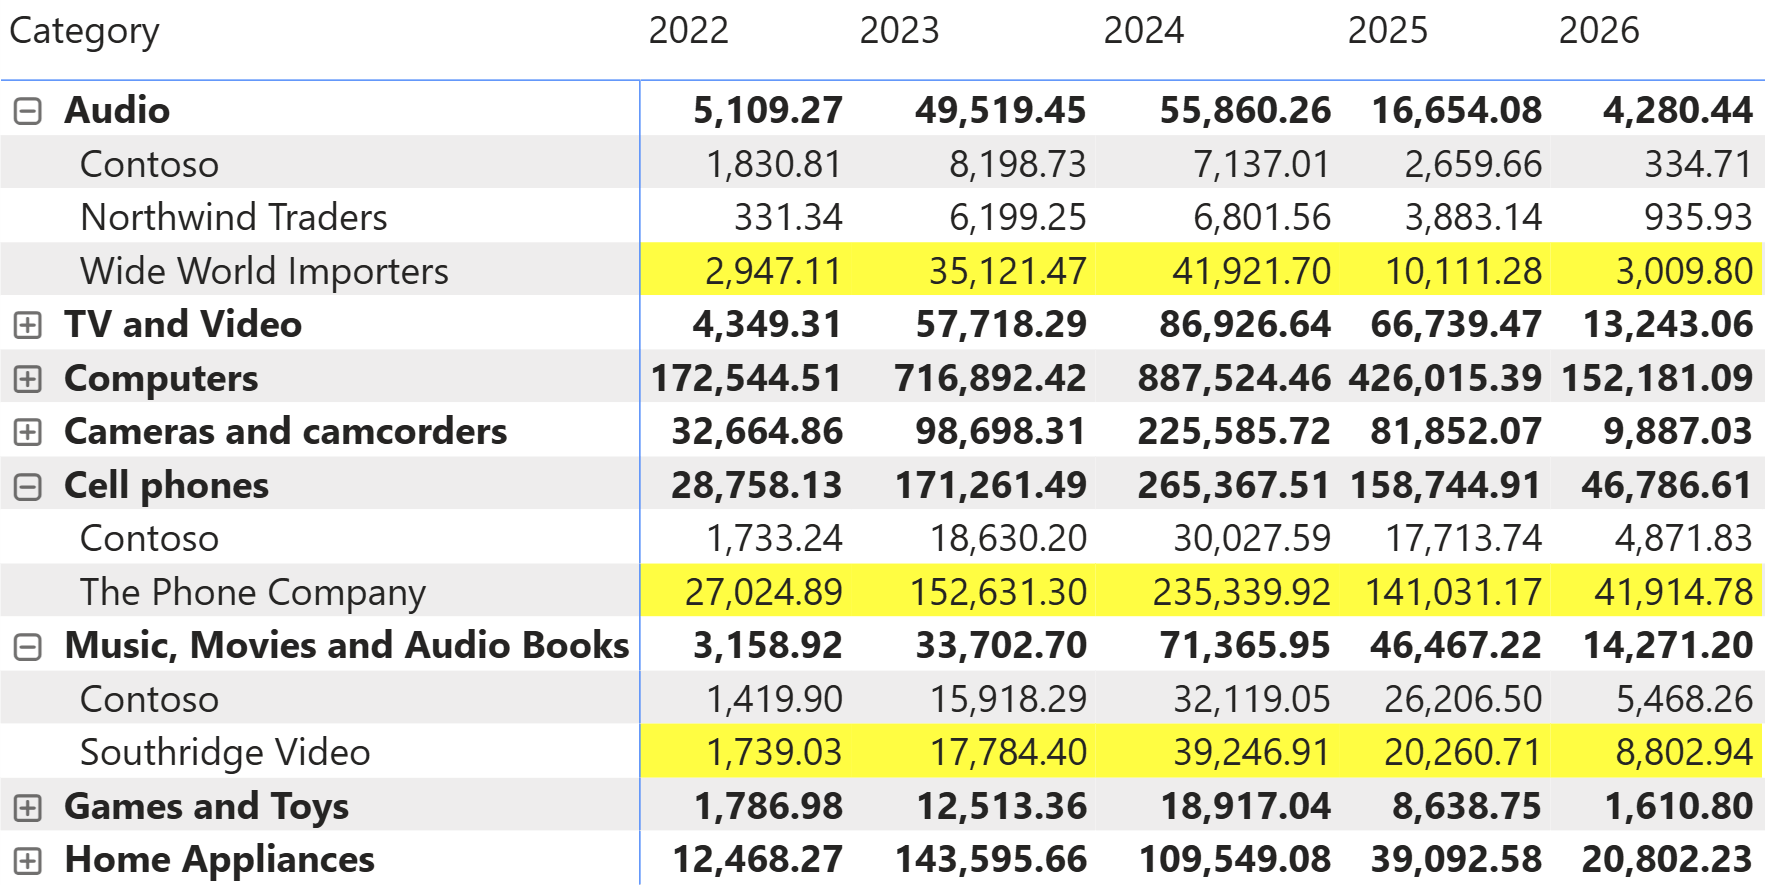
Visual calculations can be used efficiently to format visuals. This article presents an interesting technique to highlight a row based solely on the maximum value in the last column. Read more
-
Visual calculations are a new feature in DAX that aims to simplify the use of DAX for users by introducing calculations at the visual level rather than at the model level. Read more
-
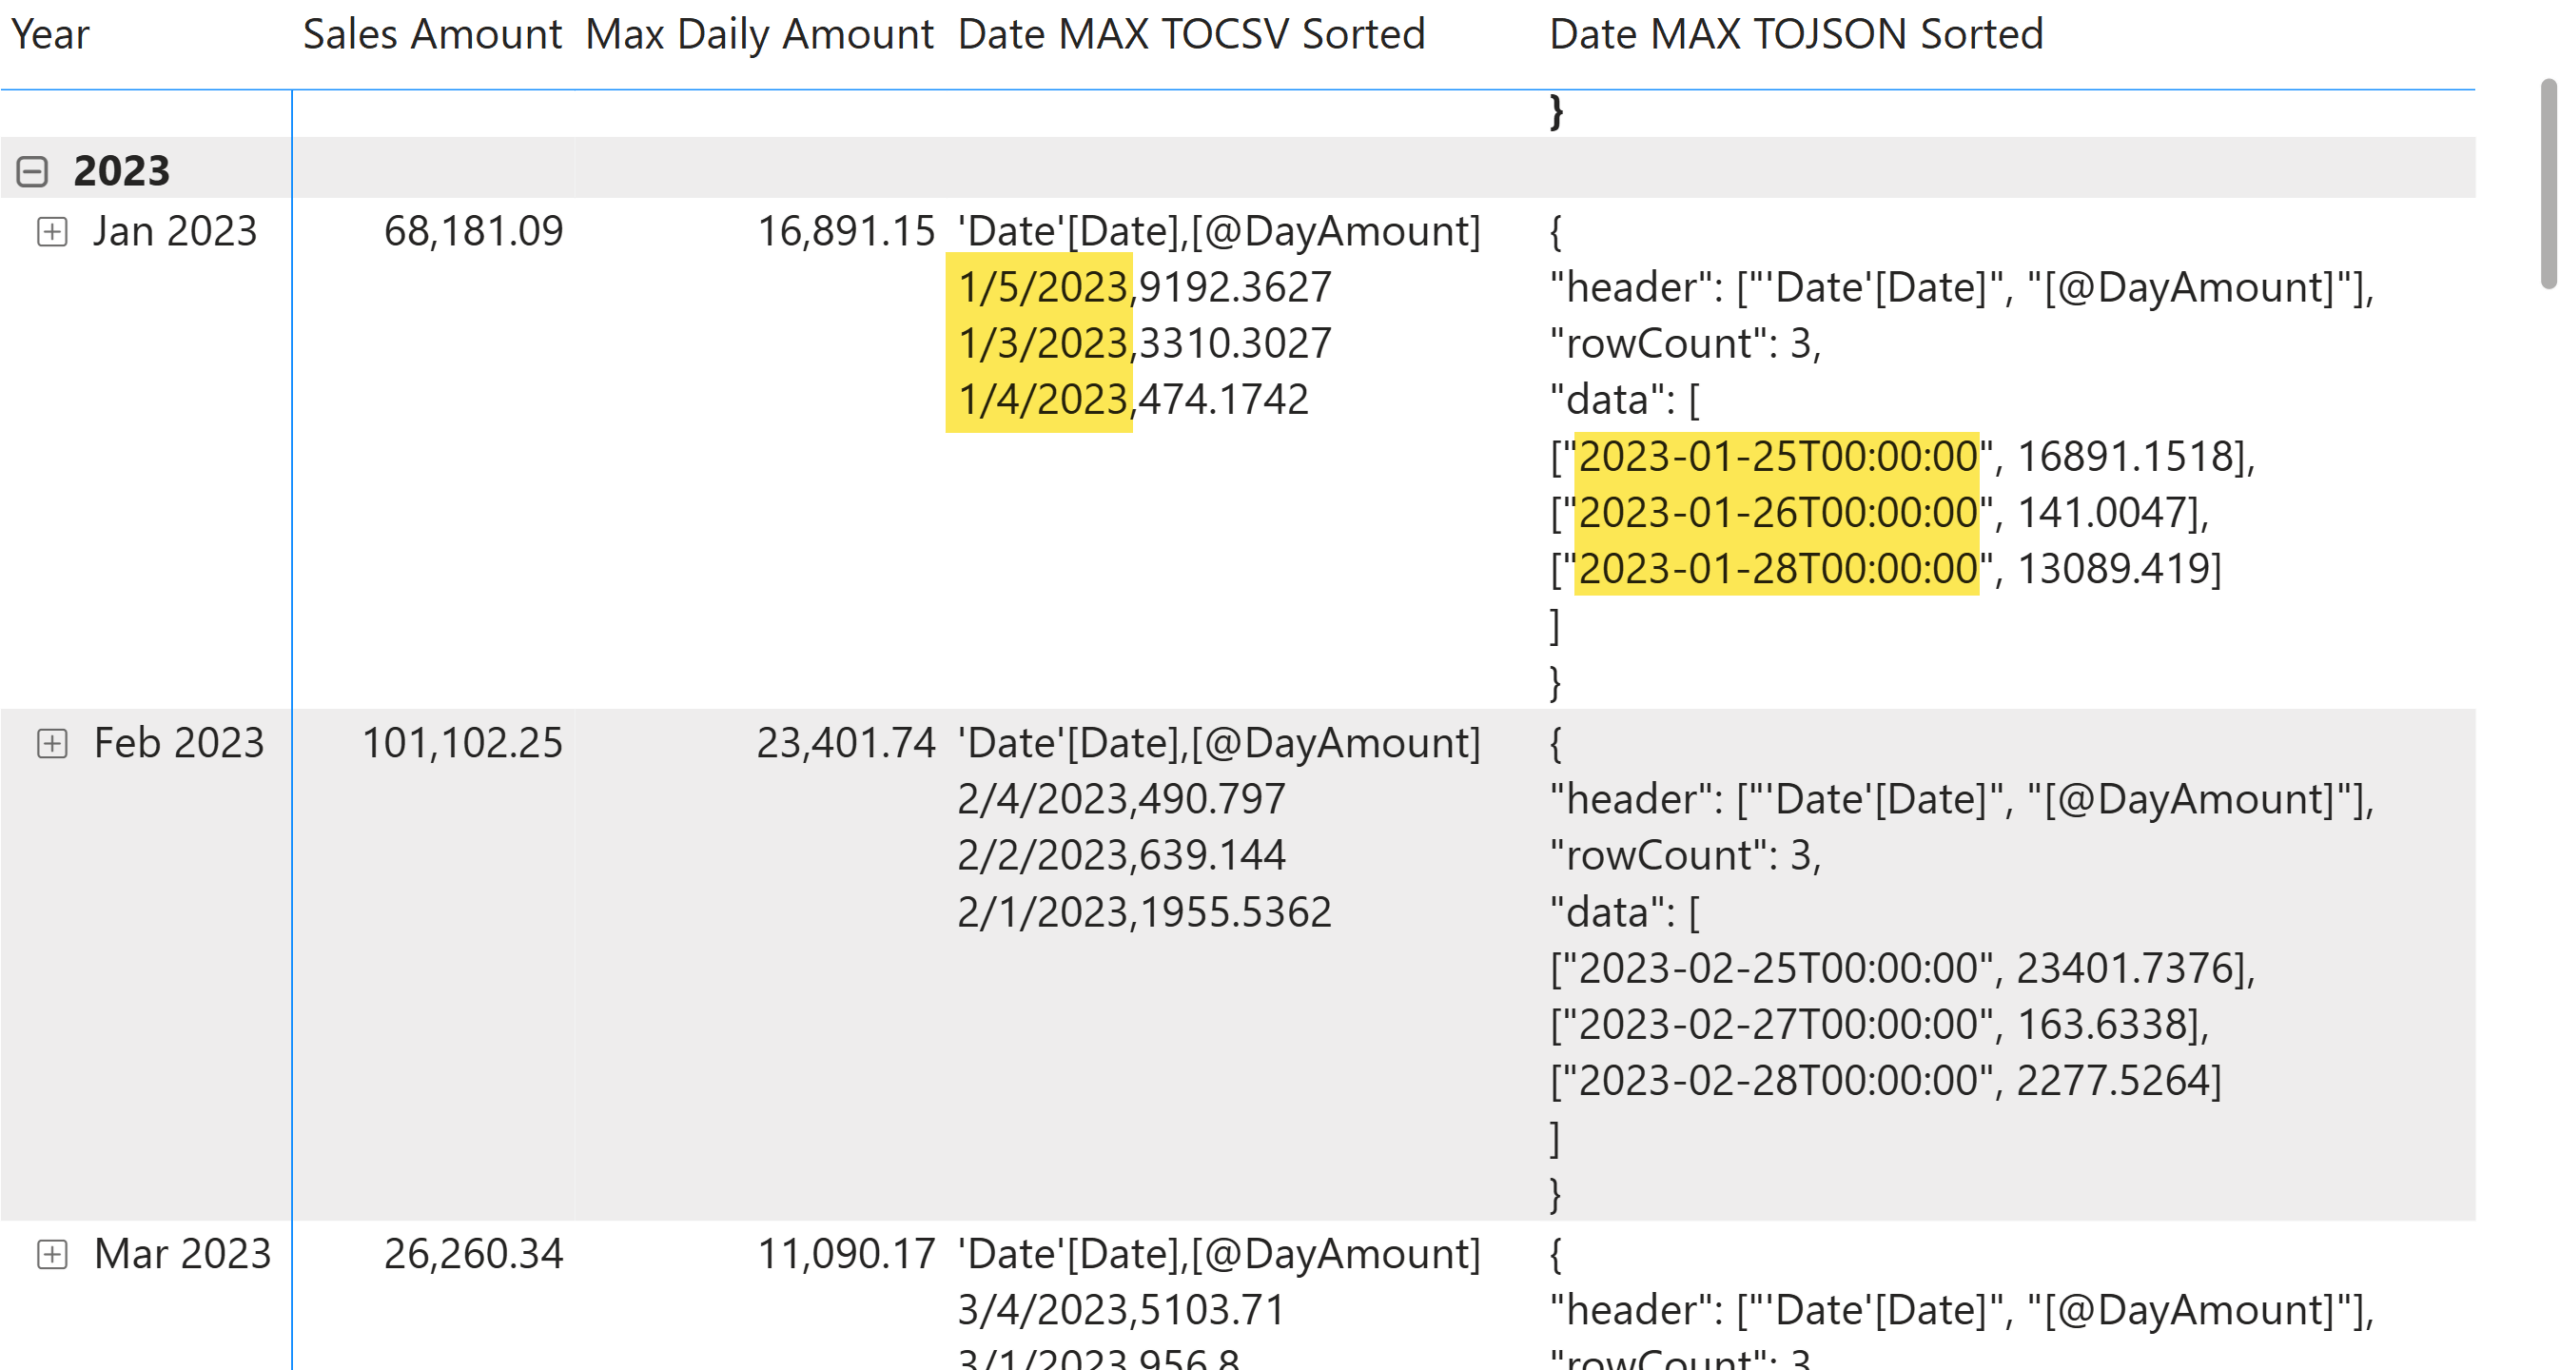
This article describes how to use the TOJSON and TOCSV functions to inspect the content of intermediate table variables when debugging a DAX measure. Read more
-
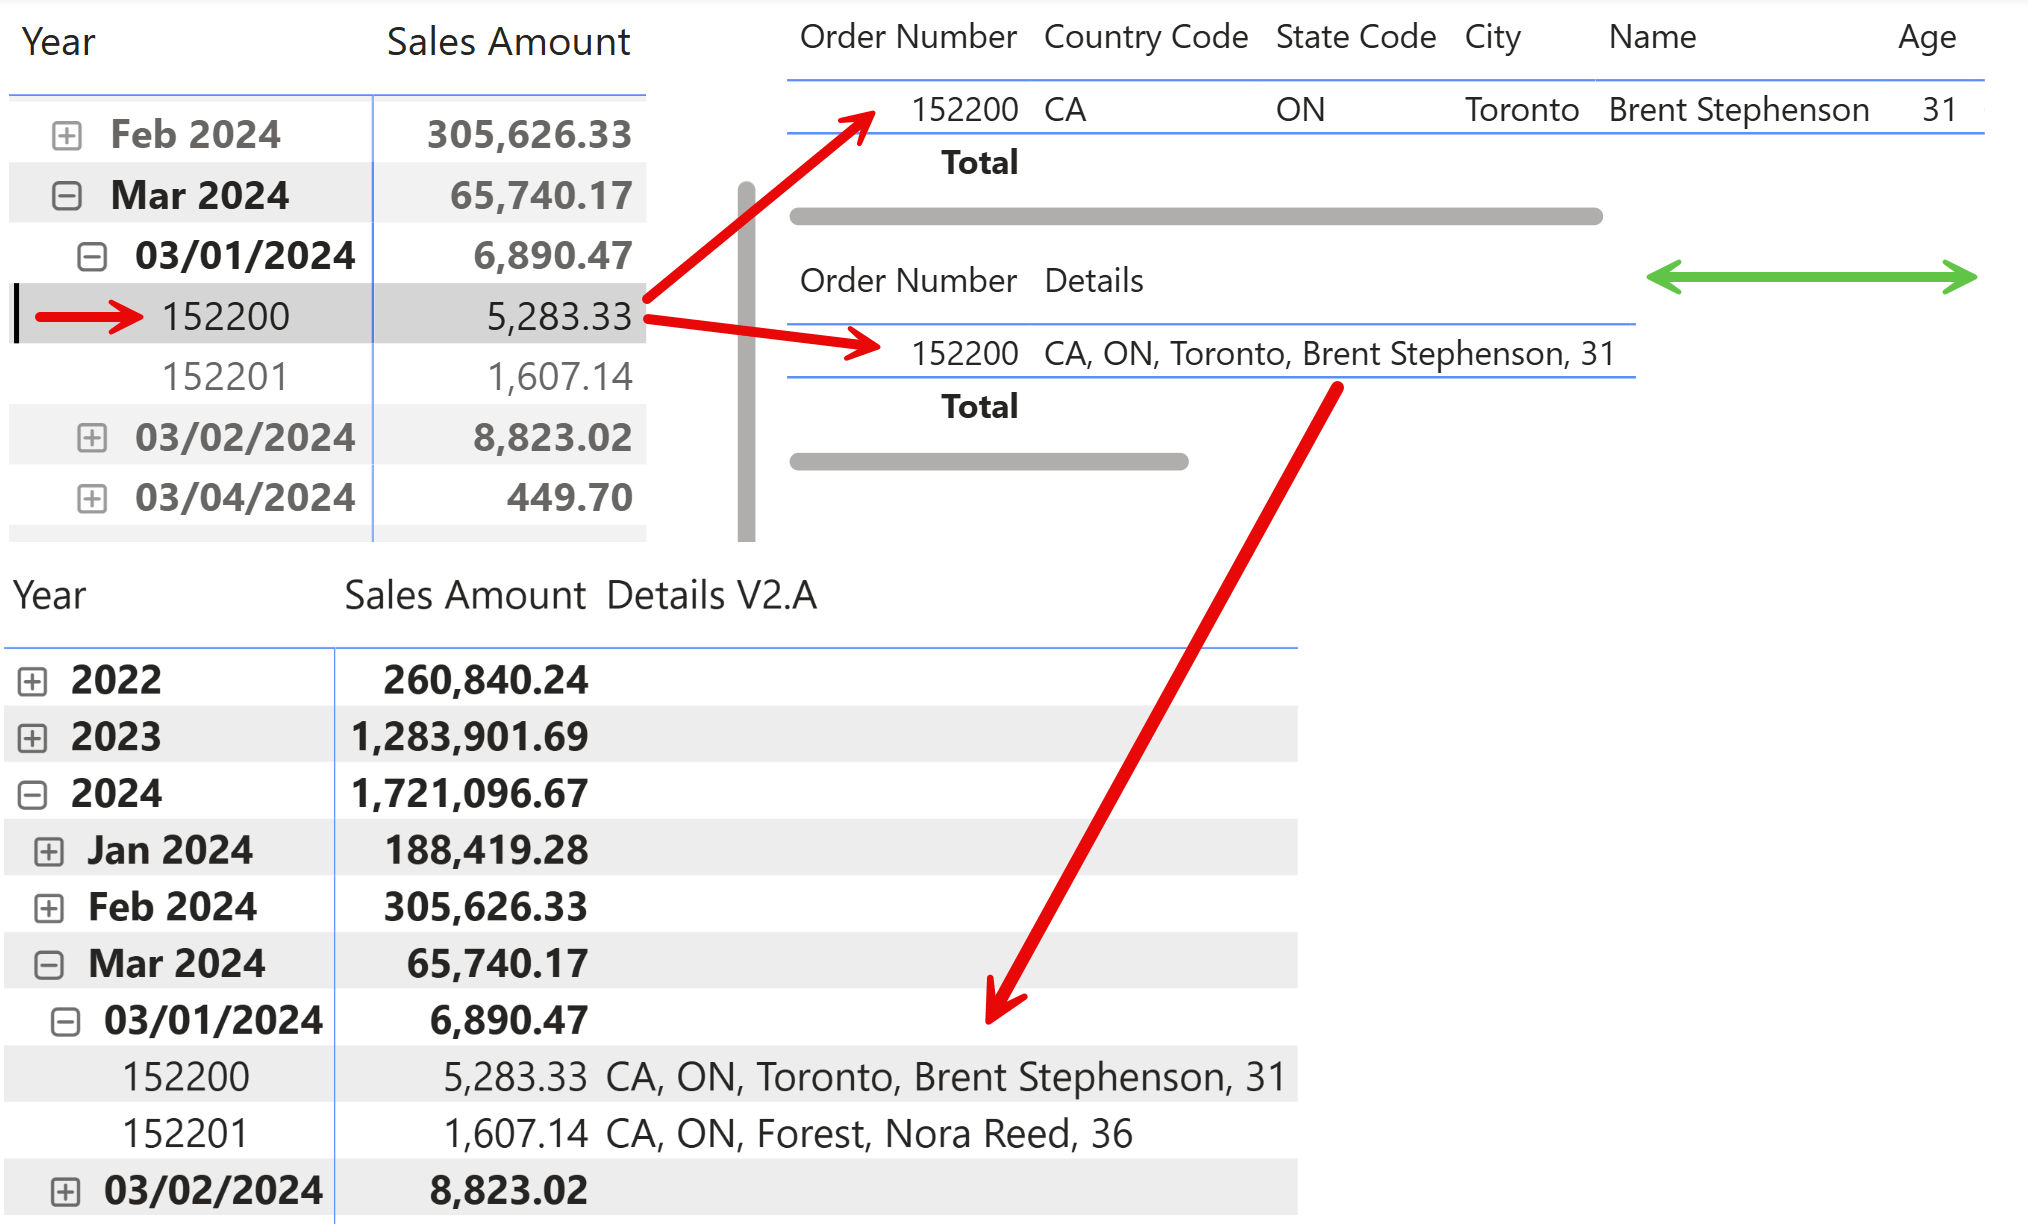
This article shows how to create a DAX measure that displays information from multiple columns in a business entity or transaction, into a single column of a matrix. Read more
-
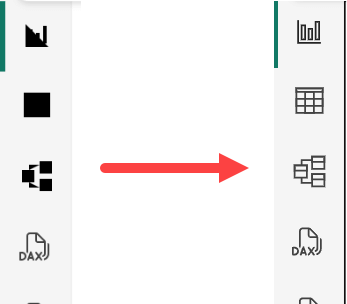
In mid-January 2026, many Power BI Desktop users began noticing a strange visual regression: several icons in the interface—including the Data, Model, and DAX icons—appeared as solid black shapes instead of their normal outlines. The issue appeared suddenly, even on… Read more
-
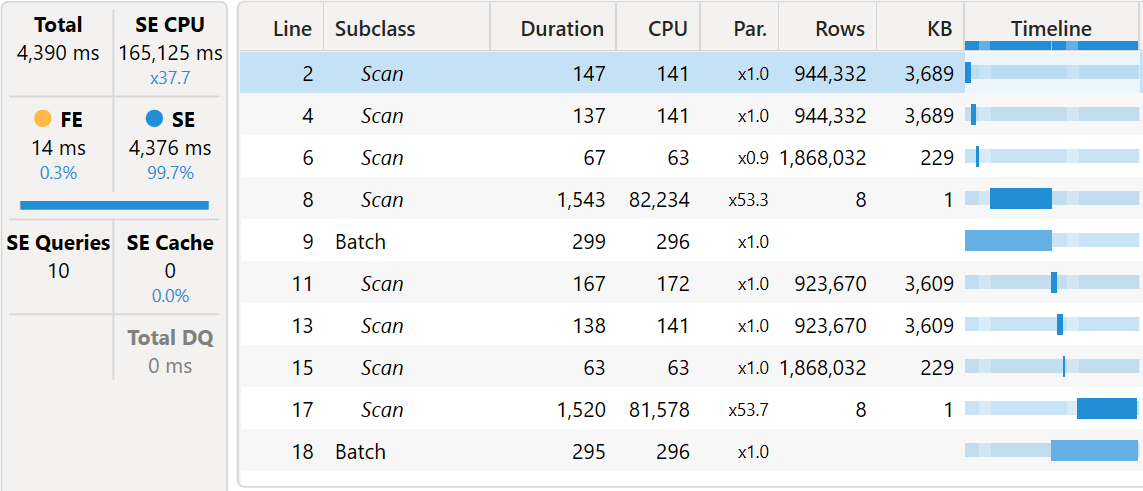
This article analyzes the performance of regular versus limited relationships in DAX to understand the implications of using limited relationships. Read more
-
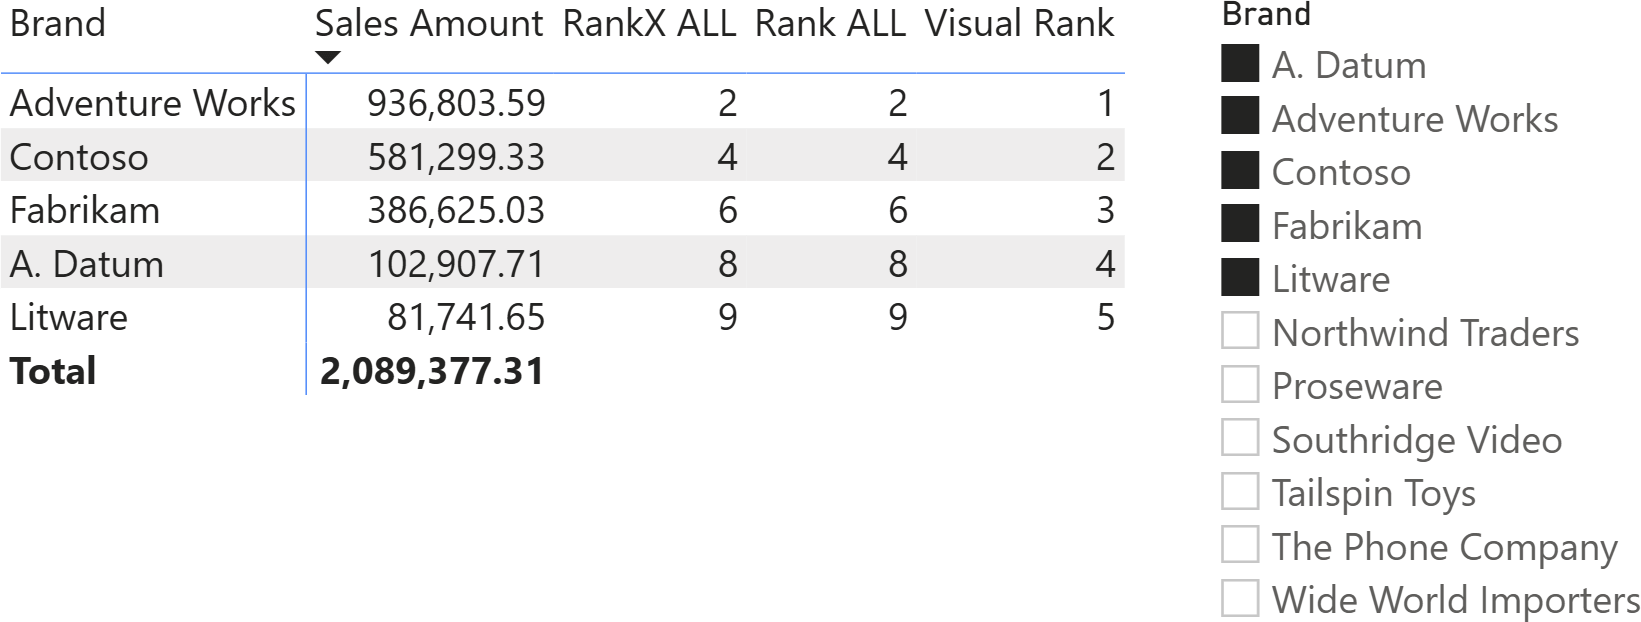
Should you use RANK or stick with RANKX? In which scenarios is one better than the other? This article provides an in-depth analysis to help readers make informed choices. Read more
-
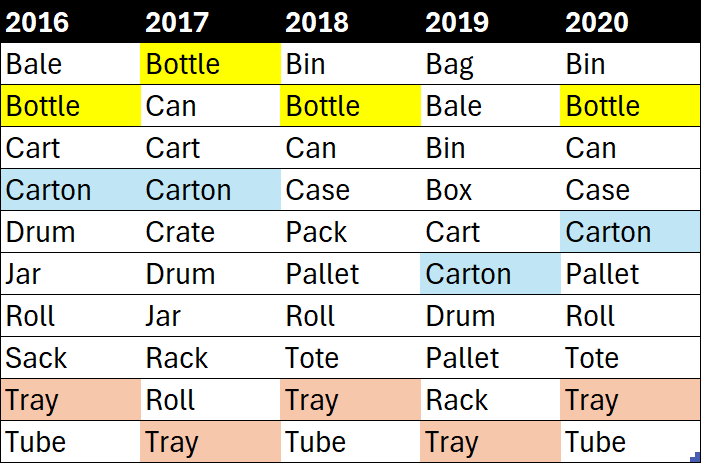
This article outlines the process of creating a measure to identify the top 10 products by sales each year. Read more
-
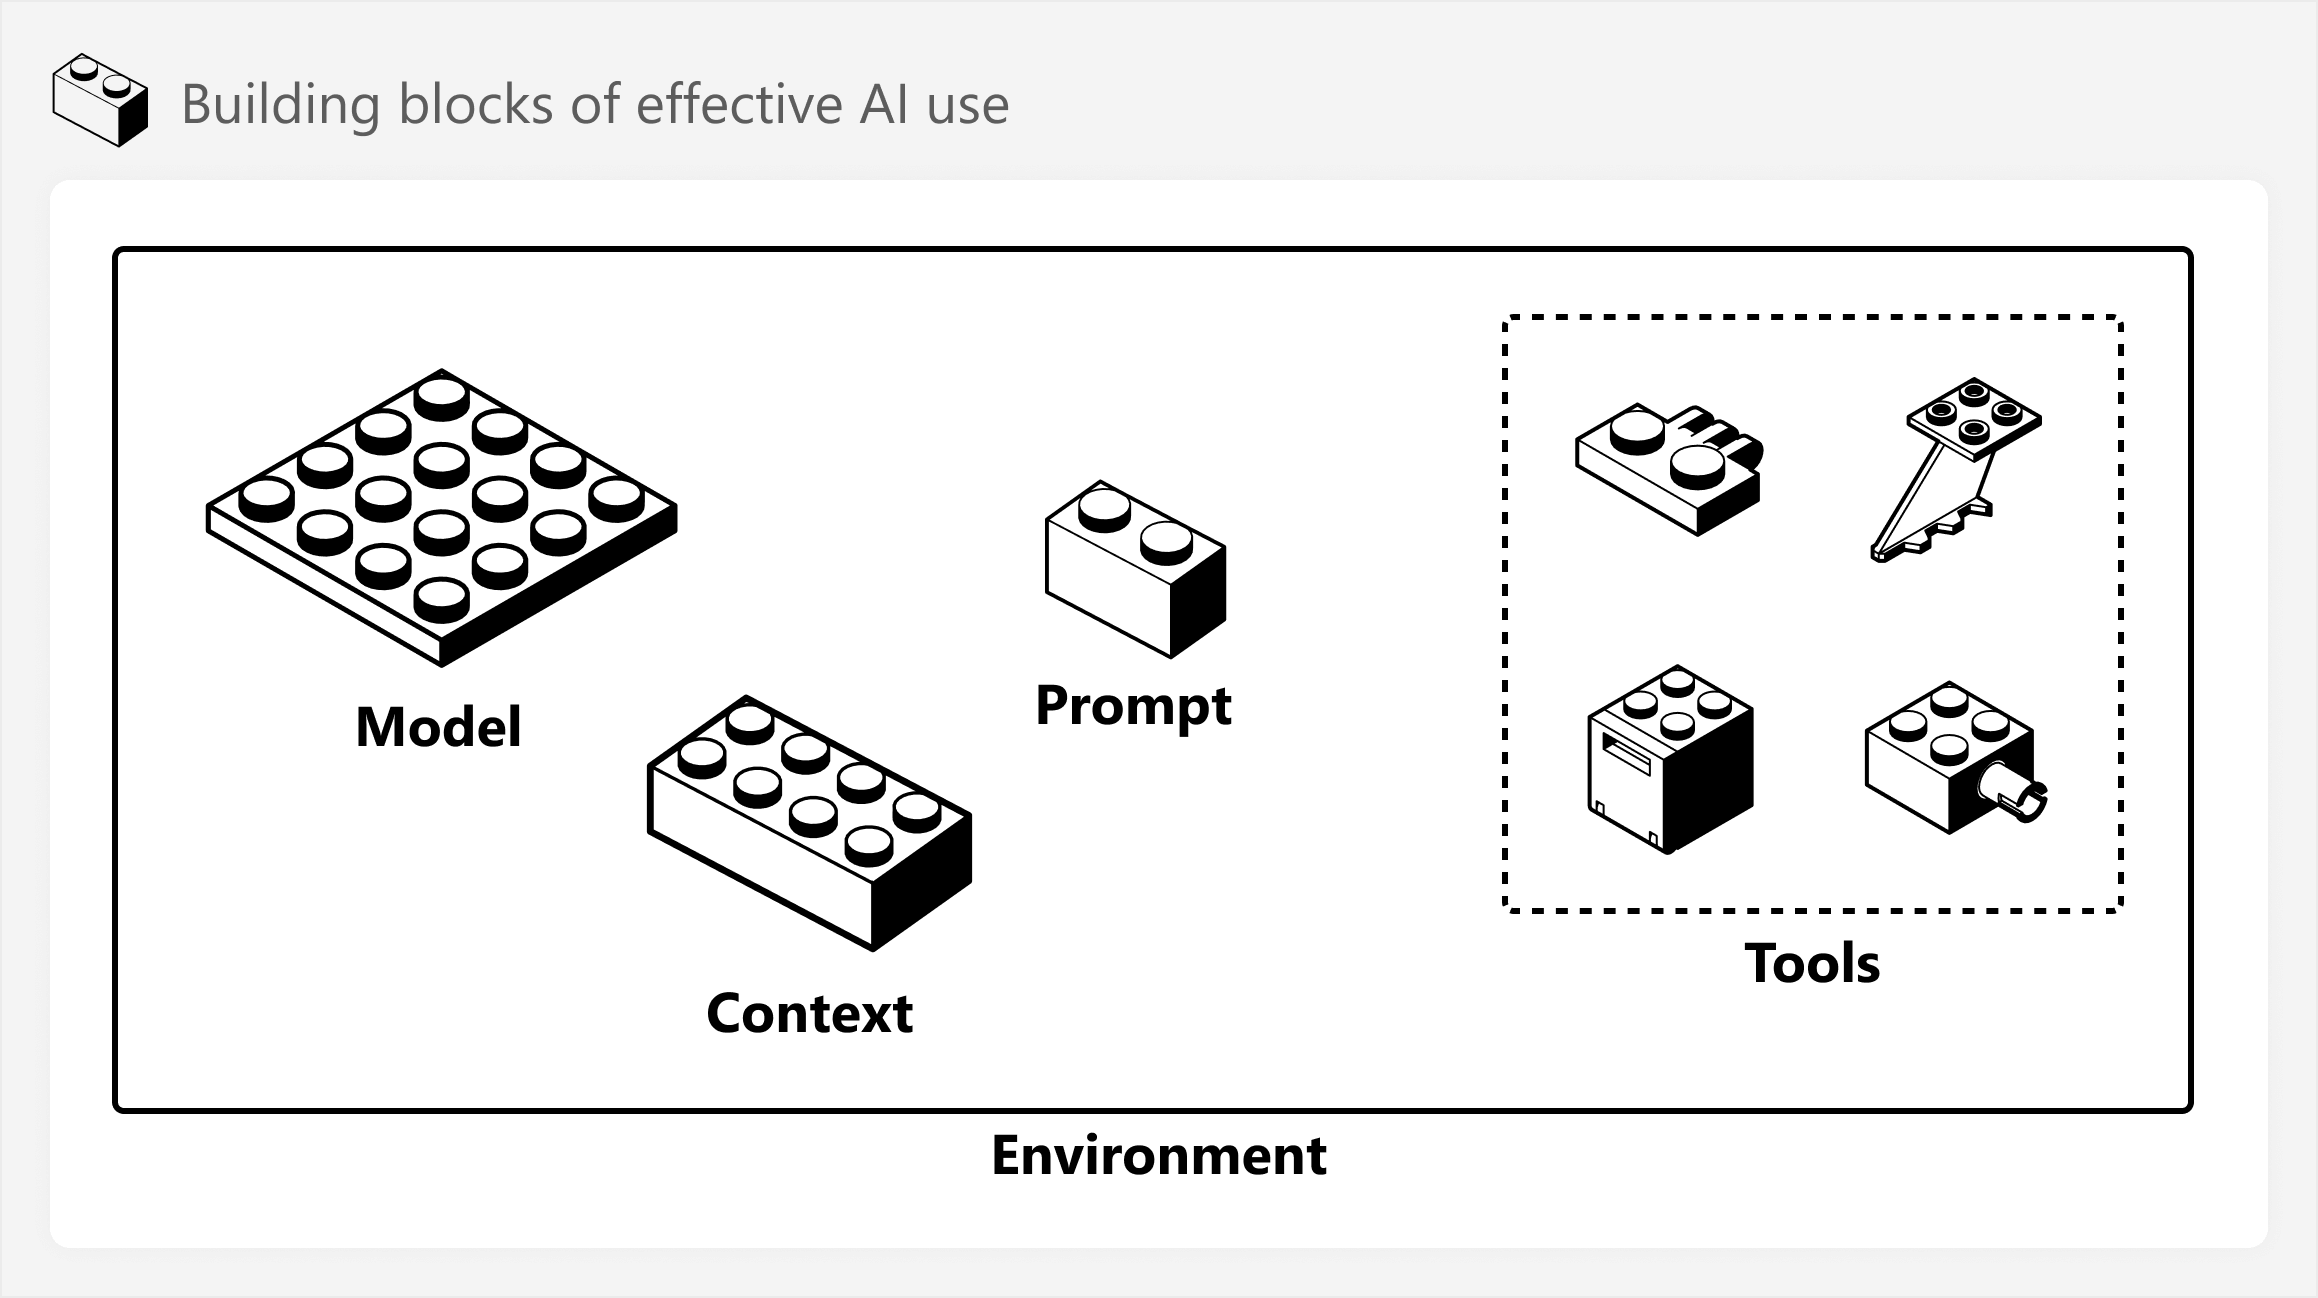
This article is about useful concepts and scenarios for integrating AI and AI agents in BI development, with specific examples for Power BI. Read more