-
If you think that the end of the year would have been a quiet time because the Power BI team will skip their monthly release (but are we sure?), you might be reassured (or disappointed depending on your perspective) looking at the news I have in this Read more
-
The 2015 has been an amazing year for Power BI. One year ago, I was commenting on this blog the public preview of Power BI dashboards. A few days ago, Microsoft released the December update of Power BI Desktop and several updates of the Power BI service. Read more
-
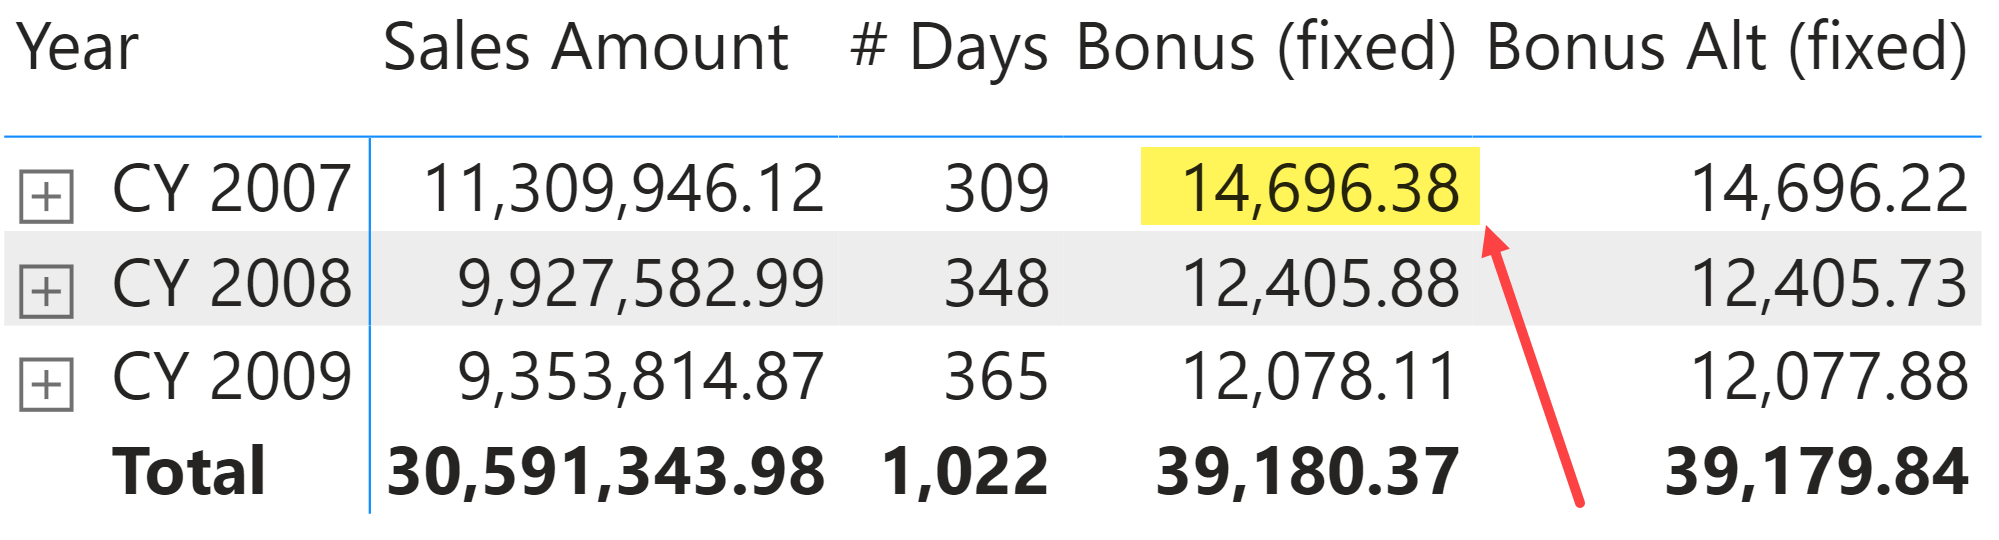
It is not common to face rounding differences in Power BI. However, when it happens, users are usually disappointed and surprised. Read more
-
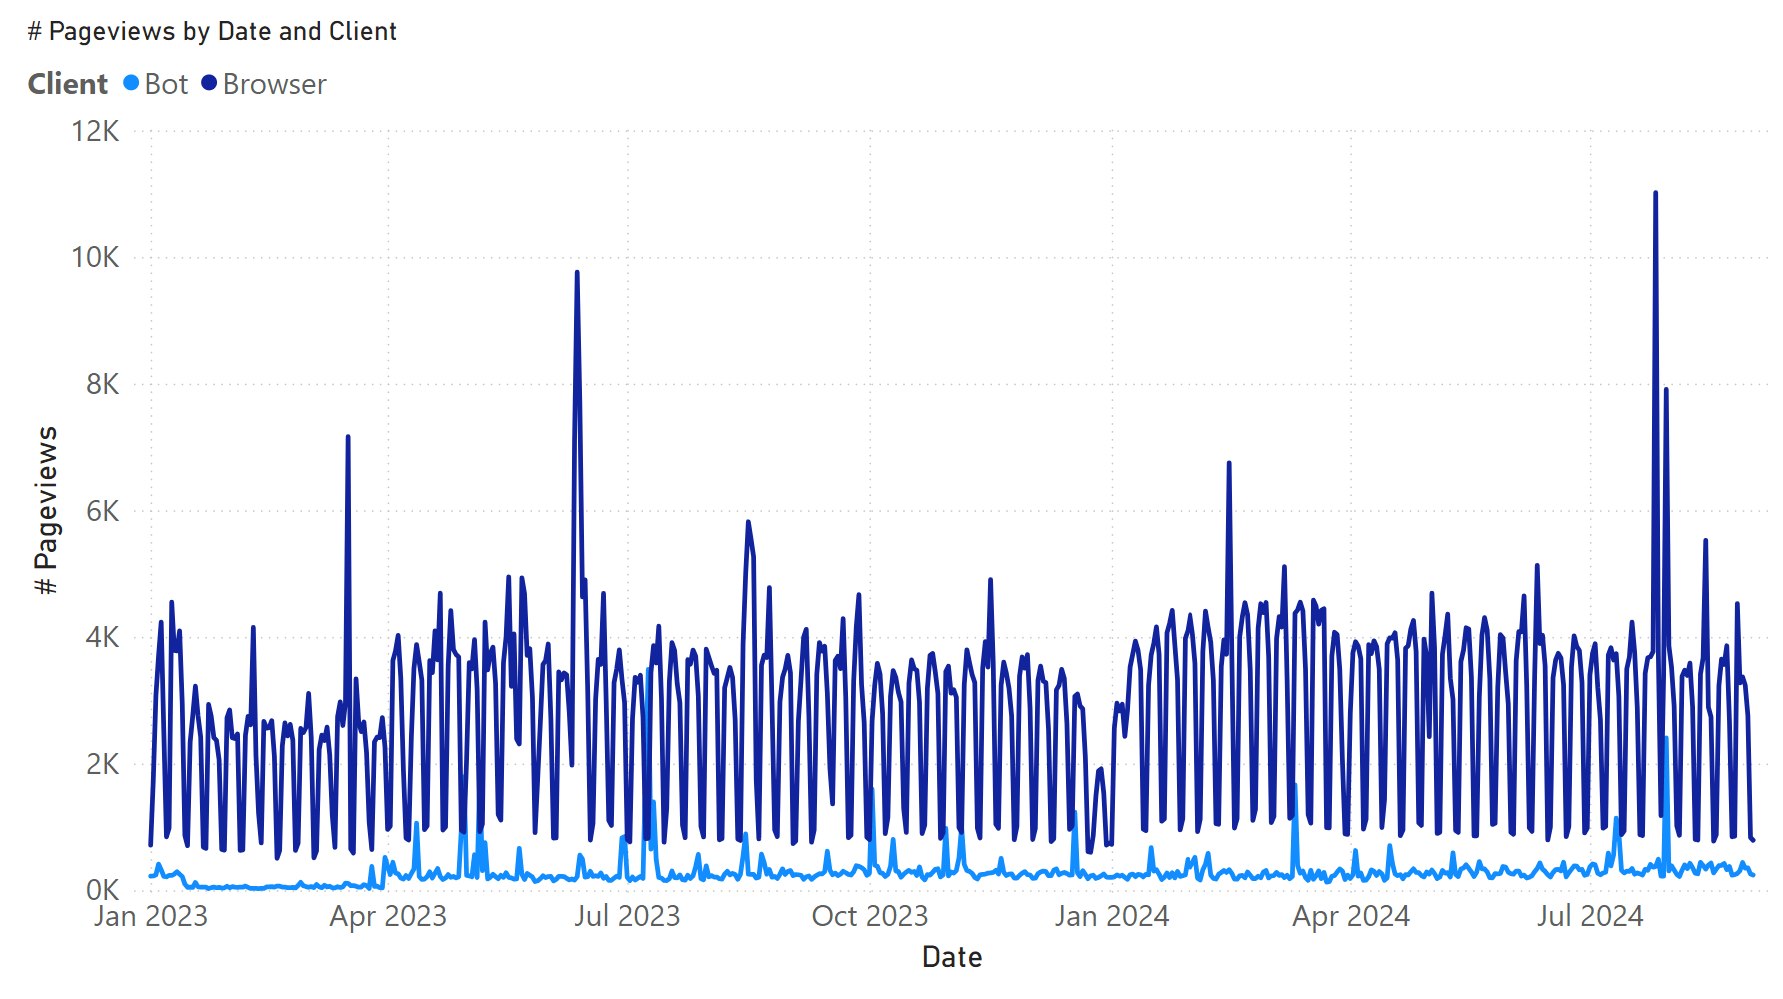
This article describes why week-based calendars (like 4-4-5) are important for specific industries and how to use them effectively in Power BI. Read more
-

SQLBI+ is our new subscription service for advanced content that supports professional model authors who create semantic models for Power BI and Analysis Services. Read more
-
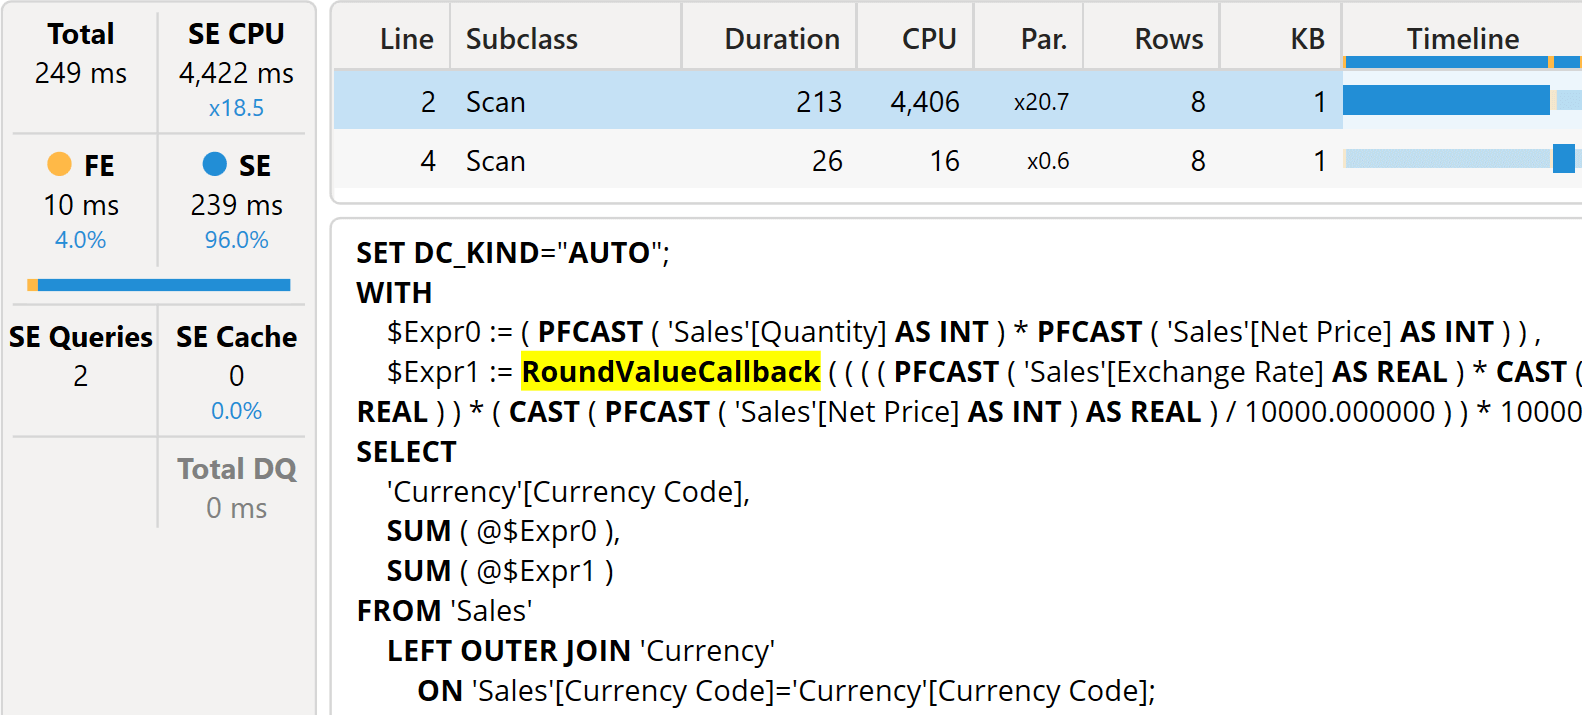
The choice of data types can affect precision and performance because of internal conversions. This article shows how the right choice of data type and DAX code makes a significant difference. Read more
-
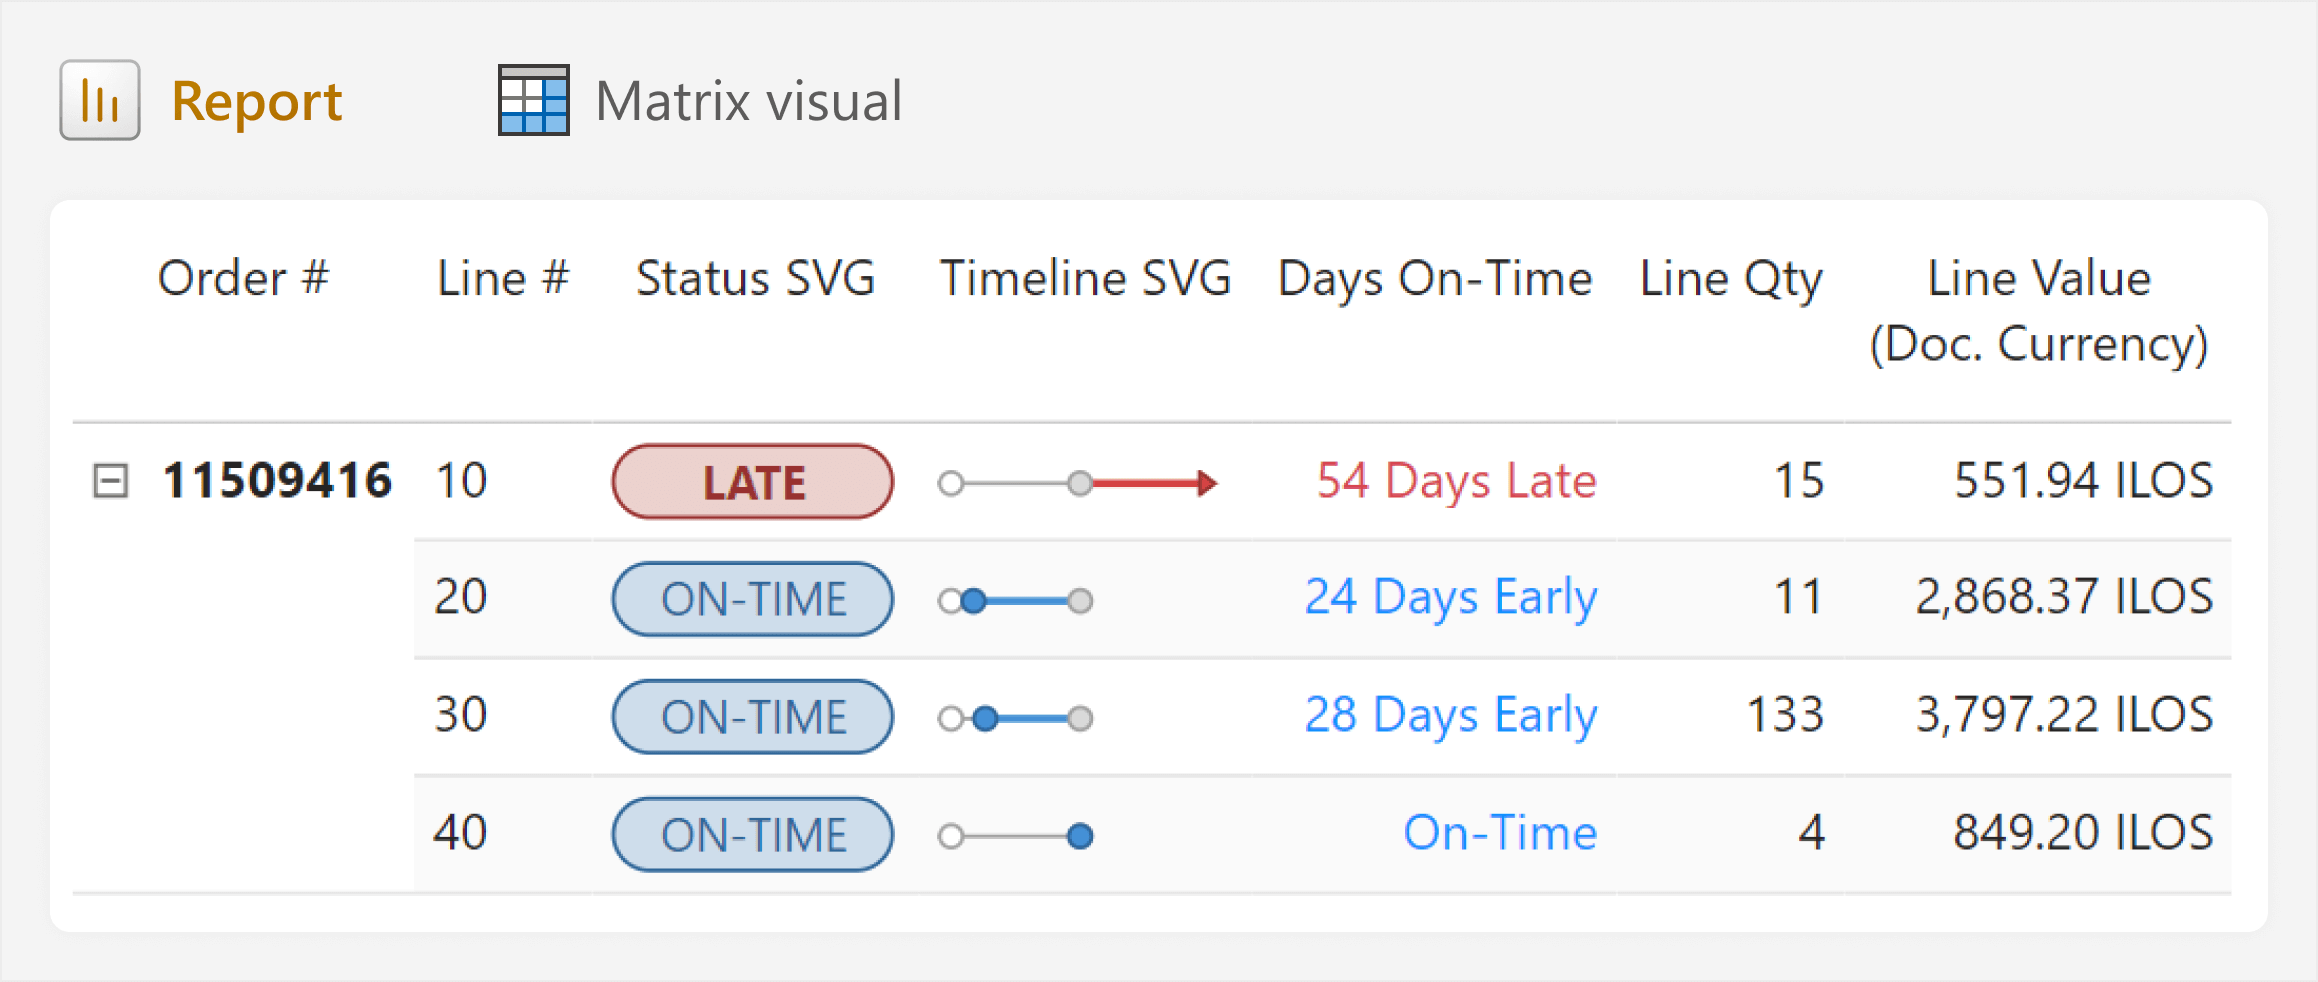
This article is about creating dynamic images in DAX measures to visualize data in tables or cards, including an easy way to do this in Figma, and a caution for using these DAX measures in real-life scenarios. Read more
-

This article describes the DAX context transition using a conceptual model based on a visual representation. Read more
-

One of the few golden rules in DAX is to always filter columns and never filter tables with CALCULATE. This article explains the rationale behind the rule. Read more
-
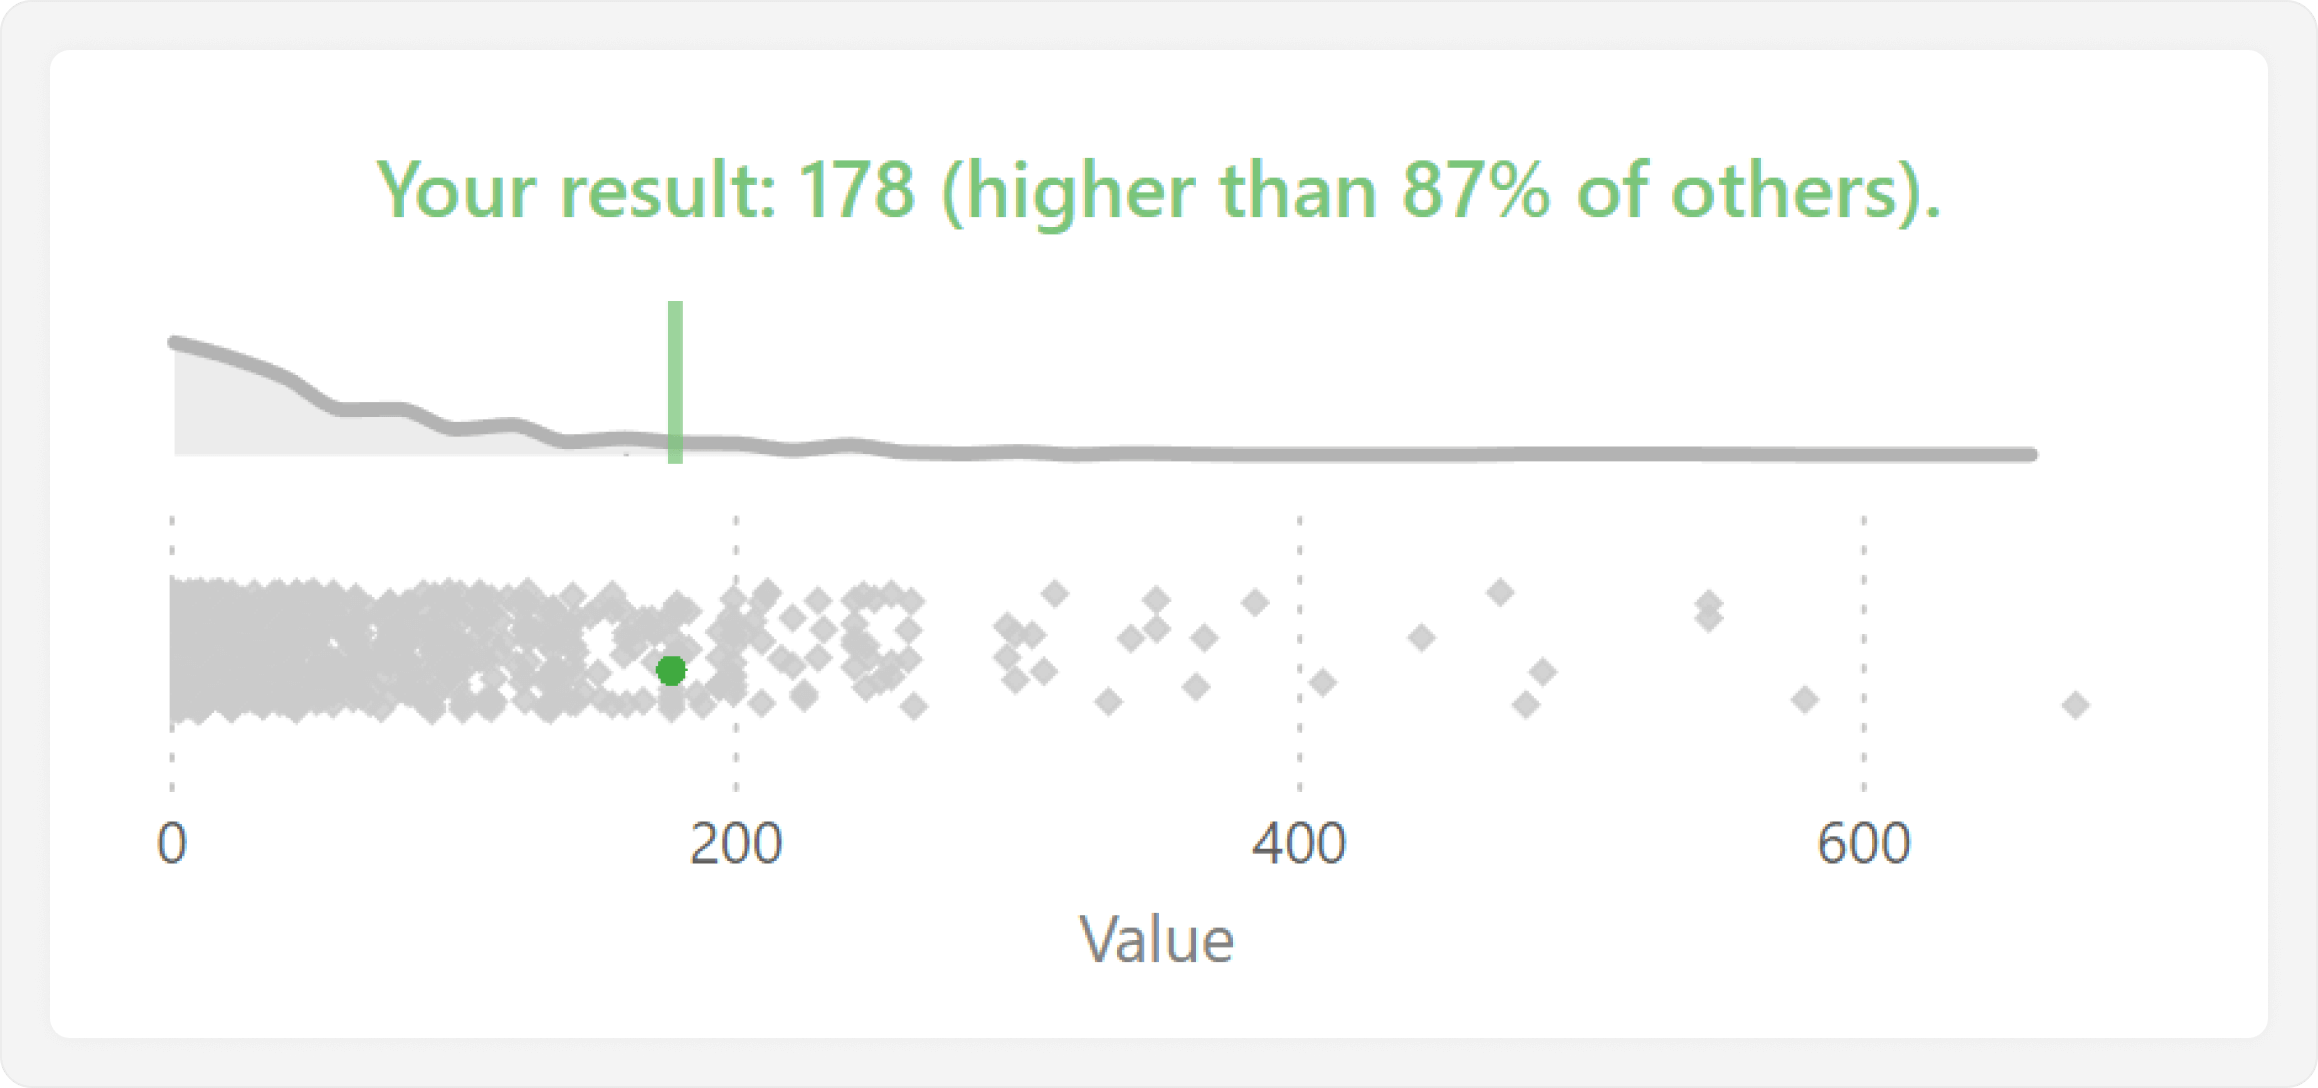
This article shows how you can highlight a single value in visual when comparing the distribution of a measure for one value versus all others. Read more