 Marco Russo & Alberto Ferrari
DAX code is often short. Understanding the question that the code must answer may be much harder.
Consider a calculation that multiplies a quantity by a rate. The formula appears simple, yet it is correct only if the quantity and the rate are evaluated while the rate has a clear meaning. If you perform the calculation after combining different rates, DAX must aggregate the rates somehow: AVERAGE, MIN, or MAX can return a number. However, returning a number does not make that number meaningful.
The principle to remember is the following:
Evaluate the business rule at the lowest grain where all its inputs have one unambiguous meaning; aggregate only afterward.
There are four grains involved in applying this principle:
- The source-table grain.
- The business-rule grain.
- The iteration or evaluation grain.
- The requested output grain.
These grains can be the same; in that case, the code is simple to write. The interesting problems arise when they differ. To showcase the scenario, we use a very simple model about producing lemonade.
Introducing the lemonade model
The sample model describes lemonade production. It contains two tables joined by a regular one-to-many relationship.
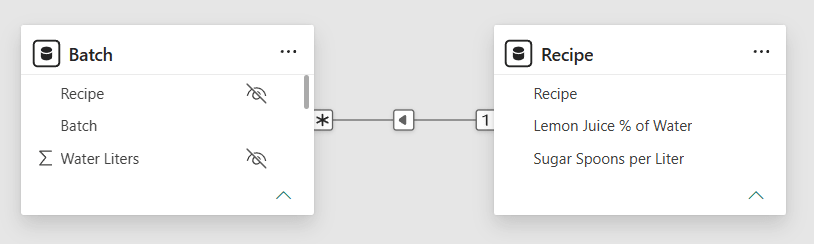
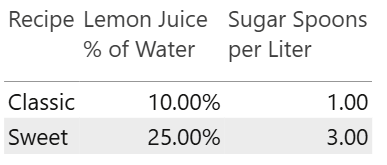
Recipe contains one row for each recipe. Ingredient rates are properties of a recipe; they are not additive values, and as such, they cannot be aggregated.
Batch contains one row for each production batch, and each batch, expressed in liters produced, follows a recipe.
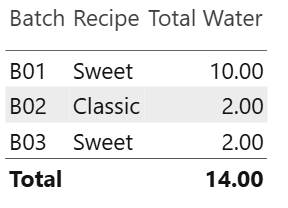
Water is additive. Therefore, the Total Water is straightforward, and it is already visible in the report:
Total Water = SUM ( Batch[Water Liters] )
However, the business question we want to answer is: “How many sugar spoons and how many liters of lemon juice should we allocate to prepare the three batches?”
The ingredient requirements are business rules:
- Sugar spoons are water liters multiplied by the sugar rate of the recipe.
- Lemon juice liters are water liters multiplied by the lemon percentage of the recipe.
The calculations are easy for an individual batch. For example, B01 uses 10 liters of water and the Sweet recipe, so it requires 30 spoons of sugar and 2.5 liters of lemon juice. Difficulty appears when multiple recipes are aggregated.
The following measures look reasonable at first sight. Total Water computes the total water, whereas the two percentages need to be aggregated, and AVERAGE may seem like a good idea:
Wrong Sugar = [Total Water] * AVERAGE ( Recipe[Sugar Spoons per Liter] )
Wrong Lemon = [Total Water] * AVERAGE ( Recipe[Lemon Juice % of Water] )
Both measures produce the expected value when the report shows one recipe in each row, but the total is clearly wrong. The value is correct at both the batch and recipe levels. Above the recipe level, it is not correct.
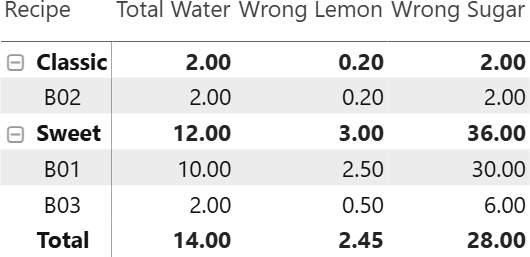
At the total level, Wrong Sugar computes 14 liters multiplied by the unweighted average of 1 and 3 spoons per liter. The result is 28. Wrong Lemon computes 14 multiplied by the average of 10% and 25%, returning 2.45 liters.
Neither calculation represents the production plan. The batches contain 12 liters of Sweet lemonade and only 2 liters of Classic lemonade. A simple average gives both recipes the same weight, producing an incorrect result.
By default, Power BI does not sum the visible rows. A measure is evaluated independently in every cell. In the total cell, the requested output contains both recipes, and the formula explicitly asks DAX to average their rates. DAX answers that question correctly; it is the question that is wrong, because it does not consider the different granularities at play.
The four grains identify where the mistake occurs.
| Grain | Question | Lemonade example |
| Source-table grain | What does one row in each table represent? | One production batch in Batch; one recipe in Recipe |
| Business-rule grain | At what grain do all inputs to the rule have one meaning? | Recipe, because one recipe determines one sugar rate and one lemon juice percentage |
| Iteration or evaluation grain | What rows does DAX evaluate before aggregating? | Batch rows, recipe rows, or one row for the entire filter context |
| Requested output grain | What grouping does the report request for the current cell? | Batch, recipe, or total |
The source grain is a property of the data, not of the DAX code. In this model, Batch and Recipe have different grains. The model works because every batch identifies its recipe through a relationship.
The business-rule grain is the level at which the rule can be evaluated without inventing an aggregation for any of its inputs. In the current model, you can first sum water by recipe because the ingredient rate is constant within each recipe.
This produces the following intermediate result.
| Recipe | Water liters | Sugar rate | Sugar spoons | Lemon rate | Lemon liters |
| Classic | 2 | 1.00 | 2 | 10% | 0.20 |
| Sweet | 12 | 3.00 | 36 | 25% | 3.00 |
Only after applying the rule to each row of this table is it safe to aggregate. The correct totals are 38 sugar spoons and 3.20 liters of lemon juice.
Evaluating at a finer grain is also safe, as we show with the next measure. In our example, computing the rule once for every batch produces the same result because the rate is constant for all batches of the same recipe.
However, evaluating below the necessary grain can perform more work than required. A useful operational interpretation of the central rule is therefore:
Never evaluate above the business-rule grain. A finer grain can be correct; the coarsest grain that still preserves an unambiguous meaning is usually more efficient.
The DAX expression defines the evaluation and the granularity: the table passed to the SUMX iterator declares the grain of the calculation. For example, the following measure evaluates the sugar rule at the Batch granularity. It multiplies the water liters in each Batch row by the number of sugar spoons per liter defined in the corresponding recipe:
Sugar Spoons at batch grain =
SUMX (
    Batch,
    Batch[Water Liters] *
        RELATED ( Recipe[Sugar Spoons per Liter] )
)
This formula is correct. However, you can perform the same calculation at the business-rule grain.
Sugar Spoons =
SUMX (
    SUMMARIZE (
        Batch,
        Recipe[Recipe],
        Recipe[Sugar Spoons per Liter]
    ),
    [Total Water] * Recipe[Sugar Spoons per Liter]
)
SUMMARIZE builds one row for each recipe visible in the current filter context. SUMX iterates those rows. Total Water invokes the context transition because it is a measure, so it returns the water for the current recipe. The rate comes from the recipe itself, which is the same iterated row. Finally, SUMX aggregates the recipe results, only after the rule has been applied.
The lemon calculation follows the same structure:
Total Lemon =
SUMX (
    SUMMARIZE (
        Batch,
        Recipe[Recipe],
        Recipe[Lemon Juice % of Water]
    ),
    [Total Water] * Recipe[Lemon Juice % of Water]
)
In this specific calculation, grouping only by Recipe[Lemon Juice % of Water] would also be correct and more efficient. Recipes with the same percentage can be combined because the percentage is the only non-additive input the rule uses. However, grouping by recipe as well can be simpler for an initial implementation, and it is easier to change if the rule later needs other recipe properties. Similarly, Sugar Spoons could aggregate by Recipe[Sugar Spoons per Liter], using a single multiplication for all recipes with the same number of sugar spoons per liter.
The source-grain and business-grain versions return the same values at the recipe rows and at the total. Both formulas evaluate the multiplication before combining rows with different rates.
The query generated for the report determines the requested output grain. A matrix can request a value for each batch, each recipe, or the entire production plan. It can also change after a user drills down or adds a field to the visual.
A robust measure does not rely on the output grain to produce correct results. In order to make the rule unambiguous, the measure enforces its own evaluation grain internally:
- On a recipe row, the iterator sees one recipe.
- At the grand total, the iterator sees both recipes and sums two results.
- If the visual does not display Recipe at all, the measure still evaluates the rule by recipe.
This is why you should not fix a total by blindly iterating the rows currently visible in a visual. The visual grain is a presentation choice. The business-rule grain belongs in the measure and should remain valid when the visual changes.
Recognizing the same problem in budgeting
Budgeting scenarios are a larger version of the lemonade example. Actual sales might exist by transaction, product, and day, while a budget is defined by product category and month. The source tables have different grains, the requested report can use yet another grain, and an allocation rule introduces its own grain.
There are only two correct choices when a report requests detail below the budget grain:
- Do not display the budget at unsupported detail.
- Define an explicit allocation rule that creates that detail.
Repeating a category budget for every product is not allocation. It duplicates the value. Similarly, computing one allocation factor after categories or periods have already been combined evaluates the rule at a grain above its valid level.
The Budget pattern makes the business choices explicit and computes prior-year sales at the forecast grain before allocating the forecast. The article, Budget and Other Data at Different Granularities in PowerPivot illustrates the related modeling problem with daily sales and monthly budgets. In both cases, the complexity comes from creating meaning across grains: the DAX formula in the model measure is the final representation of those choices.
The four-grain framework scales to these scenarios:
| Grain | Typical budgeting example |
| Source-table grain | Sales by transaction and day; budget by category and month |
| Business-rule grain | The category-month or other governed allocation group |
| Iteration or evaluation grain | The groups over which allocation factors are computed and applied |
| Requested output grain | Product, day, territory, subtotal, or grand total requested by the report |
The developer must decide whether the requested output is supported directly, needs an allocation, or should return blank. You cannot delegate that decision to AVERAGE or the total row of a matrix.
A checklist for grain-aware DAX
Before writing a measure, answer these questions:
- What does one row mean in every source table used by the calculation?
- Which keys make every rate, threshold, percentage, status, or other rule input unambiguous?
- Which inputs are additive before the rule is applied, and which are not?
- What virtual table should an iterator enumerate to express the business-rule grain?
- Is the chosen evaluation grain independent of the fields currently displayed in the visual?
- Has any upstream transformation aggregated away a key required by the rule?
- What should happen when the report requests detail below the grain supported by the data?
- Can the result be verified by manually computing a few business-grain rows and aggregating them?
The last test can be very effective. Do not start by checking whether the grand total equals the visible rows. First, build the small intermediate table at the business-rule grain, validate each row, and only then validate its aggregation.
Conclusion
The hardest part of many DAX calculations is deciding where to evaluate the business rule. The source grain describes the available data. The business-rule grain describes where the rule has meaning. The iteration grain describes what the DAX code actually does. The requested output grain describes what the report asks for. Correct results require these four grains to be compatible, not necessarily identical.
The lemonade model is a simple example to show what could go wrong, because it has only two recipes and three batches. In a real model, the same mistake can be hidden behind thousands of products, changing rates, allocations, and several dimensions.
The rule of thumb is to evaluate the business rule at the lowest grain where all its inputs have one unambiguous meaning, and aggregate only afterward.

Returns the average (arithmetic mean) of all the numbers in a column.
AVERAGE ( <ColumnName> )
Returns the smallest value in a column, or the smaller value between two scalar expressions. Ignores logical values. Strings are compared according to alphabetical order.
MIN ( <ColumnNameOrScalar1> [, <Scalar2>] )
Returns the largest value in a column, or the larger value between two scalar expressions. Ignores logical values. Strings are compared according to alphabetical order.
MAX ( <ColumnNameOrScalar1> [, <Scalar2>] )
Returns the sum of an expression evaluated for each row in a table.
SUMX ( <Table>, <Expression> )
Creates a summary of the input table grouped by the specified columns.
SUMMARIZE ( <Table> [, <GroupBy_ColumnName> [, [<Name>] [, [<Expression>] [, <GroupBy_ColumnName> [, [<Name>] [, [<Expression>] [, … ] ] ] ] ] ] ] )