 Marco Russo & Alberto Ferrari
Let us start with a simple challenge: we want to show the percentage of sales in Europe, compared to the sales made to all customers worldwide. It is a relatively trivial question, the kind of DAX code you learn at the beginning of your Power BI career, and it can be solved with a simple measure:
Pct over All =
DIVIDE (
    [Sales Amount],
    CALCULATE (
        [Sales Amount],
        ALL ( Customer )
    )
)
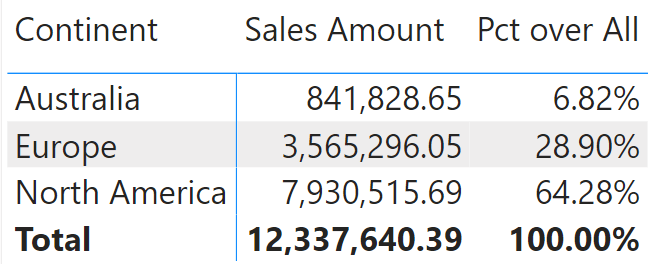
When used in a report, it behaves well.
However, there is an issue with this measure if the model includes security roles based on Customer. For example, you might need to reduce the visibility to some users based on the continent. One user can see Europe and Australia; another may only see North America.
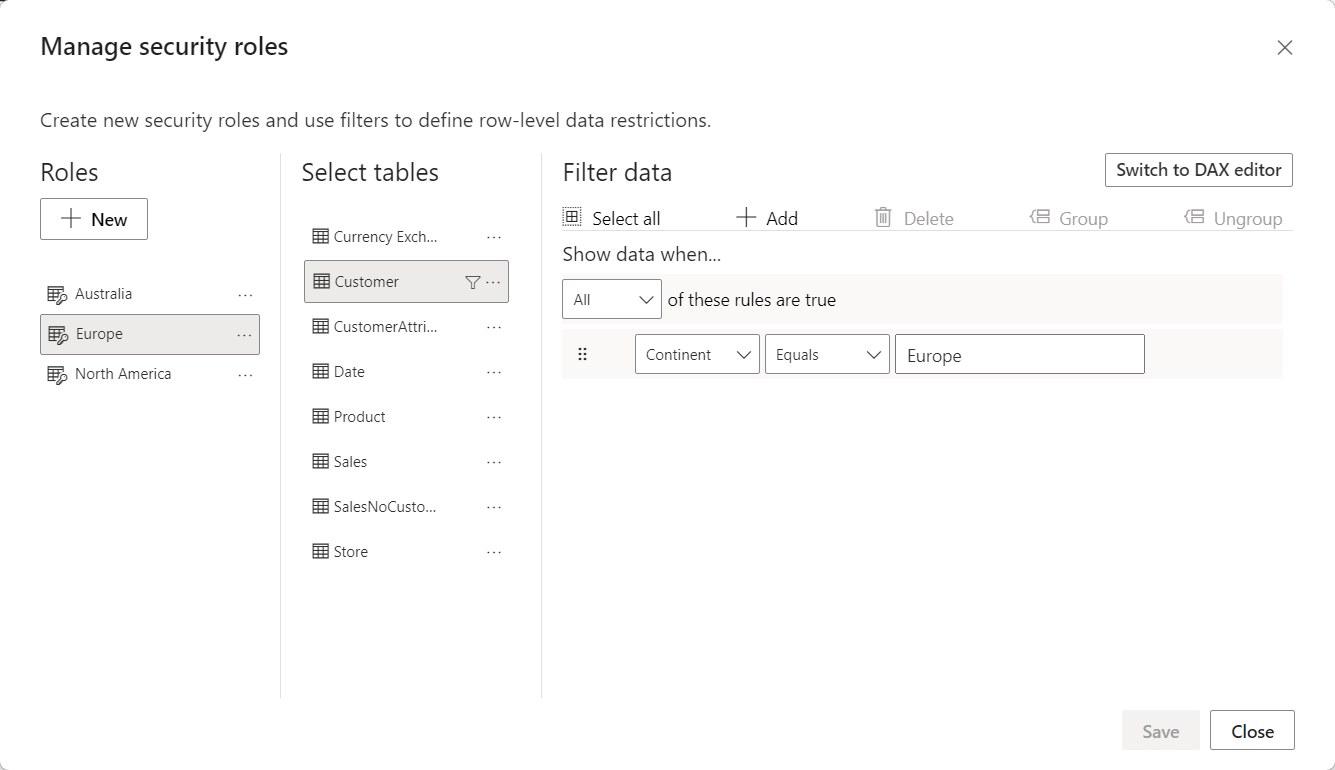
Because the continent is part of the Customer table, you set row-level security on Customer by filtering the Customer[Continent] column the proper way for each role.
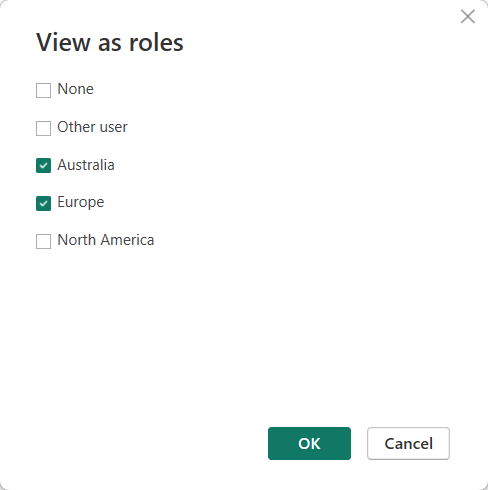
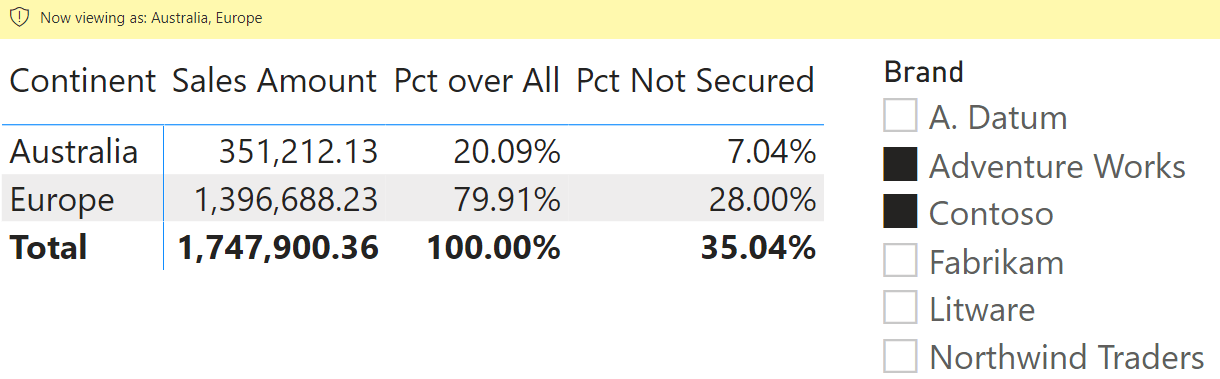
When a security filter is active, DAX cannot remove it. Users who belong to the Europe role can only see European customers. Any customer from outside Europe disappears as if they did not exist. In other words, when ALL ( Customer ) is executed, ALL removes all the filters from the Customer table except for the security filters. Consequently, the percentage will be computed against the customers visible after security has been applied, resulting in a different result. To demonstrate this, we browse the model while impersonating a user with two roles, Australia and Europe.
When browsing the matrix, the result shows only two continents with different percentages.
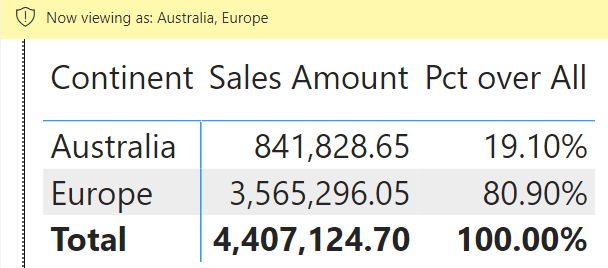
The percentage of Europe is now 80.90%, whereas it was 28.90% in the previous report. The underlying data is the same; what changed is the data that is visible to the user. A user allowed to see only Europe data would see 100% as the percentage. In other words, we are not computing the percentage against all sales but the percentage against the sales we are allowed to see.
There are scenarios where this is the desired behavior. In those cases, the job is done. However, a common requirement is to show the percentage more consistently. We do not want a user to see sales details in other countries; yet we do want to compute percentages correctly.
The technique to obtain this goal is straightforward. However, it is a delicate topic. As soon as you show the correct percentage, you also indirectly show the total sales. We are not interested in whether showing the total sales is right or wrong in your specific scenario. Our goal is to update the model to show the correct percentage.
Let us start with a simple statement: once Customer is secured, there are no ways to compute the world’s total by scanning Sales. The filter on Customer reaches Sales, and all the transactions outside of the allowed countries become inaccessible. To compute the total of all sales, we need to store that total in a table that is not secured.
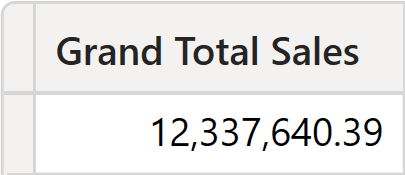
The simplest solution, yet very rigid, is to materialize a calculated table with the total of sales:
GrandTotalSales = ROW ( "Grand Total Sales", [Sales Amount] )
The calculated table is computed during the data refresh, when security is not active yet. Therefore, it would create a single-row table containing the total needed to calculate the percentage.
Despite being very simple, this solution would be unacceptably rigid. Indeed, its content cannot be sliced by Product, Store, Date, or any other dimension in the model. As such, its usability is very limited. A better solution requires creating a table that contains the total of sales for all customers worldwide, but that can still be sliced by the dimensions that are not secured. The only dimension we want to avoid is the secured one, which is Customer.
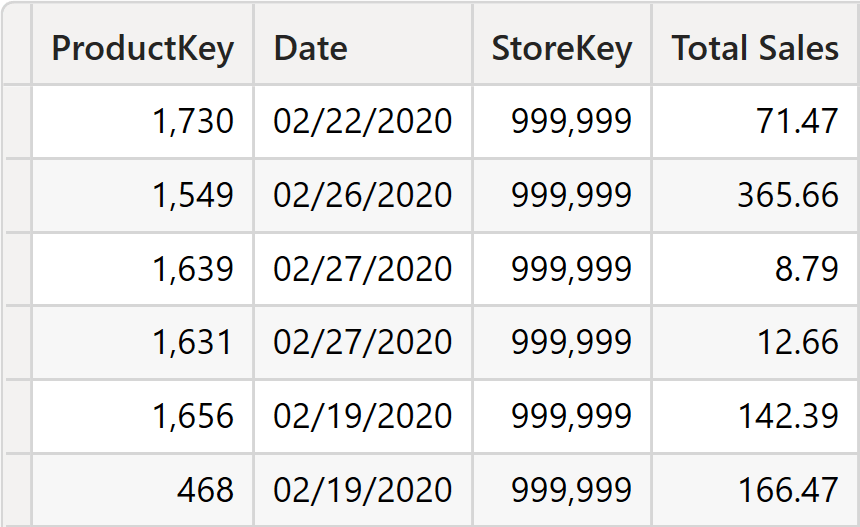
We can reach our goal by creating a new calculated table named SalesNoCustomer:
SalesNoCustomer =
ADDCOLUMNS (
    SUMMARIZE (
        Sales,
        'Product'[ProductKey],
        'Date'[Date],
        Store[StoreKey]
    ),
    "Total Sales", [Sales Amount]
)
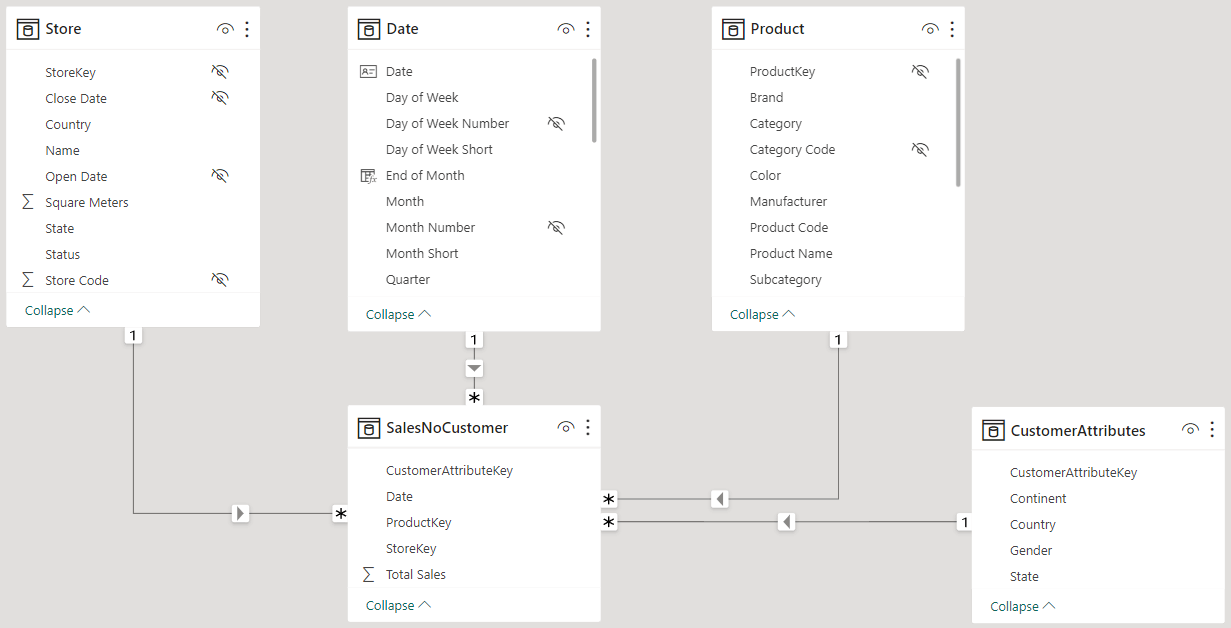
The table contains the keys needed to create relationships with the dimensions, with the noticeable absence of CustomerKey. It is intentionally missing because we do not want Customer to filter the SalesNoCustomer table.
Once the table is in the model, we create the proper set of relationships.
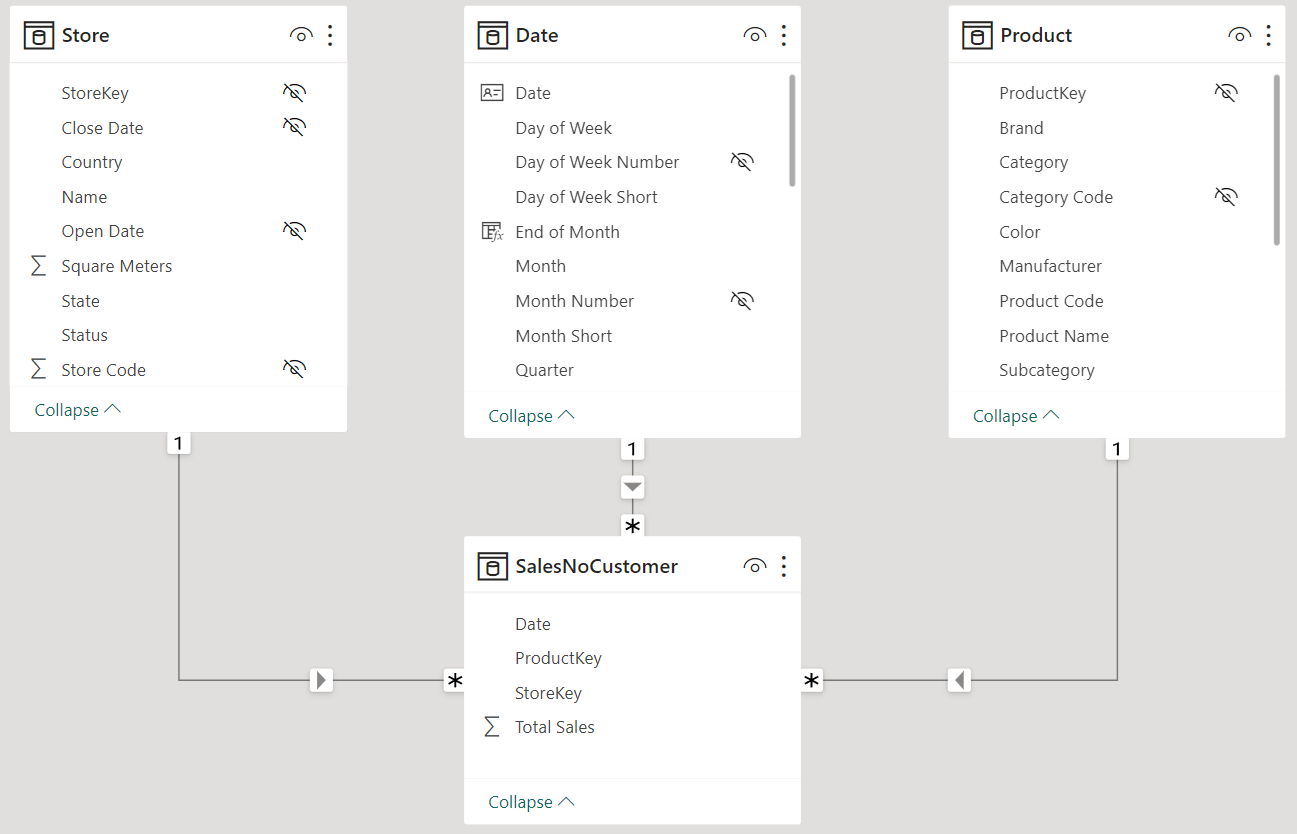
Based on the SalesNoCustomer table, we can now create a measure that computes the percentage correctly:
Pct Not Secured =
DIVIDE (
    [Sales Amount],
    SUM ( SalesNoCustomer[Total Sales] )
)
It is worth noting that the numerator computes the sales amount based on Sales. In contrast, the denominator is based on SalesNoCustomer, so it is not affected by any filter present on the Customer table.
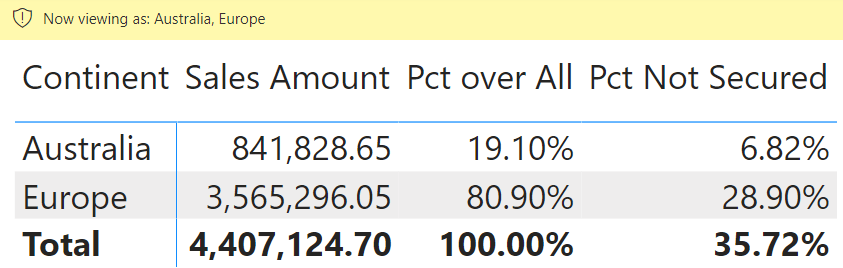
As you can see, the percentage computed by Pct Not Secured shows a value of 6.82%, providing a result based on the total of all the continents – this is called a non-visual calculation, because it is based on a number that is not visible.
Because SalesNoCustomer is linked to Product, as well as other dimensions, the measure computes dynamic values correctly in the presence of filters, too.
SalesNoCustomer is likely to be a hidden table, as users are not expected to use the table in reports; it is used internally in measures that need to provide non-visual totals. However, be mindful that hiding the table does not protect the data. Users can connect to the model and query the table, browsing its entire content. Showing non-visual totals requires a careful evaluation of the data that is exposed.
As we have established earlier, computing non-visual calculations requires the creation of a new table in the model. The table is linked to all the tables we want to use for slicing and dicing, thus avoiding a relationship with the table being secured.
However, there are scenarios where the requirement is a bit more complex: some of the attributes of Customer need to be used to slice and dice, and others should be hidden. For example, we may want users to slice the worldwide totals by Continent, Country, State, and Gender while hiding the customer names and all the remaining customer details. Because all the columns belong to Customer, and Customer is secured, we need further updates to the model to make this happen.
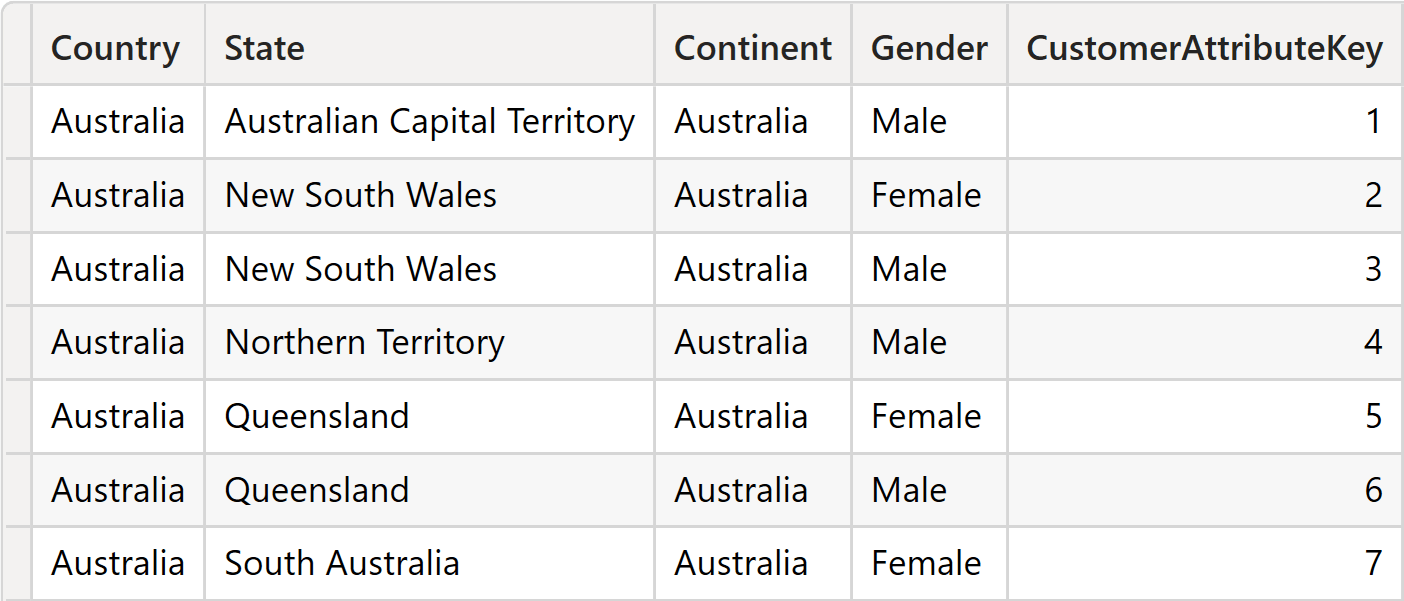
Following the pattern we demonstrated above, we know that the columns used to slice SalesNoCustomer cannot be in Customer, as we will not link Customer to SalesNoCustomer. However, we can create a new dimension named CustomerAttributes with the attribute required, along with a new column that acts as the primary key:
CustomerAttributes =
VAR T =
    SUMMARIZE (
        Customer,
        Customer[Country],
        Customer[State],
        Customer[Continent],
        Customer[Gender]
    )
RETURN
    ADDCOLUMNS ( T, "CustomerAttributeKey", ROWNUMBER ( T ) )
The resulting table contains the columns from Customer which filter SalesNoCustomer.
The next step requires us to add CustomerAttributeKey to SalesNoCustomer. Because SalesNoCustomer is generated starting from Sales, we need to add CustomerAttributeKey to Sales through a new calculated column:
CustomerAttributeKey =
LOOKUPVALUE (
    CustomerAttributes[CustomerAttributeKey],
    CustomerAttributes[Country],    RELATED ( Customer[Country] ),
    CustomerAttributes[State],      RELATED ( Customer[State] ),
    CustomerAttributes[Continent],  RELATED ( Customer[Continent] ),
    CustomerAttributes[Gender],     RELATED ( Customer[Gender] )
)
Once the column is ready in Sales, we can propagate it to SalesNoCustomer by just adding it to the set of group-by columns in SUMMARIZE:
SalesNoCustomer =
ADDCOLUMNS (
    SUMMARIZE (
        Sales,
        Sales[CustomerAttributeKey],
        'Product'[ProductKey],
        'Date'[Date],
        Store[StoreKey]
    ),
    "Total Sales", [Sales Amount]
)
The last step is then to create the relationship between SalesNoCustomer and CustomerAttributes.
Once the model is set, you can use it to create measures like the percentage of sales against all sales to customers with the same gender. That measure would be impossible to create if Gender did not filter SalesNoCustomer. Therefore, to build the report, we must use the Gender column from CustomerAttributes. The measure is a standard pattern using the pair ALL/VALUES – if you were thinking about using ALLEXCEPT please read the article, Using ALLEXCEPT versus ALL and VALUES:
Pct same gender =
DIVIDE (
    [Sales Amount],
    CALCULATE (
        SUM ( SalesNoCustomer[Total Sales] ),
        ALL ( CustomerAttributes ),
        VALUES ( CustomerAttributes[Gender] ),
     )
)
This measure works with the model we built so far. To appreciate how it works, let us write a Pct same gender Generic measure that computes the percentage against the same gender on a regular model:
Pct same gender Generic =
DIVIDE (
    [Sales Amount],
    CALCULATE (
        [Sales Amount],
        ALL ( Customer ),
        VALUES ( Customer[Gender] )
    )
)
When viewed with no security enabled, this measure shows 100% at the gender level, as expected.
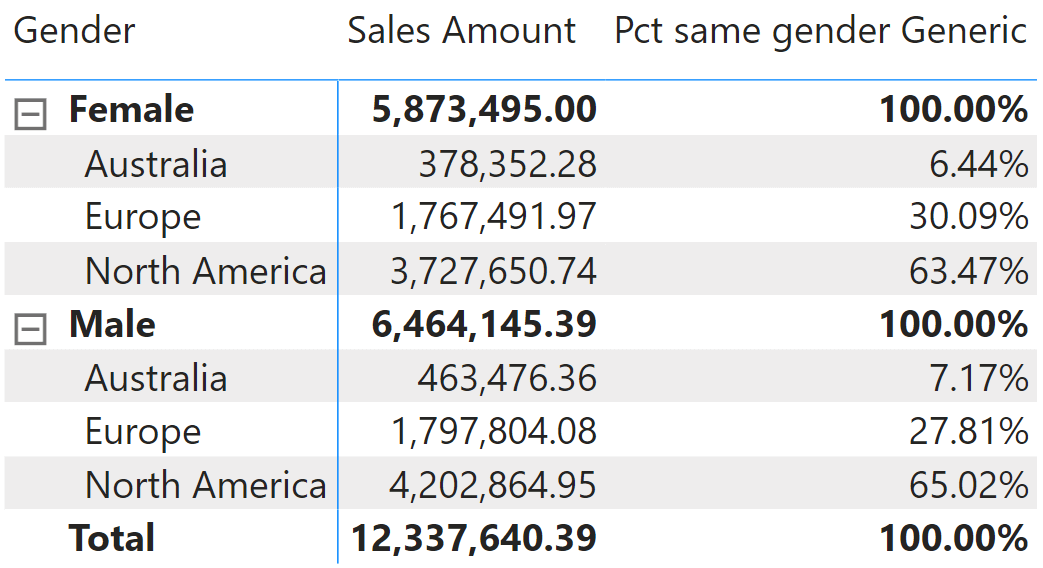
When a user subject to security is browsing the model, the matrix must be built using columns from CustomerAttributes. As you can see, Pct same gender presents the same numbers as the unsecured model.
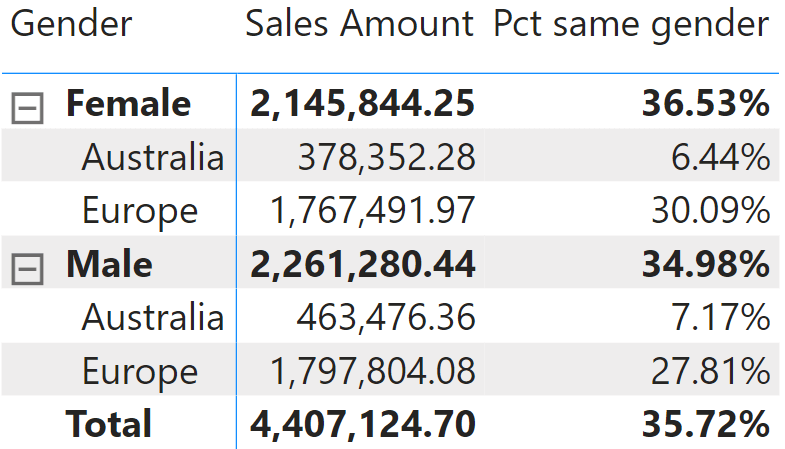
When using non-visual calculations, numbers may be hard to read and understand. For example, think about the total of this latter matrix: 35.72% just seems wrong. But the value is correct: it is the percentage of the values visible (4,407,124.70) divided by the total (12,337,640.39). However, as the total is not visible in the report, users may conclude it is inaccurate. Non-visual totals should be considered advanced calculations, requiring extensive training and meetings for a thorough understanding of the numbers.
Conclusions
Non-visual totals are a requirement in many businesses, as they reflect the need to hide certain details of a dimension, while still showing the totals and certain attributes. Despite not being part of the modeling options of Tabular, we can implement non-visual calculations in a straightforward manner. They require careful modeling and a lot of attention to detail. Finally, numbers are more complex to understand. As is always the case with business intelligence, we focus on producing accurate values rather than easy-to-grasp values. If a number is hard to understand, it only means we need to spend more time educating and communicating with users.
Returns all the rows in a table, or all the values in a column, ignoring any filters that might have been applied.
ALL ( [<TableNameOrColumnName>] [, <ColumnName> [, <ColumnName> [, … ] ] ] )
Creates a summary of the input table grouped by the specified columns.
SUMMARIZE ( <Table> [, <GroupBy_ColumnName> [, [<Name>] [, [<Expression>] [, <GroupBy_ColumnName> [, [<Name>] [, [<Expression>] [, … ] ] ] ] ] ] ] )
Returns all the rows in a table except for those rows that are affected by the specified column filters.
ALLEXCEPT ( <TableName>, <ColumnName> [, <ColumnName> [, … ] ] )