This post describes DAX with AI: Scenarios, our new video course on using AI for complex business requirements in DAX.
DISCLAIMER: I drafted this post with the help of AI, starting from my notes and the outlines of the course modules. I manually reviewed and edited the entire post.
DAX with AI: Scenarios is complete and available as of today, November 2, 2026: four weeks earlier than planned! When we launched the course in September, we committed to releasing it by November 30, 2026. If you've already enrolled, the new modules are available in the same course.
I announced this course in September, together with two other courses, in Where we stand on AI and DAX in 2026. This post focuses on the new course only.
Three Video Courses about using AI to write DAX
DAX with AI: Scenarios completes the three courses we created for different steps in using AI to write DAX:
- AI for Power BI: Intro
 is a free course that explains the basics of AI in Power BI. It is not about Copilot: it is about using agents, skills, plugins, and MCP (Model Context Protocol) servers to manipulate Power BI models and reports.
- DAX with AI: Essentials
 teaches how to read the DAX code generated by AI tools. If you already know DAX, here you learn how to write correct prompts and how to use the agents to write measures. If you know the AI tools but you are new to DAX, you learn how to read DAX even if you cannot write it.
- DAX with AI: Scenarios
 deals with complex scenarios where your work is mainly to control the direction of the development. This includes writing DAX code and modifying the model so that it produces the correct result for the business problem described.
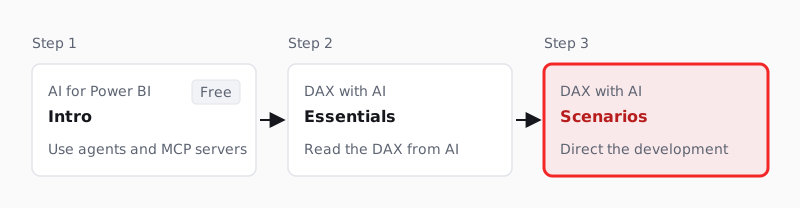
These courses are for those who are new to DAX or who aren't regularly using AI agents to write DAX. We focus on how you write the request, and we show how to reason about the problem, give instructions, and check the result. We do not teach AI tools, because they change so often that a course about the actual tools would become obsolete before it is even published. It does not matter whether you use Visual Studio Code, Claude, Codex, or other tools: you can find installation instructions on separate pages that we keep up to date.
Concepts and scenarios
The course is organized in two tracks: Common Concepts and Scenarios.
A concept lesson explains, with practical demos, a design pattern you can use in several scenarios. For example, the lesson on grain uses a model of lemonade recipes, where sugar and lemon juice depend on the water in each recipe. If you apply the recipe rates after adding up the water, the quantities are wrong. The small model makes this error visible without the noise of a large model.
Three concept lessons cover topics we also described in recent articles: Understanding DAX contracts when using AI, Writing DAX at the correct granularity, and The hidden complexity of a daily average in DAX.
The same concept comes back in different scenarios with a different business meaning. This is the reason why the course separates concepts from scenarios. Each concept is explained once in its own lesson, and each scenario can be followed without repeating those explanations.
Scenarios’ prerequisites
Every scenario starts with a short introduction that presents the learning targets and the concepts needed: new and already viewed. New concepts are required for the first time in the course sequence, and you should study them (or make sure you already know them) before the scenario. Already viewed concepts are lessons introduced in previous scenarios.
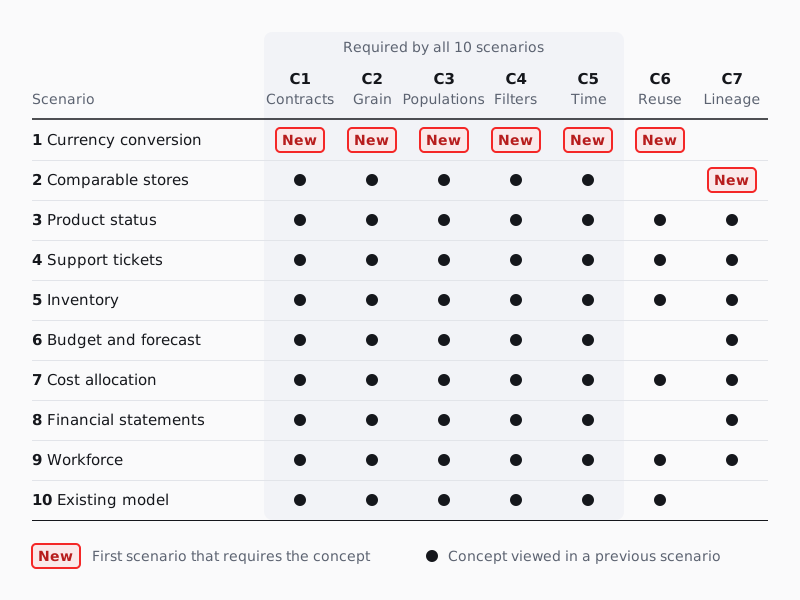
If you follow the course in order, this introduction tells you what to watch next. For example, the comparable-store scenario lists the lesson on virtual tables and lineage as new, because no earlier scenario requires it. It also lists five other lessons as already viewed.
If you start from a specific scenario, the two lists together are your prerequisites. You may already know some of these concepts: skip them, or watch them as a review. When a concept is new to you, the corresponding lesson is there.
This lets you start with the scenario you need in the short term. For example, imagine you must compare actuals with an annual budget next week. You can start from the budget and forecast scenario after checking its six concept lessons, without watching the previous five scenarios.
The concepts are few, but every scenario uses most of them. The first five lessons, from calculation contracts to time and snapshots, are required by all ten scenarios. If you plan to follow more than one scenario, my suggestion is to watch those five lessons first. The module table below shows the concepts required by each scenario.
Every scenario follows the same method
All the scenarios use the Contoso model, extended with tables for support tickets, inventory, budget and forecast, operating costs, accounting, and workforce. The data is synthetic but consistent across tables. For example, the monthly profit and loss snapshots reconcile with the accounting journal within one cent for every account, store, and month.
In every demo, the AI agent works on the semantic model through an MCP server. It inspects the metadata, runs DAX queries, and creates measures, functions, calculated tables, and calculation groups. Each module includes the demo files and the prompts used in the videos.
After the introduction, each scenario submits the request that a business user could write. For example, the support scenario starts by asking AI for ticket volume, resolution time, SLA compliance, and activity by channel and store. The measures may look correct and still count interactions as tickets, or silently use the wrong date or store.
Then we delete those measures and ask AI which questions can change the result. Our answers become a calculation contract: a short list of rules about the counted entity, the population, the dates, the filters, and the totals. We save the contract and extend it before each new calculation, instead of agreeing on every detail at the beginning.
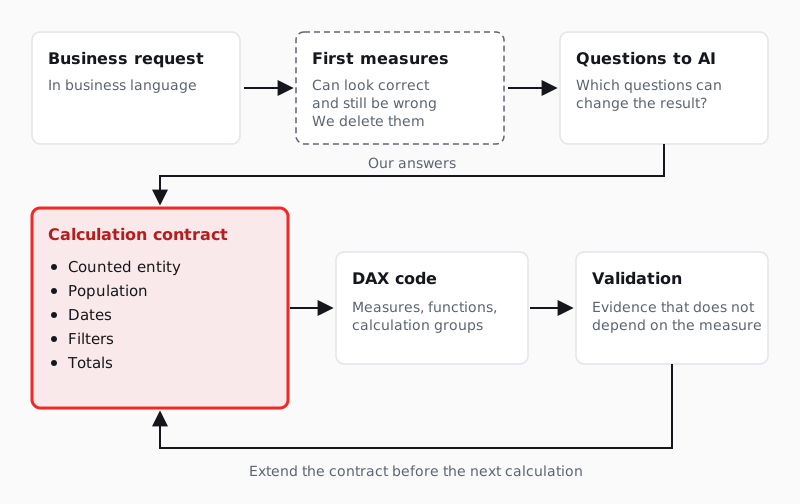
Each scenario also includes a mistake that AI is likely to make on that requirement. For example, in the inventory scenario, AI may use one global snapshot date for all the products and stores. However, on April 30, 2025, the latest snapshot falls on six different dates, depending on the product and the store. When AI makes the mistake, we show how the contract and the validation expose it. When AI writes correct code, we explain why the code works, instead of forcing an error.
Validation uses evidence that does not depend on the measure being tested. For example, the last scenario changes two measures in an existing model. Before the change, we save a baseline query with the results of all 45 measures. After the change, we check that only the six measures affected by the two corrections return different results.
Concepts and scenarios included
The following tables list all the modules, with the concept lessons required by each scenario.
Common Concepts
| Lesson | Topic | Duration (min) |
| C1 – Calculation Contracts and Strength of Claims | What "average sale" means: a short contract before the code, because correct DAX can answer the wrong question | 24 |
| C2 – Grain, Iteration Grain, Additivity, and Totals | Source, rule, iteration, and output grain, with a small lemonade model where rates applied after aggregation give wrong quantities | 22 |
| C3 – Populations, Denominators, and Validation | Which days and products belong in an average: blank versus zero, coverage boundaries, and benchmarks with ALL and ALLSELECTED | 33 |
| C4 – Filter Paths and Relationship Semantics | Sales by delivery date with USERELATIONSHIP, TREATAS, and CROSSFILTER, and an annual budget filtered by month but not allocated | 27 |
| C5 – Time, Events, States, and Snapshots | Events, intervals, states, and snapshots in a ticket backlog, and why daily states cannot be added over time | 24 |
| C6 – Reusable DAX: Measures, Functions, and Calculation Groups | One positive-sales rule written as measures, then as a user-defined function, then as a calculation group | 18 |
| C7 – Virtual Tables, Lineage, and Set-Based DAX | Customers in the countries of the selected stores with TREATAS, INTERSECT, and EXCEPT, counting each customer once | 17 |
Scenarios
| Scenario | Topic | Concepts | Duration (min) |
| 1 – Currency Conversion with Historical and Current Rates | USD sales converted at the order-date rate or at the current rate, then a reusable function and the limits of its reuse | C1–C6 | 67 |
| 2 – Comparable-Store Sales | Three definitions of comparable store (sales activity, lifecycle dates, operational status) applied as one cohort to both periods | C1–C5, C7 | 114 |
| 3 – Yearly Product Status Transitions | One stored status per product and year, a transition matrix, and its logic reused through a function and a calculation group | C1–C7 | 61 |
| 4 – Support Ticket Resolution and Interaction Journeys | Tickets versus interactions, SLA compliance, historical backlog, first and final channel, and Store and Date roles selected with calculation groups | C1–C7 | 107 |
| 5 – Inventory Availability from Movements, Sparse Snapshots, and Reservations | End-of-day stock from sparse snapshots and signed movements, reservations as effective intervals, and three stock algorithms compared | C1–C7 | 125 |
| 6 – Budget, Forecast, and Actuals at Incompatible Grains | Annual budget and versioned monthly forecast compared with actuals, allocation with stored weights, and actuals continued by the latest forecast | C1–C5, C7 | 98 |
| 7 – Shared-Cost Allocation and Profitability | Store operating costs allocated to products and customers with sales, purchase, and inventory drivers, visible residuals, and materialized weights | C1–C7 | 109 |
| 8 – Financial Statements with Ragged Accounts | Profit and loss and balance sheet over a ragged account hierarchy, with consolidation eliminations, closing balances, and partial periods | C1–C5, C7 | 134 |
| 9 – Workforce Analytics | Headcount, movements, and capacity from an employee-day fact, then as-of salaries in one currency compared with role peers | C1–C7 | 110 |
| 10 – Adopting an Existing Model with AI | A disputed report on an existing model: recover its contracts, correct two measures, and validate what changed and what did not | C1–C6 | 61 |
Conclusions
DAX with AI: Scenarios is a library of ten business scenarios and seven concept lessons. It is the third of the three courses we announced in September: the first introduces the tools, the second teaches how to read the DAX written by AI, and the third applies both to complex requirements.
You do not need to watch this course from the beginning to the end. Choose the scenario closest to your next project, check the concepts listed in its introduction, and watch only the lessons you need.
In every scenario, the rule is the same: agree on the contract before asking AI to generate the code, then validate the result.

Returns all the rows in a table, or all the values in a column, ignoring any filters that might have been applied.
ALL ( [<TableNameOrColumnName>] [, <ColumnName> [, <ColumnName> [, … ] ] ] )
Returns all the rows in a table, or all the values in a column, ignoring any filters that might have been applied inside the query, but keeping filters that come from outside.
ALLSELECTED ( [<TableNameOrColumnName>] [, <ColumnName> [, <ColumnName> [, … ] ] ] )
Specifies an existing relationship to be used in the evaluation of a DAX expression. The relationship is defined by naming, as arguments, the two columns that serve as endpoints.
USERELATIONSHIP ( <ColumnName1>, <ColumnName2> )
Treats the columns of the input table as columns from other tables. For each column, filters out any values that are not present in its respective output column.
TREATAS ( <Expression>, <ColumnName> [, <ColumnName> [, … ] ] )
Specifies cross filtering direction to be used in the evaluation of a DAX expression. The relationship is defined by naming, as arguments, the two columns that serve as endpoints.
CROSSFILTER ( <LeftColumnName>, <RightColumnName>, <CrossFilterType> )
Returns the rows of left-side table which appear in right-side table.
INTERSECT ( <LeftTable>, <RightTable> )
Returns the rows of left-side table which do not appear in right-side table.
EXCEPT ( <LeftTable>, <RightTable> )