There are cases where the dictionary size reported by VertiPaq Analyzer (used by DAX Studio, Bravo for Power BI, and Tabular Editor 3) does not correspond to the actual memory required by the dictionary. However, the number reported is technically correct because it represents the memory currently allocated for the dictionary. The issue is that – after a refresh – this memory amount is larger than the actual memory required for hash-encoded columns.
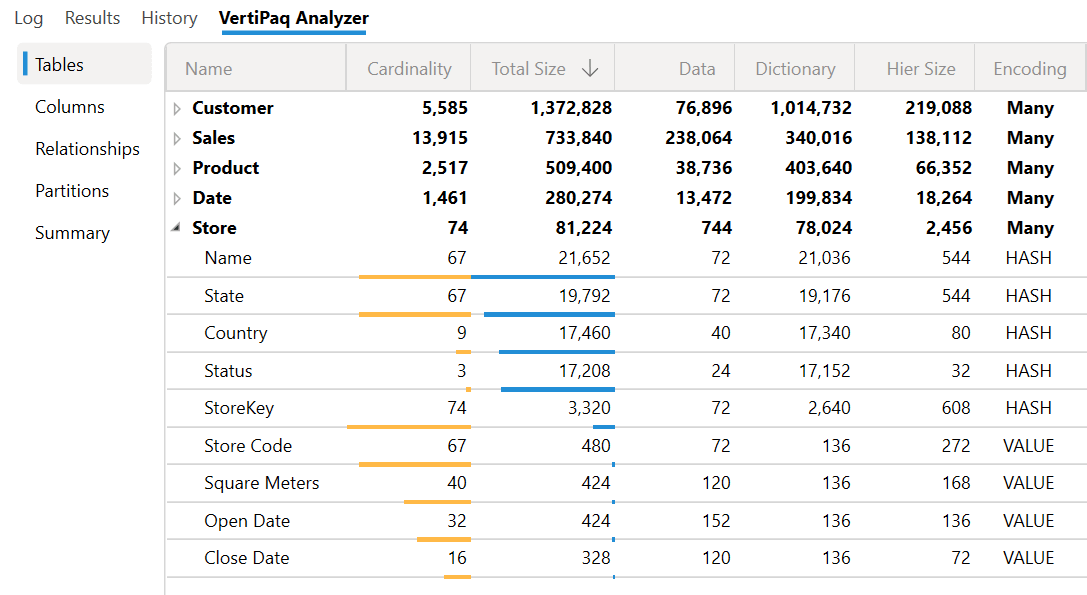
We can illustrate this problem with an example in Power BI Desktop. In the following screenshot, all the columns with hash encoding have a small cardinality and a low amount of memory allocated: every column in the Store table does not consume more than 21K of RAM.
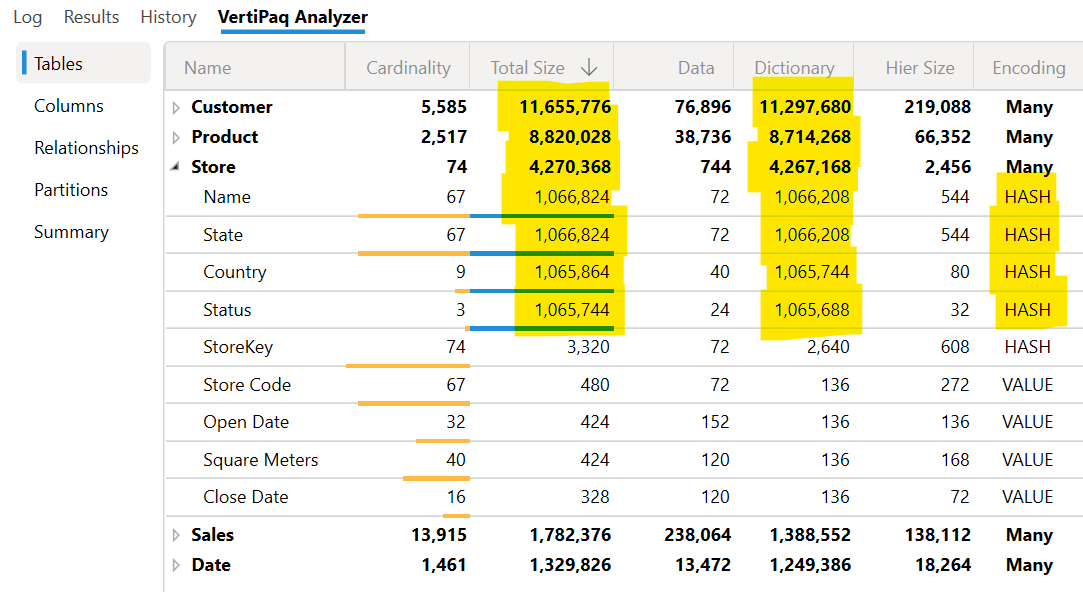
The previous screenshot was taken just after the Power BI Desktop was open. At this point, we run Refresh, which reprocesses all the tables. After that, most of the hash columns have a larger dictionary size – going above 1M of RAM for each column – even if their cardinality did not change. Moreover, the Total Size and the Dictionary Size of several tables are much larger than the size in the previous screenshot: the reason is the larger amount of RAM required for each hash-encoded column.
Why is this happening? Because during the processing, the Analysis Services engine allocates memory to store the dictionary entries: it allocates a large amount of memory because allocating memory incrementally would be slower and inefficient. However, the side effect is that at the end of the processing, we have memory allocated but not used, as reported by VertiPaq Analyzer.
How can we see the “right” dictionary and total size? If you use Power BI Desktop, a simple way is to close the PBIX file and open it again. The dictionary size is the right one when Analysis Services restores a database, because it knows the exact amount of memory required in advance. When you open a Power BI Desktop file, its internal Analysis Services engine restores the Tabular database in memory.
However, suppose this problem happens on a dataset published on Power BI Service, or a database in Azure Analysis Service or SQL Server Analysis Services. In that case, the memory allocated is not released, and a backup/restore operation could be long and disruptive. As a workaround, we can execute a Process Defrag operation on all the tables that may be affected by this issue. This workaround can be particularly important if you have a table with many columns. When the Process Defrag is executed, the Tabular engine rebuilds the dictionary for all the table columns without accessing the data source. This operation is typically required to reduce the dictionary size in datasets and databases subject to incremental refresh. However, even though you do not have unused dictionary entries, Process Defrag can release the unused memory previously allocated by a Refresh Data operation, reducing the dictionary size to the right required value.
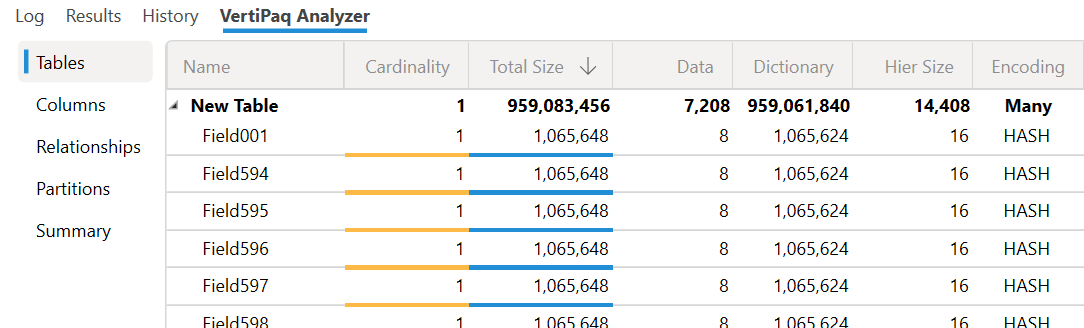
For example, here is the extreme case where there is a table with 900 columns and just one row after a full refresh.
We run the following XMLA command to Analysis Services to defrag the table (you can do the same with Power BI Service through an XMLA endpoint).
{
  "refresh": {
    "type": "defragment",
    "objects": [
      {
        "database": "Many Columns",
        "table": "New Table"
      }
    ]
  }
}
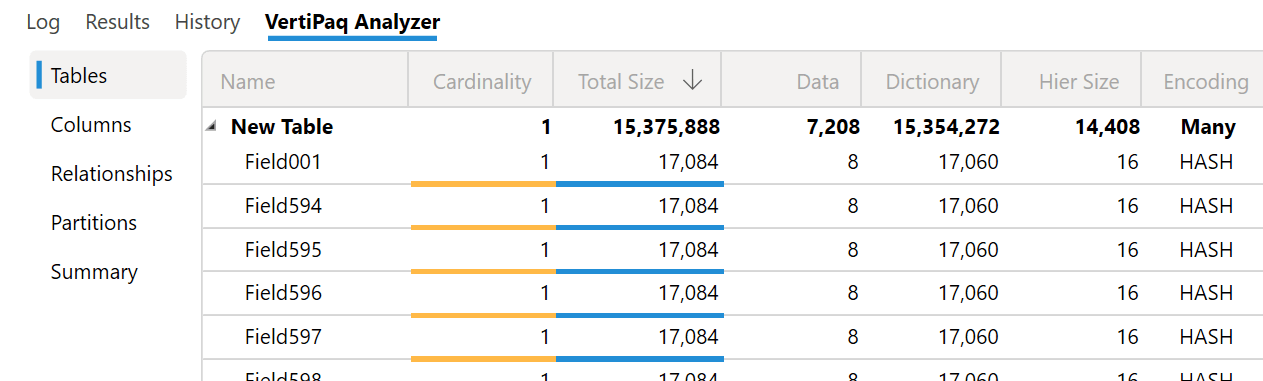
The memory reported by VertiPaq Analyzer is now correct.
However, the memory released for the unused dictionary is not immediately returned to the operating system. Analysis Services does not release memory unless it exceeds the Low Memory Limit threshold. However, this technique is usually helpful in getting more accurate measures, and it could be useful to release memory only in extreme conditions where the amount is critical to avoid out-of-memory conditions.