Last week, a new version of DAX Studio (2.5.0) has been released. You can find a summary of the new features in the blog post from Darren Gosbell – thanks Darren for your wonderful job with this tool!
My small contribution to this tool is mainly in the area of performance analysis. In the last few months, I worked on implementing a support for DirectQuery, which I described in the article Analyze DirectQuery requests using DAX Studio on SQLBI. I also fixed a few bugs in the xmSQL formatting code (we clean up a number of verbose information, but sometimes we still cut too much from xmSQL, expect more fixes in upcoming releases). But I also added a small feature that will help to save a lot of time in performance analysis.
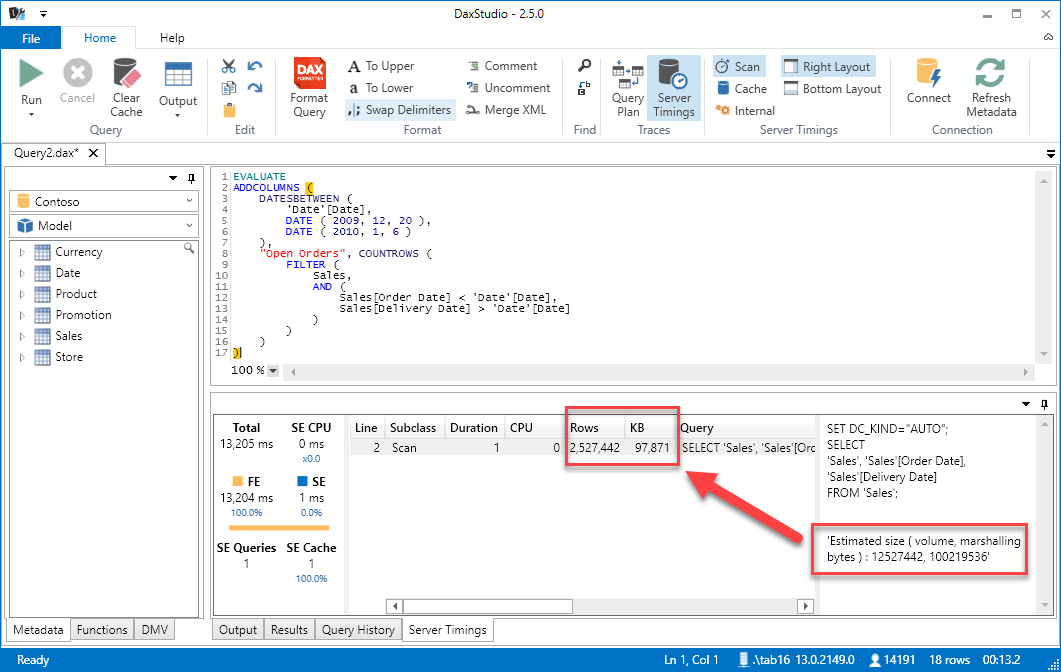
The server timings tab has two new columns, Rows and KB, that have the following meaning:
- Rows: it is the number of rows that have been estimated by the query engine as a result of the query. This number is important to get an idea of the cardinality of the result. However, be careful: this is an estimation, and the actual result could be different, but in general the order of magnitude provided is relevant. When you spot one or more storage engine queries returning more rows than the result of the entire query, you know that such a materialization will be filtered or aggregated by the formula engine, which is not efficient in doing that as the storage engine. In other words, a large number of rows in a storage engine query could be indirectly responsible of a bottleneck recognized in the formula engine.
- KB: it is the estimated size in memory (measured in KB) of the result of the storage engine query (this result is also called data cache). Usually this size is related to the number of rows, but when you materialize an entire table instead of a few columns, the KB number will be very high compared to the Rows. By identifying the storage engine queries with the larger KB size, it should be easier to identify which part of the DAX code is responsible for that. Classical examples of that are filters based on a tables instead of one or two columns only, and context transition iterating a table without a primary key (typical in fact tables) instead of iterating just the values of a single column.
These two columns are populated only when you connect DAX Studio to Power BI, or Excel 2016, or Analysis Services 2016 (if you connect to previous versions, you will see these columns empty). The reason is that we simply parse the text of the storage engine query, and in these products at the end of the query text there is an estimation of rows and memory used, which we simply copy in the properties of the events captured in the trace session, as you see in the following screenshot.

This feature is particularly useful when you have many storage engine queries for a single MDX or DAX query, and you want to identify potential bottlenecks in both the storage engine (complex queries in SQL) and the formula engine (which does not cache its results, and usually iterates all the rows of the data cache).