A few weeks ago I received a question that inspired me in writing this article about how to handle data at different granularities in PowerPivot and BISM Tabular. I think this is a common pattern when you have a budget table that contains data at an aggregated level (like month and product category) and you want to compare it with sales that are stored at product and day level. This scenario can be handled in a BISM Multidimensional model by using relationship with other attributes in a dimension, but this is not possible in PowerPivot and BISM Tabular because of the lack of attribute relationships in the model.
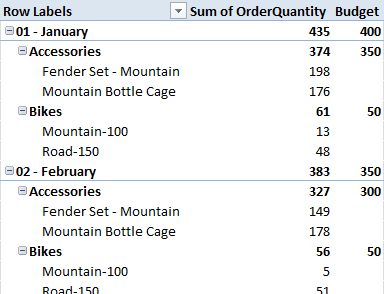
In PowerPivot and BISM Tabular you have two issues: first, you have to create a single PivotTable with both Budget and Sales measures; second, you want to blank the budget value when a dimension or an attribute that is not included in the budget is drilled down. After that you may want to split the budget over these dimensions/attributes according with an allocation algorithm. In the article I covered the first two issues, whereas the third might be the topic for a future post. The following is the final result you will obtain – OrderQuantity and Budget are the two measures obtained from columns of two different tables, Sales and Budget, that have different granularities.
I’d like to get feedback from PowerPivot users that approached the same issue with alternative solutions.