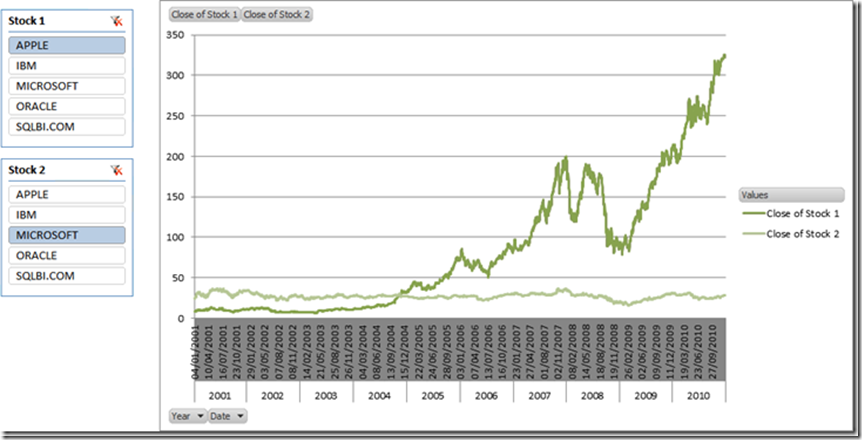
One new nice feature of Excel 2010 is the Slicer. Usually, slicers are used to filter data in a PivotTable. But they might be also useful to parameterize an algorithm or a chart! We discussed this technique in our book, but Alberto Ferrari wrote a post that shows how to use this technique to allow the user to select two stocks that should be compared in an Excel Chart – as you might imagine, this will work also when you will publish the workbook on SharePoint!
This is the result:

Nice to see that we use a Microsoft product to show how well Apple shares have been in the last two years!
If you want to know more about PowerPivot, don’t miss the opportunity to follow one of the workshops I and Alberto are bringing all over Europe in the next few months.
You can find more info on www.powerpivotworkshop.com. Hope to see you there!