If you work with Power Pivot, Power BI, or Analysis Services Tabular, you probably already know VertiPaq Analyzer. If you never used it, with the new release 1.7 you have another couple of very good reason to try it.
VertiPaq Analyzer is a Power Pivot workbook that extracts information from data management views (DMVs) of a Tabular model. It can be connected to a SSAS Tabular or a Power BI database. If you have a Power Pivot data model, just import it in Power BI and extracts the information from there. You will quickly see what are the tables and columns that are more expensive, and you will have all the details about cardinality of columns and tables at a glance. This is of paramount importance when you have to optimize a DAX expression. However, these are the features we already had in VertiPaq Analyzer. What’s new in this release?
- There are two versions of the VertiPaq Analyzer, which is an Excel file with VBA macros now (for the new VertiPaq Analyzer ribbon)
- The version with suffix 1103 uses the “legacy” DMVs for Multidimensional
- The version with suffix 1200 starts using the new DMVs for Tabular (which are available only for compatibility level 1200 – more on that in this article.
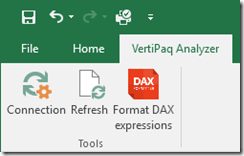
- There is a ribbon for VertiPaq Analyzer that includes a button to format all the DAX expressions:

- And yes, there are three new worksheets that show all the measures, calculated columns, and calculated tables extracted from the data model, each one with its own DAX expression
- Last but not least, the Relationships worksheet shows in a clear way the tables and columns involved for each relationship, including two measures about the maximum cardinality of the columns involved in the relationship.
This tool is amazing to do remote troubleshooting, or even just to document what are the DAX formulas you have in a model at a given point in time. It saves me hours every week. I hope it will be useful to you, too!