 Marco Russo & Alberto Ferrari
Finding errors in DAX measures has always been difficult because a single DAX measure produces different results in different cells of the same report, and we do not have a direct way of executing the code step by step in Power BI. This article describes four techniques to find an error in a DAX formula: we start with variable manipulation that does not require any external tool, and then we see how to leverage features available in DAX Studio, DAX Debug Output, and Tabular Editor 3.
Introducing the business scenario
The model includes an Avg Transaction measure, that returns the average amount of transactions:
Avg Transaction :=
AVERAGEX (
    Sales,
    Sales[Quantity] * Sales[Net Price]
)
Let us assume we must create a measure that returns the difference in percentage between the overall Avg Transaction displayed in a report and the Avg Transaction for the same set of products in all the periods displayed in a visual. Because the measure should dynamically change the calculation based on the filters applied to the report, we create a calculation based on a ratio between the value of Avg Transaction and the Avg Transaction computed with ALLSELECTED.
The correct version of the formula is the following:
Delta Avg (Correct) :=
DIVIDE (
    [Avg Transaction],
    CALCULATE ( [Avg Transaction], ALLSELECTED ( 'Date' ) )
) - 1
That said, we need a version with a bug for the purpose of debugging the DAX code. Thus, we use this incorrect version which is missing Date in ALLSELECTED:
Delta Avg 1 :=
DIVIDE (
    [Avg Transaction],
    CALCULATE ( [Avg Transaction], ALLSELECTED ( ) )
) - 1
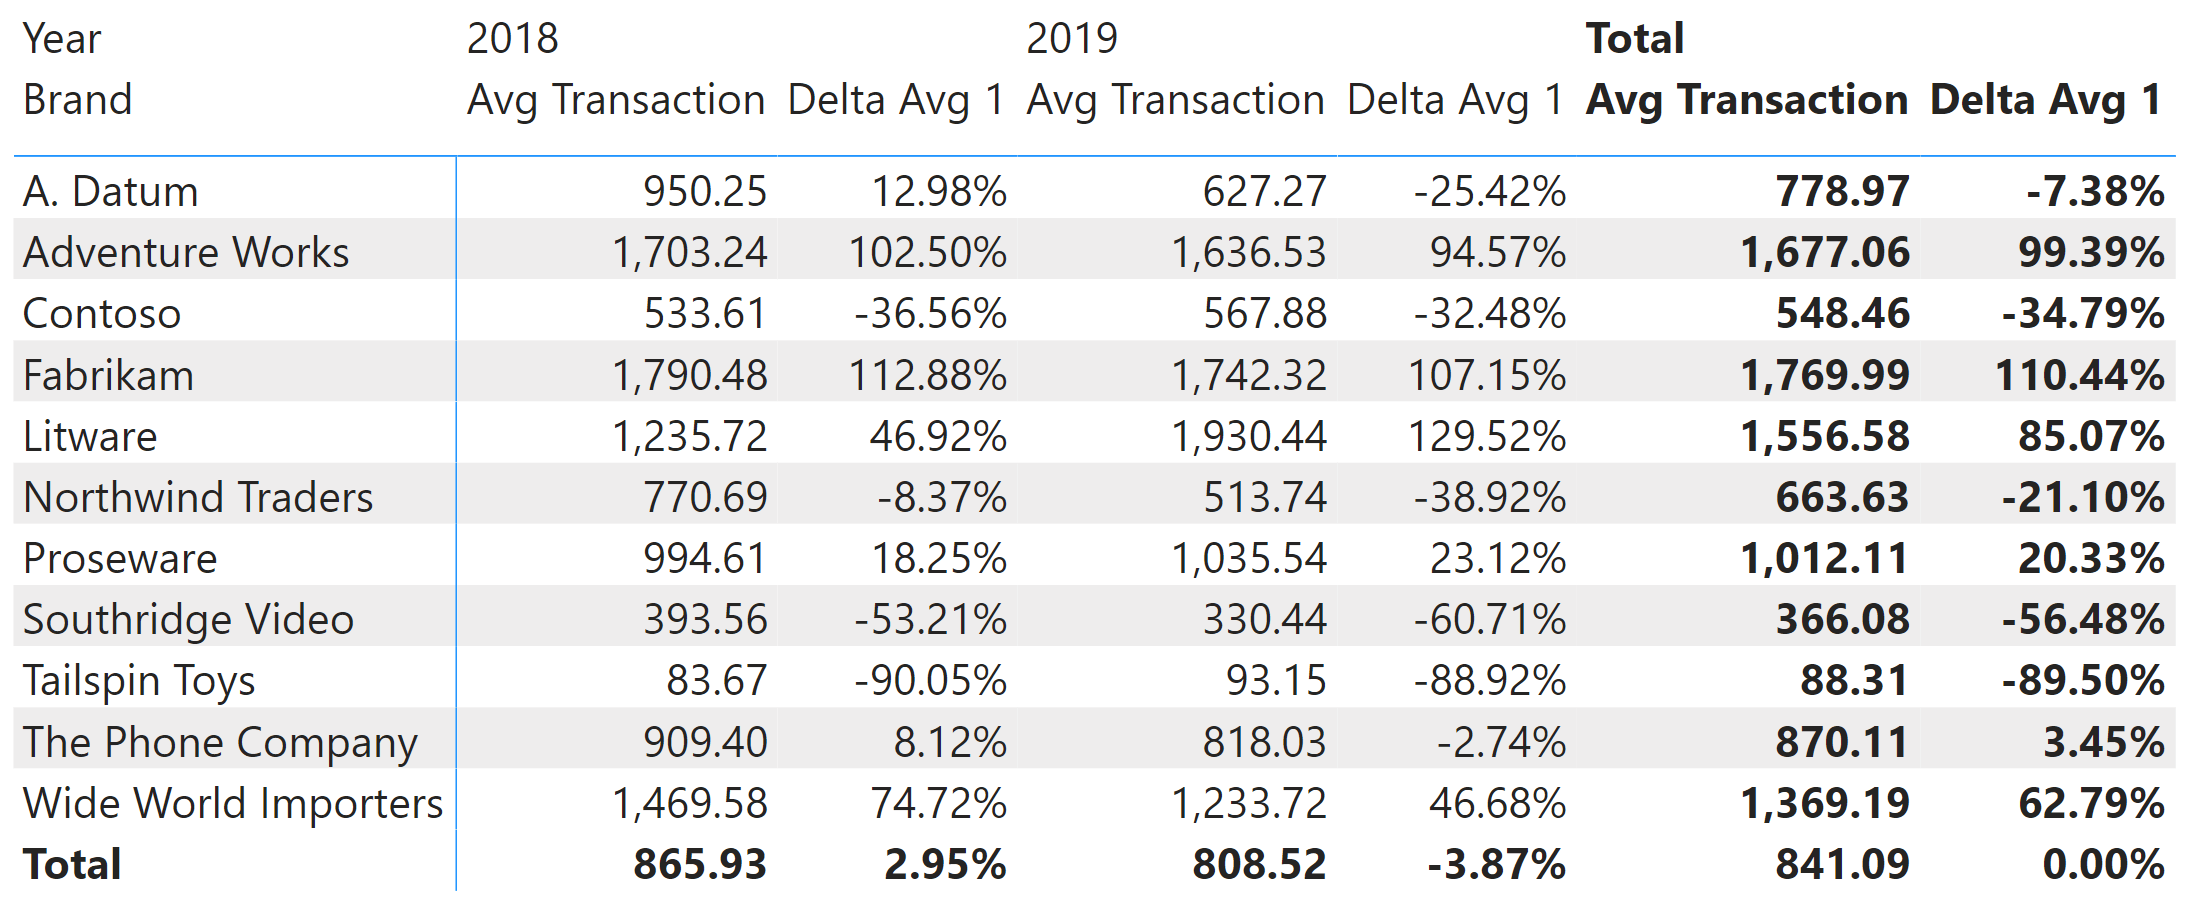
The report shows numbers that are not correct. Delta Avg 1 should be 0% in the Total column because each year should be compared with the Total amount of Avg Transaction, for each brand.
As anticipated, the calculation is wrong. How do we find which part of the calculation must be fixed? The idea of a “debugger” is to inspect the calculation step by step until we find an intermediate result that does not correspond to what we expect.
Debugging with the use of variables
Writing DAX expressions using variables can improve the readability of the code, and make it easier to inspect an intermediate calculation step in a report. For example, we can rewrite the Delta Avg calculation this way:
Delta Avg 2 :=
VAR CurrentValue = [Avg Transaction]
VAR ReferenceValue = CALCULATE ( [Avg Transaction], ALLSELECTED ( ) )
VAR CurrentDelta = CurrentValue – ReferenceValue
VAR Result = DIVIDE ( CurrentDelta, ReferenceValue )
RETURN Result
The advantage of using a final variable called Result is that we can easily change the value returned by RETURN and restore the final value by restoring the expected RETURN Result statement. For example, we can inspect the value of the ReferenceValue variable by changing the last line of the measure:
Delta Avg 2 :=
VAR CurrentValue = [Avg Transaction]
VAR ReferenceValue = CALCULATE ( [Avg Transaction], ALLSELECTED ( ) )
VAR CurrentDelta = CurrentValue – ReferenceValue
VAR Result = DIVIDE ( CurrentDelta, ReferenceValue )
RETURN ReferenceValue
The report shows the value of Avg Transaction computed by applying ALLSELECTED in the report. The number is displayed in a percentage format, but this is not important because we can see that the value is the same for all the cells of the report.
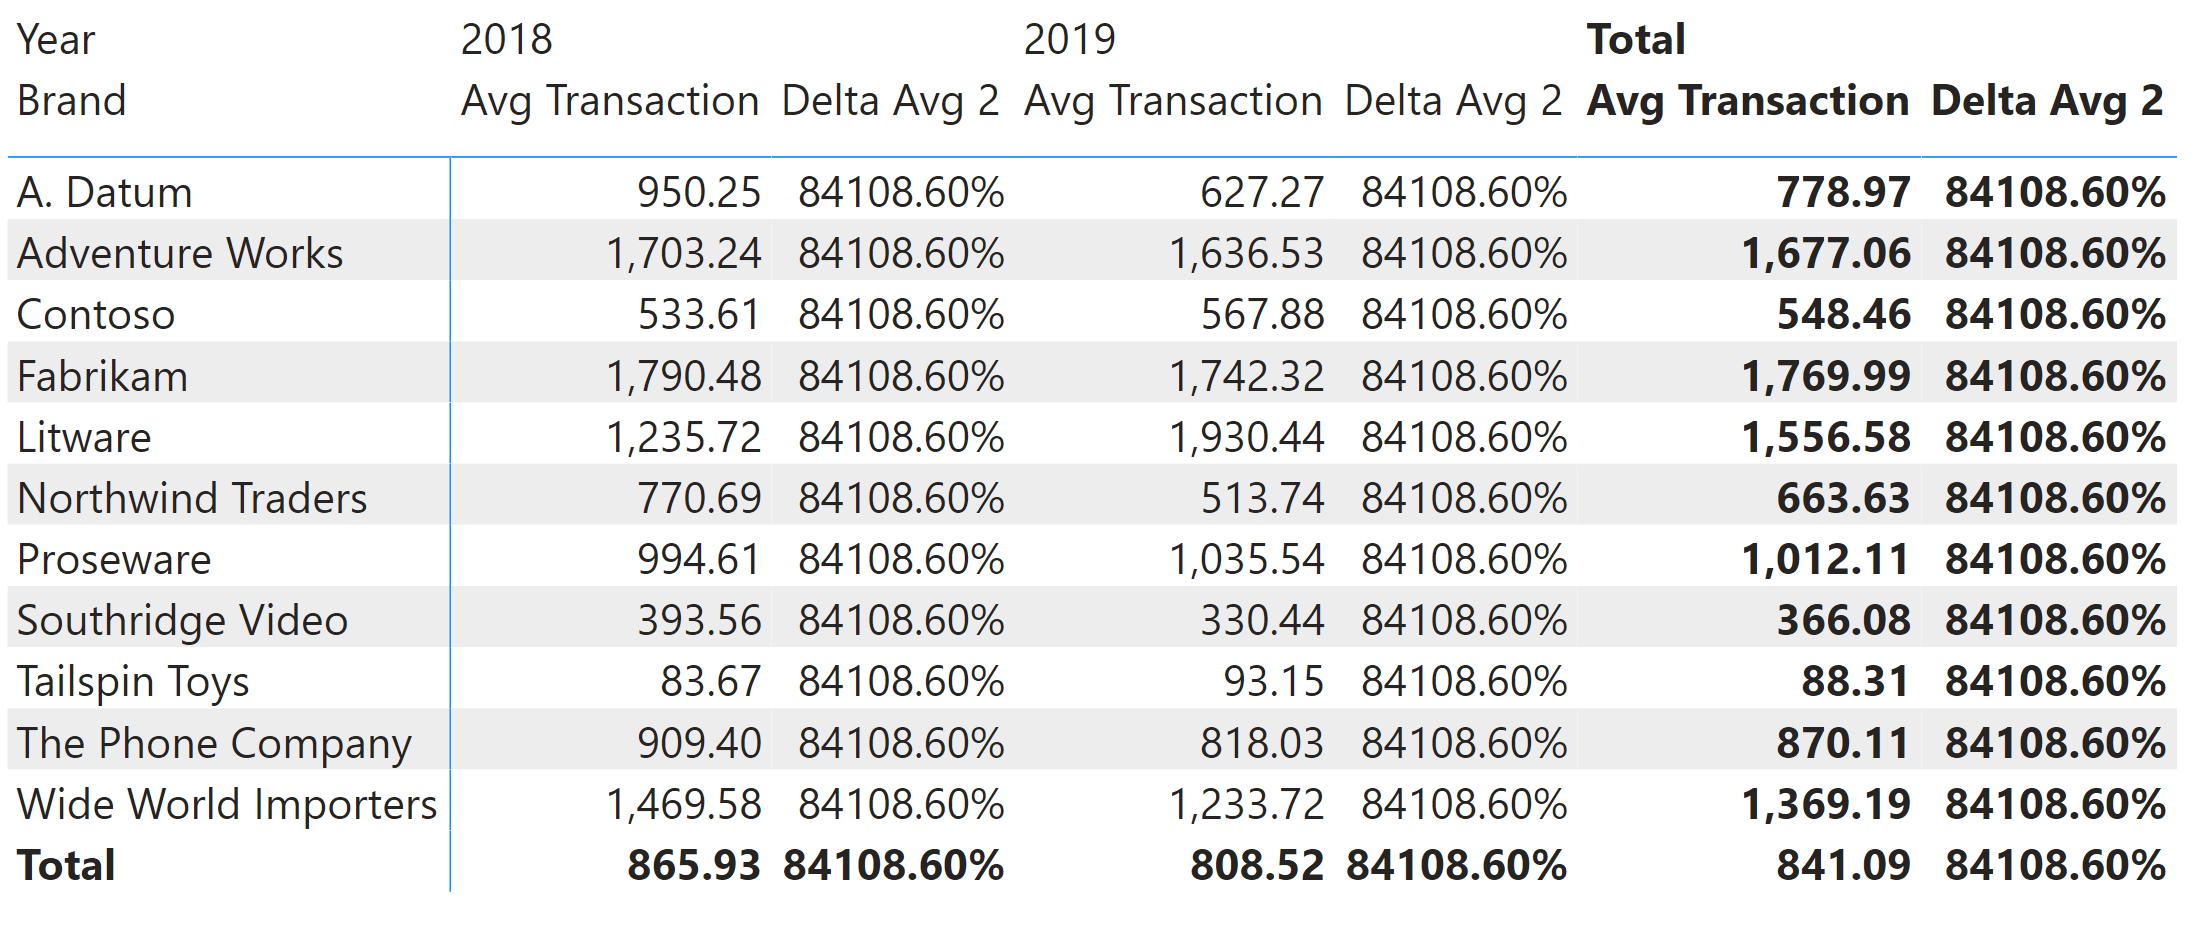
Based on our requirements, we expected to see the value of Total Delta Avg 2 in each row repeated every year. However, every row (every brand) should have a different value. We see that the number displayed in Delta Avg 2 is now always the same, and it corresponds to the grand total of Avg Transaction for all the years and all the brands in the report. The number we see (84108.60%) is just the value of 841.09 multiplied by 100. The difference is caused by the rounding applied to Avg Transaction, displayed with two digits after the decimal point.
We can now fix the calculation for ReferenceValue by using ALLSELECTED only for the Date table:
Delta Avg 2 :=
VAR CurrentValue = [Avg Transaction]
VAR ReferenceValue = CALCULATE ( [Avg Transaction], ALLSELECTED ( 'Date' ) )
VAR CurrentDelta = CurrentValue – ReferenceValue
VAR Result = DIVIDE ( CurrentDelta, ReferenceValue )
RETURN ReferenceValue
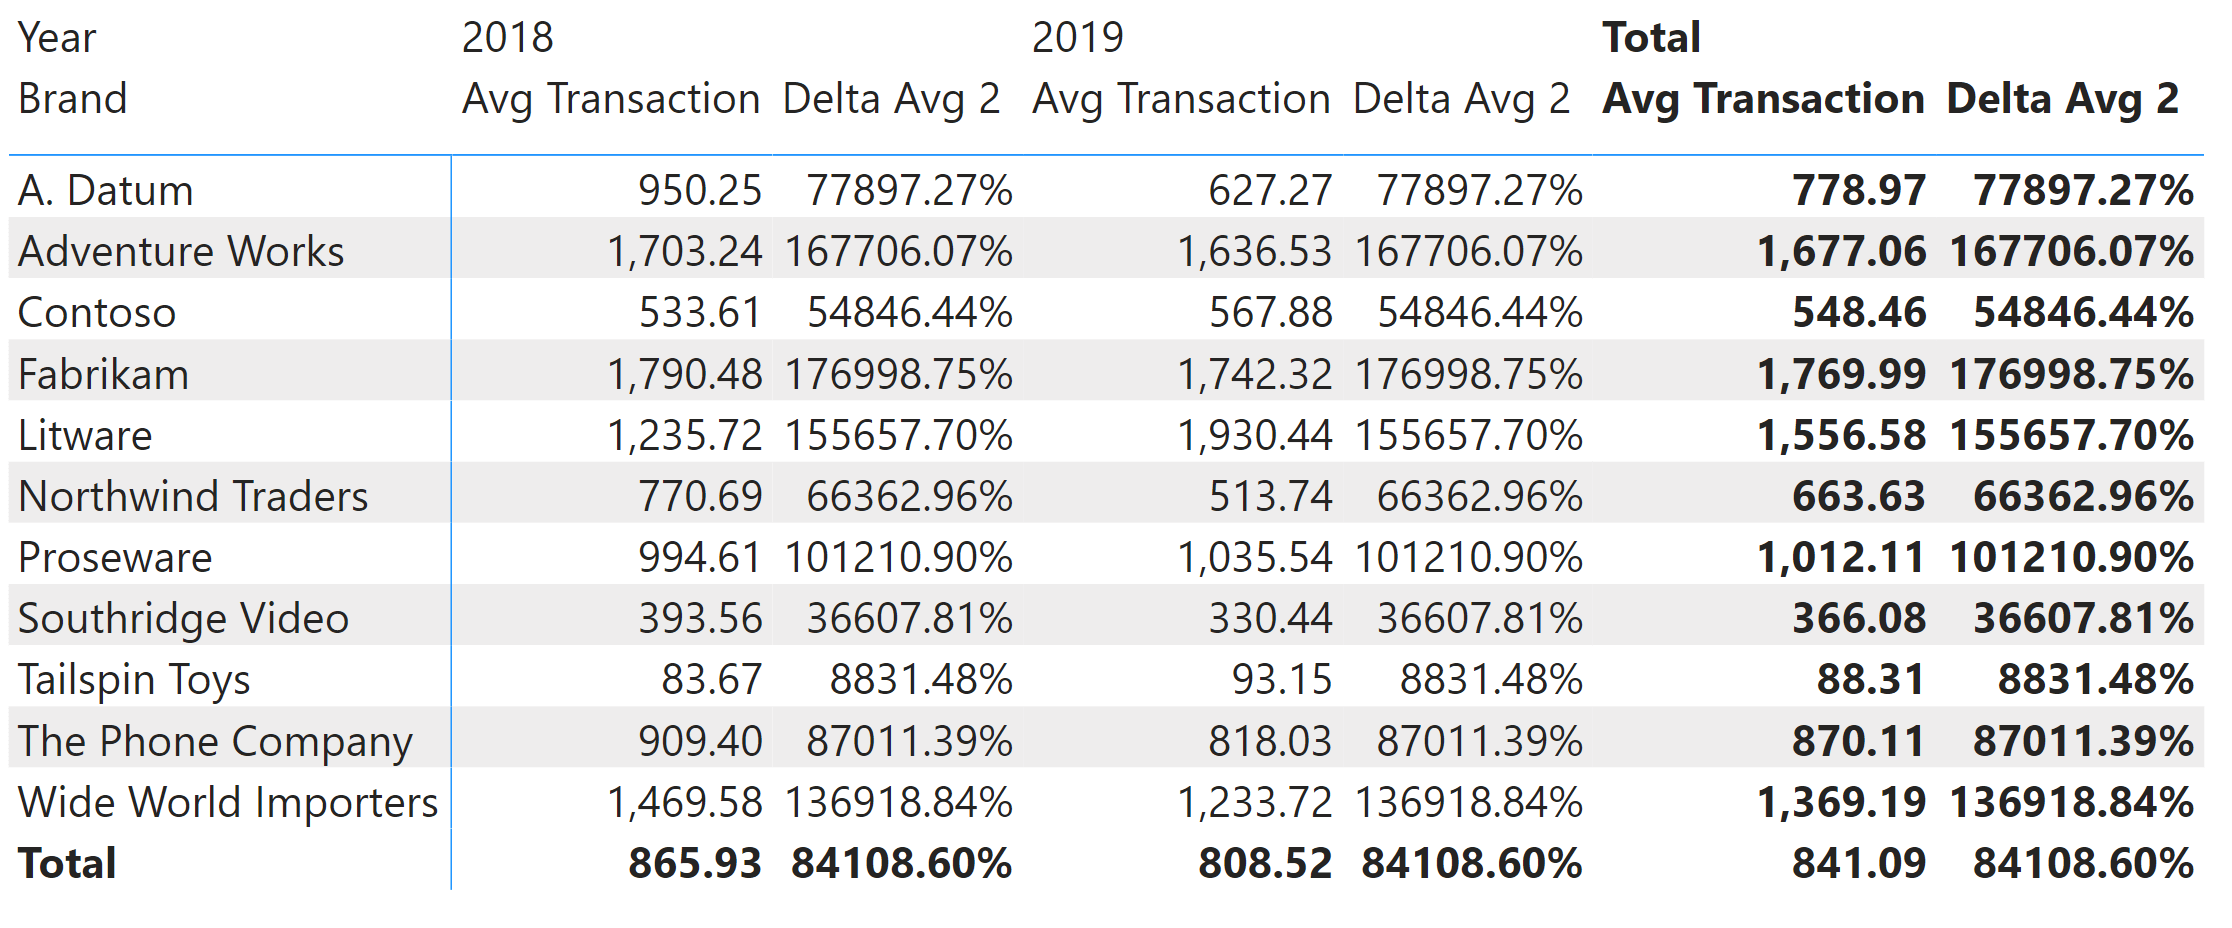
The value displayed by Delta Avg 2 is now different for every brand – but it repeats for each year, the value displayed by Avg Transaction for the Total of the selected years.
Now we restore the RETURN Result statement to get the correct result:
Delta Avg 2 :=
VAR CurrentValue = [Avg Transaction]
VAR ReferenceValue = CALCULATE ( [Avg Transaction], ALLSELECTED ( 'Date' ) )
VAR CurrentDelta = CurrentValue – ReferenceValue
VAR Result = DIVIDE ( CurrentDelta, ReferenceValue )
RETURN Result
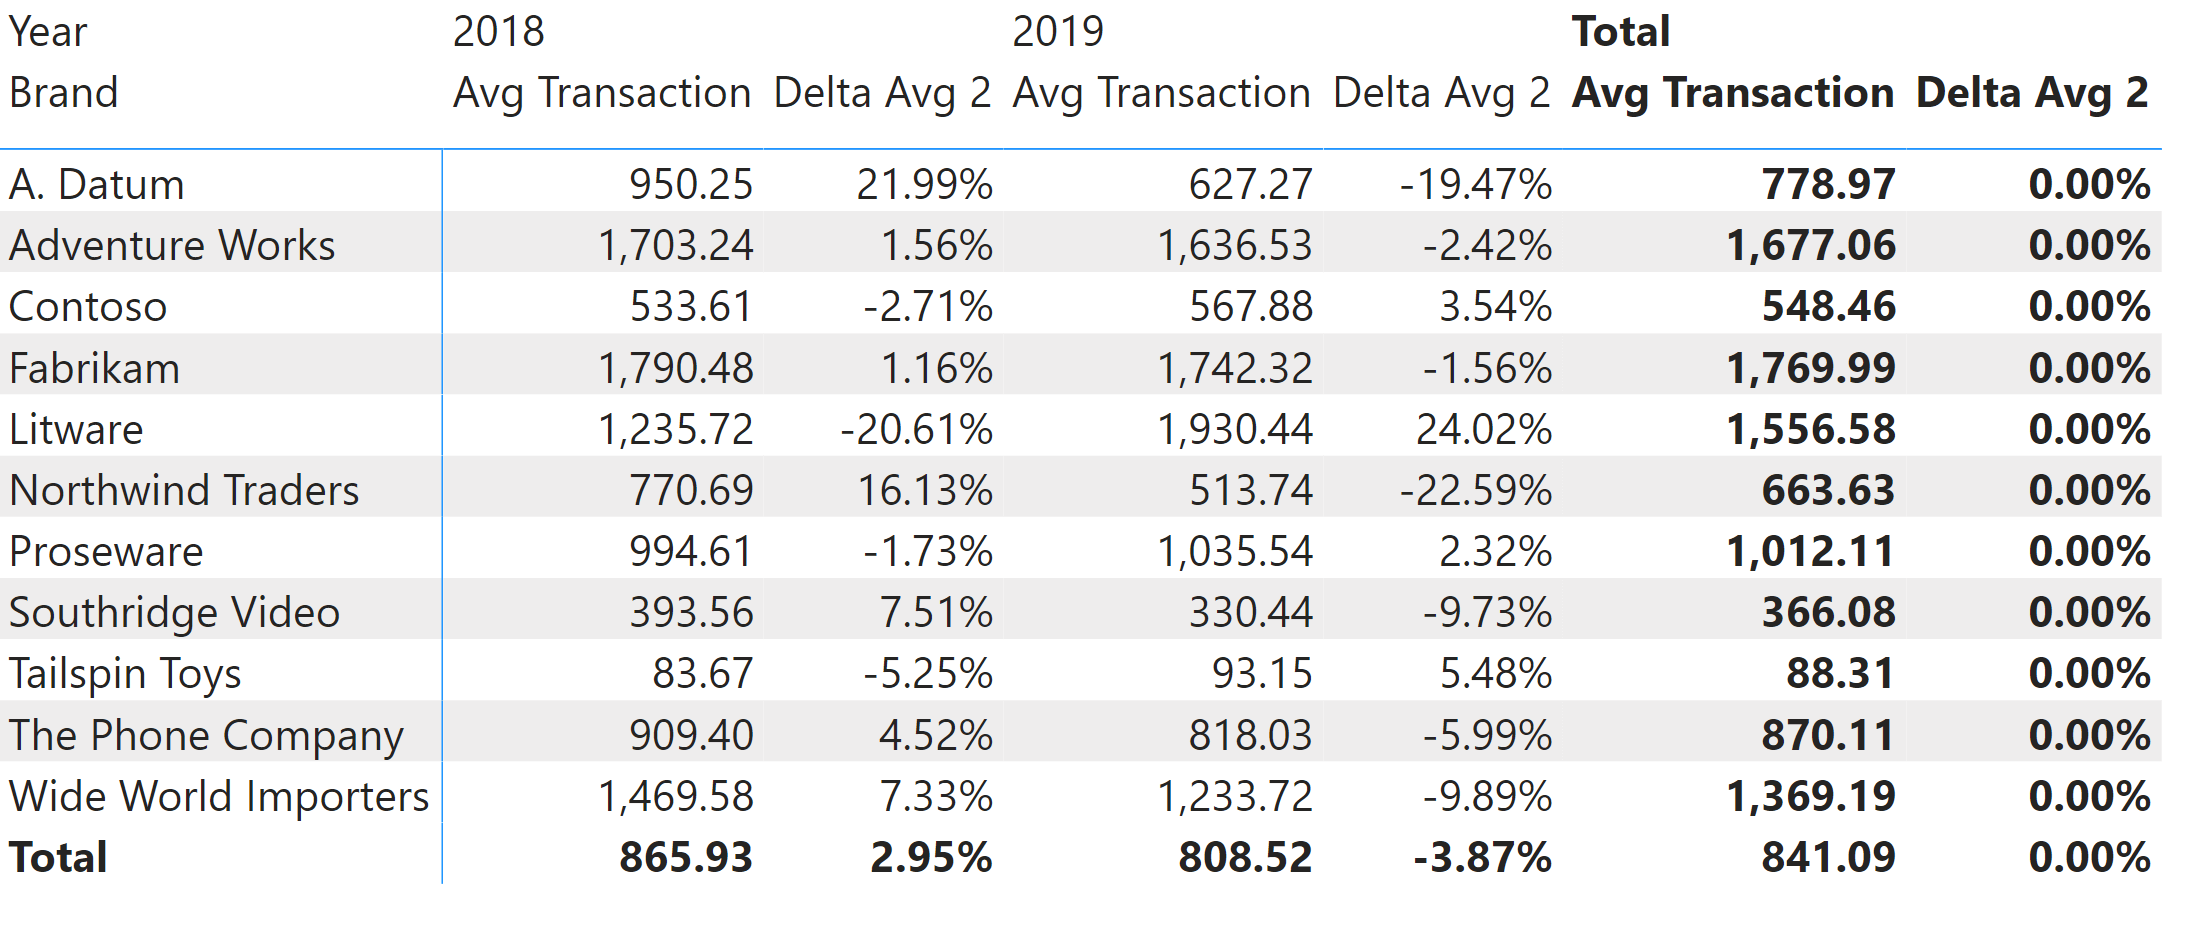
The report now works correctly, reporting 0% in the Total column for Delta Avg 2.
Using variables to debug DAX code does not require additional tools. What it does require is the manipulation of the DAX expression, to modify the result of the measure and thus inspect the intermediate step of a calculation in the report.
Debugging using DAX Studio
By using DAX Studio, we can run DAX queries and modify the query expression and the measure definition without touching the original model. This offers us some level of flexibility as it provides several options: we can capture the query generated for a visual by using the Performance Analyzer in Power BI and then run that query in DAX Studio with a local definition of the measure, also known as a query measure. The query measure is easy to change without the risk of altering the measures defined in the data model. We do not have to restore the original version of the modified measures once we identify the problem to fix, as we did in the previous section where we altered the measure in the model using variables.
This is the DAX query where we added the local definition of the Delta Avg 1 measure:
DEFINE
    ---- MODEL MEASURES BEGIN ----
    MEASURE Sales[Delta Avg 1] =
        DIVIDE (
            [Avg Transaction],
            CALCULATE ( [Avg Transaction], ALLSELECTED () )
        ) - 1
    ---- MODEL MEASURES END ----
    VAR __DS0FilterTable =
        TREATAS ( { 2018, 2019 }, 'Date'[Year] )
    VAR __DS0Core =
        SUMMARIZECOLUMNS (
            ROLLUPADDISSUBTOTAL ( 'Product'[Brand], "IsGrandTotalRowTotal" ),
            ROLLUPADDISSUBTOTAL ( 'Date'[Year], "IsGrandTotalColumnTotal" ),
            __DS0FilterTable,
            "Avg_Transaction", 'Sales'[Avg Transaction],
            "Delta_Avg_1", 'Sales'[Delta Avg 1]
        )
    VAR __DS0PrimaryWindowed =
        TOPN (
            102,
            SUMMARIZE ( __DS0Core, 'Product'[Brand], [IsGrandTotalRowTotal] ),
            [IsGrandTotalRowTotal], 0,
            'Product'[Brand], 1
        )
    VAR __DS0SecondaryBase =
        SUMMARIZE ( __DS0Core, 'Date'[Year], [IsGrandTotalColumnTotal] )
    VAR __DS0Secondary =
        TOPN ( 102, __DS0SecondaryBase, [IsGrandTotalColumnTotal], 1, 'Date'[Year], 1 )
    VAR __DS0BodyLimited =
        NATURALLEFTOUTERJOIN (
            __DS0PrimaryWindowed,
            SUBSTITUTEWITHINDEX (
                __DS0Core,
                "ColumnIndex", __DS0Secondary,
                [IsGrandTotalColumnTotal], ASC,
                'Date'[Year], ASC
            )
        )

EVALUATE
__DS0Secondary
ORDER BY
    [IsGrandTotalColumnTotal],
    'Date'[Year]

EVALUATE
__DS0BodyLimited
ORDER BY
    [IsGrandTotalRowTotal] DESC,
    'Product'[Brand],
    [ColumnIndex]
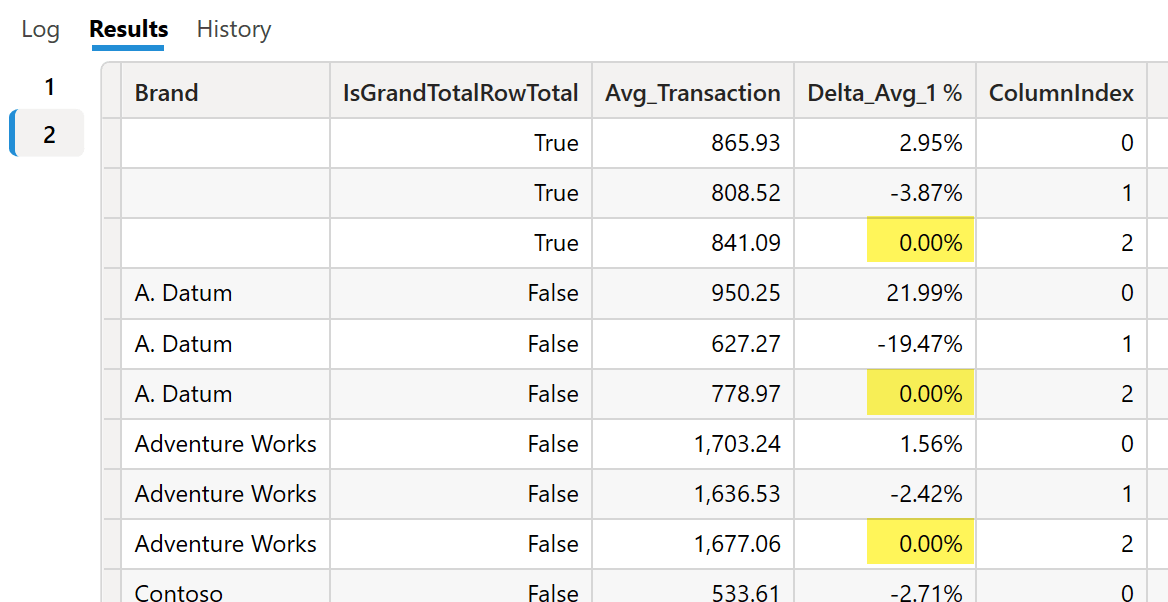
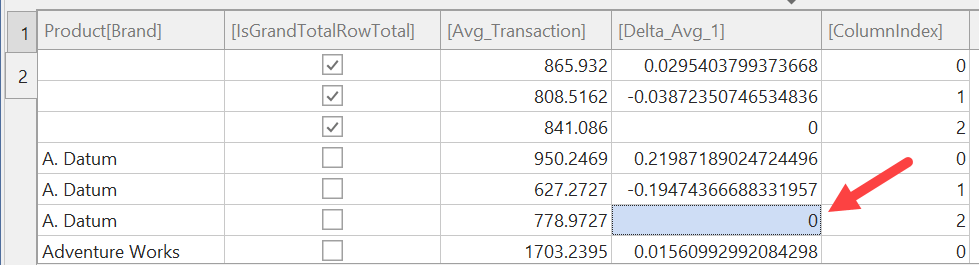
The result of a DAX query does not correspond to the visual layout of a Power BI matrix: every data point in the visual corresponds to a different row in the result of the DAX query. Therefore, each matrix row corresponds to three rows in the query result, one for each matrix column (0 for 2018, 1 for 2019, and 2 for Total).
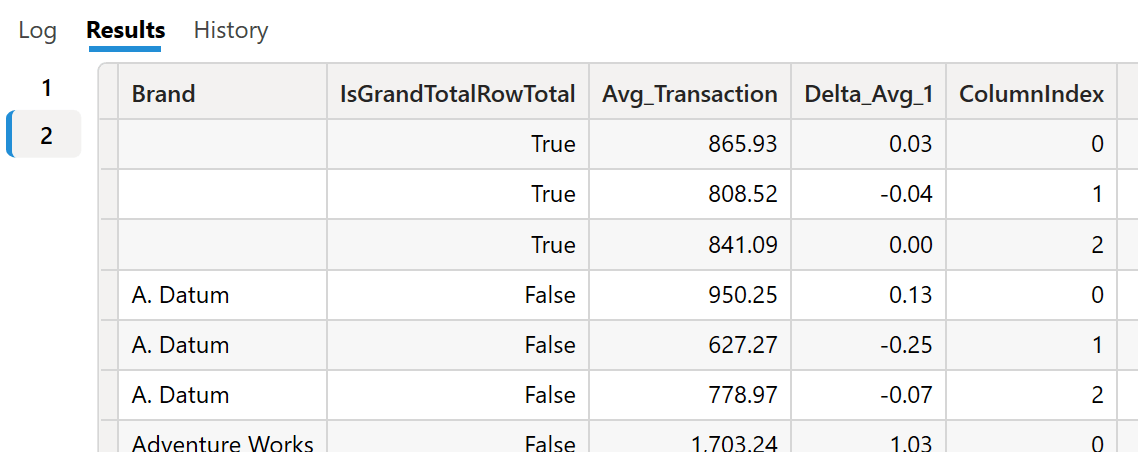
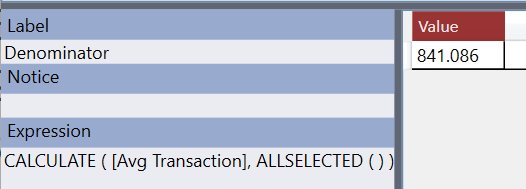
We can modify the definition of the Delta Avg 1 query measure so that it returns only the denominator used by DIVIDE:
    ---- MODEL MEASURES BEGIN ----
    MEASURE Sales[Delta Avg 1] =
//        DIVIDE (
//            [Avg Transaction],
            CALCULATE ( [Avg Transaction], ALLSELECTED () )
//        ) - 1
    ---- MODEL MEASURES END ----
By re-running the query, we can see that the result of Delta Avg 1 is the same for all the rows, regardless of brand and year (the year corresponds to ColumnIndex).
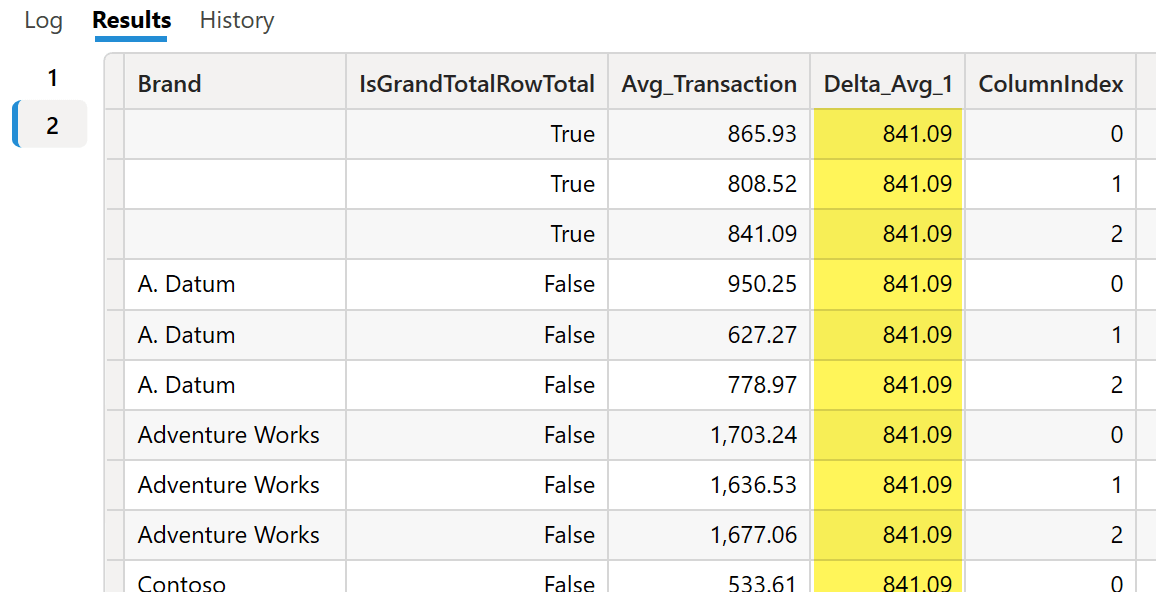
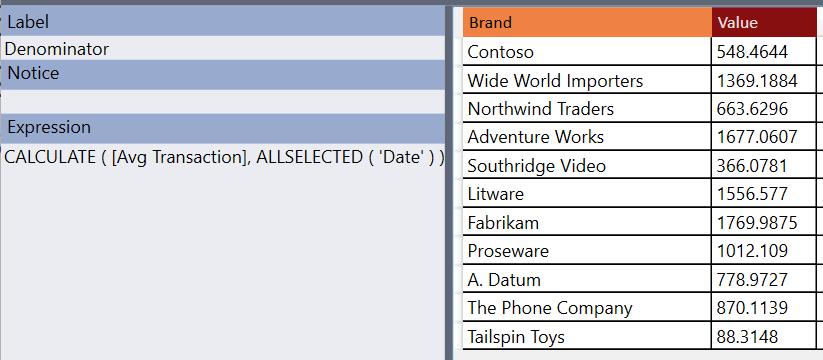
Once we identify that ALLSELECTED is not working as we want – it should provide the same value for a brand regardless of the year but different values for different brands – we fix the ALLSELECTED function by providing the Date table as argument:
---- MODEL MEASURES BEGIN ----
MEASURE Sales[Delta Avg 1] =
// DIVIDE (
// [Avg Transaction],
CALCULATE ( [Avg Transaction], ALLSELECTED ( 'Date' ) )
// ) - 1
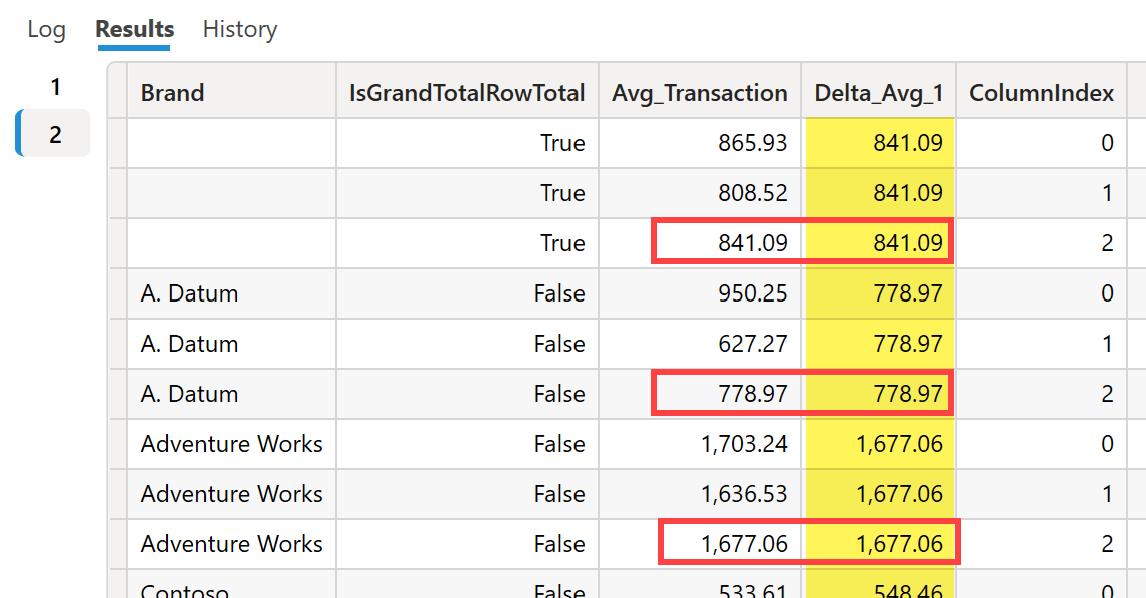
---- MODEL MEASURES END ----
This version of the measure provides the proper denominator for our ratio, which is a copy of the value returned for ColumnIndex 2 and corresponds to the total column in the Power BI matrix visual.
We can now uncomment the lines in Delta Avg 1 that we previously commented when analyzing the denominator:
---- MODEL MEASURES BEGIN ----
MEASURE Sales[Delta Avg 1] =
DIVIDE (
[Avg Transaction],
CALCULATE ( [Avg Transaction], ALLSELECTED ( 'Date' ) )
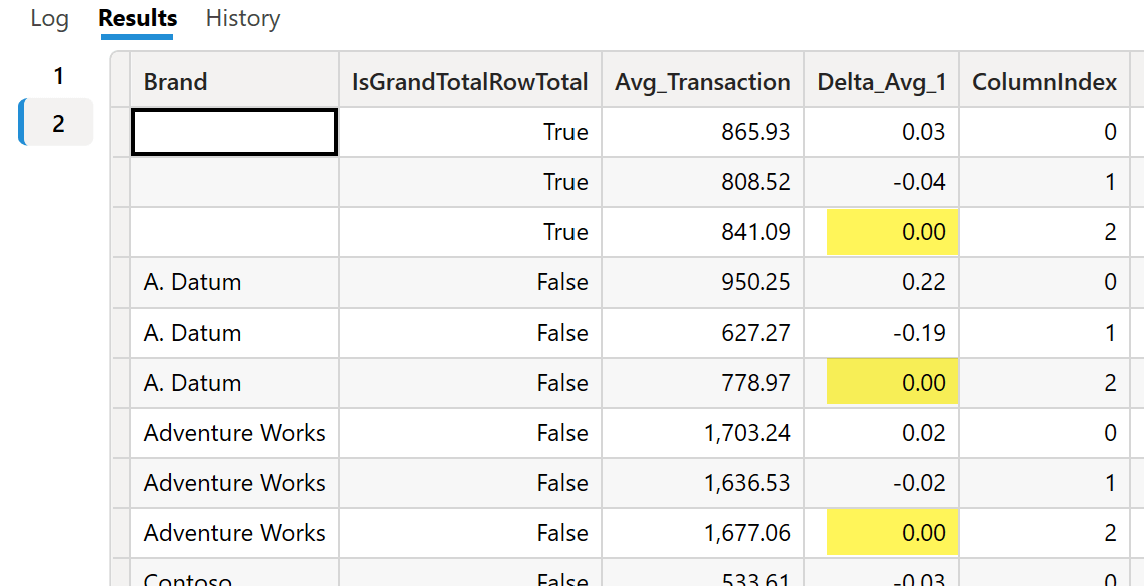
) - 1
---- MODEL MEASURES END ----
The result is now correct – the number is displayed as a floating point instead of a percentage because DAX Studio does not use the measure format. The number must be zero for Total of selected years, corresponding to ColumnIndex equal to 2.
You can enforce the visualization as a percentage in DAX Studio by renaming the column – line 17 of the DAX query – and using the % symbol as part of the column name.
Once we validate the measure in DAX Studio, we still have to apply the changes to the measure definition in Power BI Desktop. Indeed, DAX Studio cannot alter the structure and data of the model being analyzed.
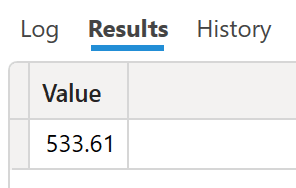
By using ALLSELECTED, we had to use a SUMMARIZECOLUMNS to keep the shadow filter context used by ALLSELECTED in the report. When you are not dealing with such a specific requirement, it could be easier to use DAX Studio to evaluate a measure for a single cell. For example, the following code evaluates the Avg Transaction measure for the Contoso brand in 2018:
EVALUATE
CALCULATETABLE (
    {
        [Avg Transaction]
    },
    'Date'[Year] = 2018,
    'Product'[Brand] = "Contoso"
)
The result is a table with a single row and column. You can alter the table constructor syntax (lines 3-5) to return more measures computed in the same filter context.
Debugging using EVALUATEANDLOG
The EVALUATEANDLOG function returns the argument being passed to the function, logging that value in the evaluation log. You need an external tool to display the DAX evaluation log: at the time of writing, you can use SQL Server Profiler or DAX Debug Output, which is the tool used in this article. A future version of DAX Studio may also include a specific feature to display the DAX evaluation log.
We can use a second optional argument, which can be a label to identify the expression passed to EVALUATEANDLOG. The DAX evaluation log includes that label if specified. In the following example, we applied the Numerator and Denominator labels to the two arguments of DIVIDE in the Delta Avg 3 measure:
Delta Avg 3 :=
DIVIDE (
    EVALUATEANDLOG ( [Avg Transaction], "Numerator" ),
    EVALUATEANDLOG ( CALCULATE ( [Avg Transaction], ALLSELECTED ( ) ), "Denominator" )
) - 1
We start capturing all following evaluations by opening the DAX Debug Output external tool and connecting it to the Power BI Desktop instance with our report. Ideally, you would open DAX Debug Output before switching to page Demo 3 in the sample report. If you have already switched to that page, you can repeat the query and see the DAX evaluation log by clicking the “Refresh visuals” link in the Performance Analyzer pane. The following picture shows the result of refreshing the Demo 3 page, which uses our Delta Avg 3 measure.
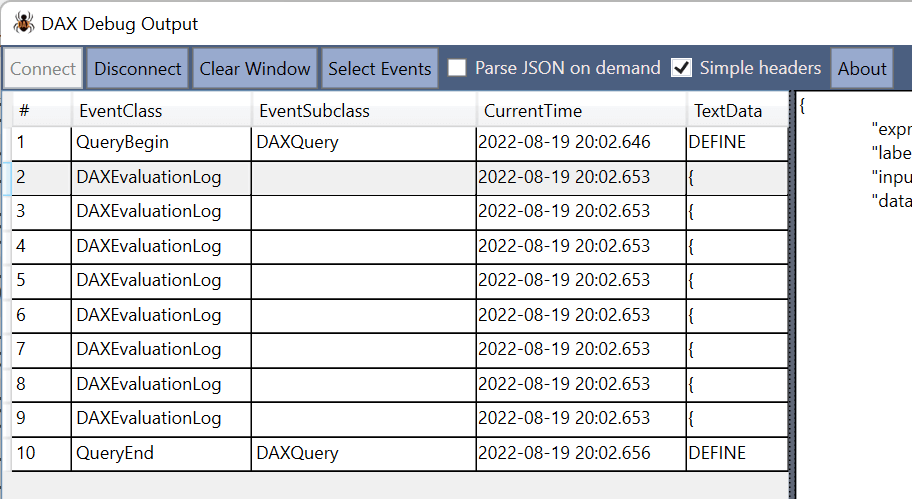
The evaluation log displays one line for each EVALUATELOG executed at each level of granularity of the visual. Indeed, there are four possible levels of granularity in the matrix:
- Group by Year and Brand
- Group by Year
- Group by Brand
- Grand Total
Because each level of granularity has two EVALUATEANDLOG functions in Delta Avg 3, there is a total of eight rows with DAXEvaluationLog. By clicking on each line, in the lower pane you see the content returned by EVALUATEANDLOG. For example, the detail for the first DAXEvaluationLog row includes the result of Delta Avg 3 grouped by Brand and Year for the Numerator label.
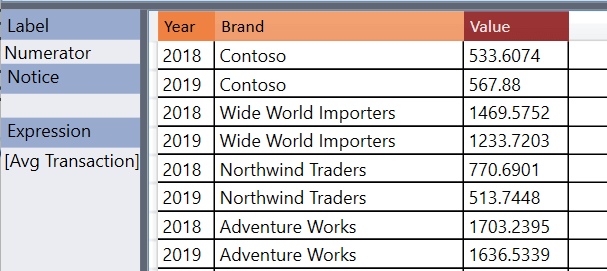
You might be surprised by this content: after all, EVALUATEANDLOG was called by providing the Avg Transaction measure reference as an argument, and you see a table as a result. However, because the measure is evaluated for each combination of Year and Brand displayed in the visual, the EVALUATEANDLOG function groups all these evaluations in a single log entry. This choice also corresponds to how the DAX engine computes the results, as it groups the evaluation of measures with the same granularity into one single step for performance reasons.
It is now time to discover the second DAXEvaluationLog row. We expect to see the result of Delta Avg 3 grouped by Brand and Year for the Denominator label. However, what we see seems slightly different because there is a single value without any grouping.
We see this single value because the evaluated CALCULATE expression removes all the grouping columns using the ALLSELECTED modifier. For this reason, the result is always the same for lines 3, 5, 7, and 9 displayed in DAX Debug Output. Regardless of the grouping expected, the evaluation always occurs in a single filter context that does not change based on the grouping applied to the report. After all, this is exactly what ALLSELECTED is supposed to do: remove all the grouping filters applied – in this case – by the SUMMARIZECOLUMNS function.
We can fix the formula by modifying ALLSELECTED. We want to remove the grouping filter only on columns of the Date table (such as Year), and keep in the filter context the grouping filters applied to other tables. We use ALLSELECTED ( Date ) to achieve this:
Delta Avg 3 :=
DIVIDE (
    EVALUATEANDLOG ( [Avg Transaction], "Numerator" ),
    EVALUATEANDLOG (
        CALCULATE ( [Avg Transaction], ALLSELECTED ( 'Date' ) ),
        "Denominator"
    )
) - 1
Denominator is now calculated for each brand instead of being a single value for all the brands. This is the expected behavior when the Delta Avg 3 measure is grouped by Year and Brand: divide the value of a particular year and brand by the brand’s value for all the years selected.
By using EVALUATEANDLOG, we can see any intermediate step of a calculation. However, how the data is displayed reflects the way data is computed in blocks depending on the different granularities involved in each visual in the reports. While the EVALUATEANDLOG function can display the result on an intermediate step of a calculation, interpreting the values displayed requires a good understanding of how the DAX engine combines the result of a measure for the entire report. The intermediate calculation is not the value computed for a specific cell of the report; you must make that association by interpreting the result provided in the context of the report being executed.
Debugging using the DAX Debugger in Tabular Editor 3
Tabular Editor 3 comes with an integrated DAX Debugger feature that simplifies the analysis of the internal calculation happening in a DAX expression. While EVALUATEANDLOG shows an intermediate step of the internal execution engine – which usually does not correspond to the way we would compute a single cell in a linear manner – the approach taken by DAX Debugger is to recalculate a partial DAX expression so that we can evaluate step by step how the engine evaluates a single cell in a report.
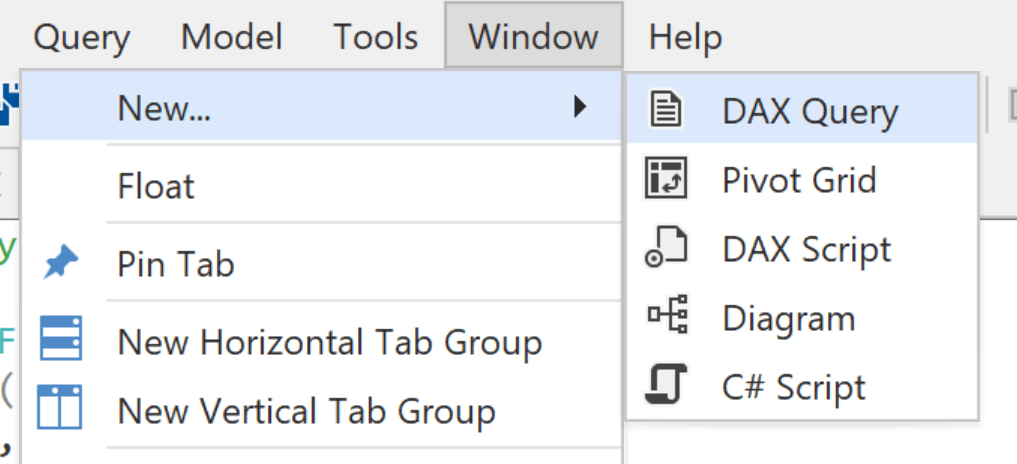
Because the DAX Debugger works at the DAX level regardless of the report tool that generates the request, we must start from a DAX query executing the measures. While you could use the Pivot Grid of Tabular Editor 3 as a starting point to debug a measure, we want to see how we can leverage DAX Debugger to analyze the Power BI report we used at the beginning. Thus, in Tabular Editor 3 we connect to the Power BI model and then create a new DAX Query window where we paste the DAX query captured with Performance Analyzer as we did for EVALUATEANDLOG earlier.
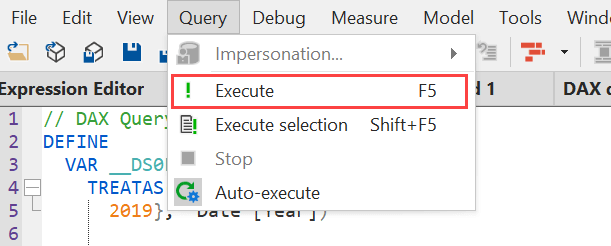
So in Power BI, activate the Performance Analyzer, go to Page 1 of the sample report, click on Refresh Visuals, copy the DAX query of the visual, and paste it into the DAX Query window. The following step is to execute the query (F5 is the shortcut for that).
Because the query includes two EVALUATE statements, we obtain two results. We select the second result to see the data used to populate the matrix in Power BI.
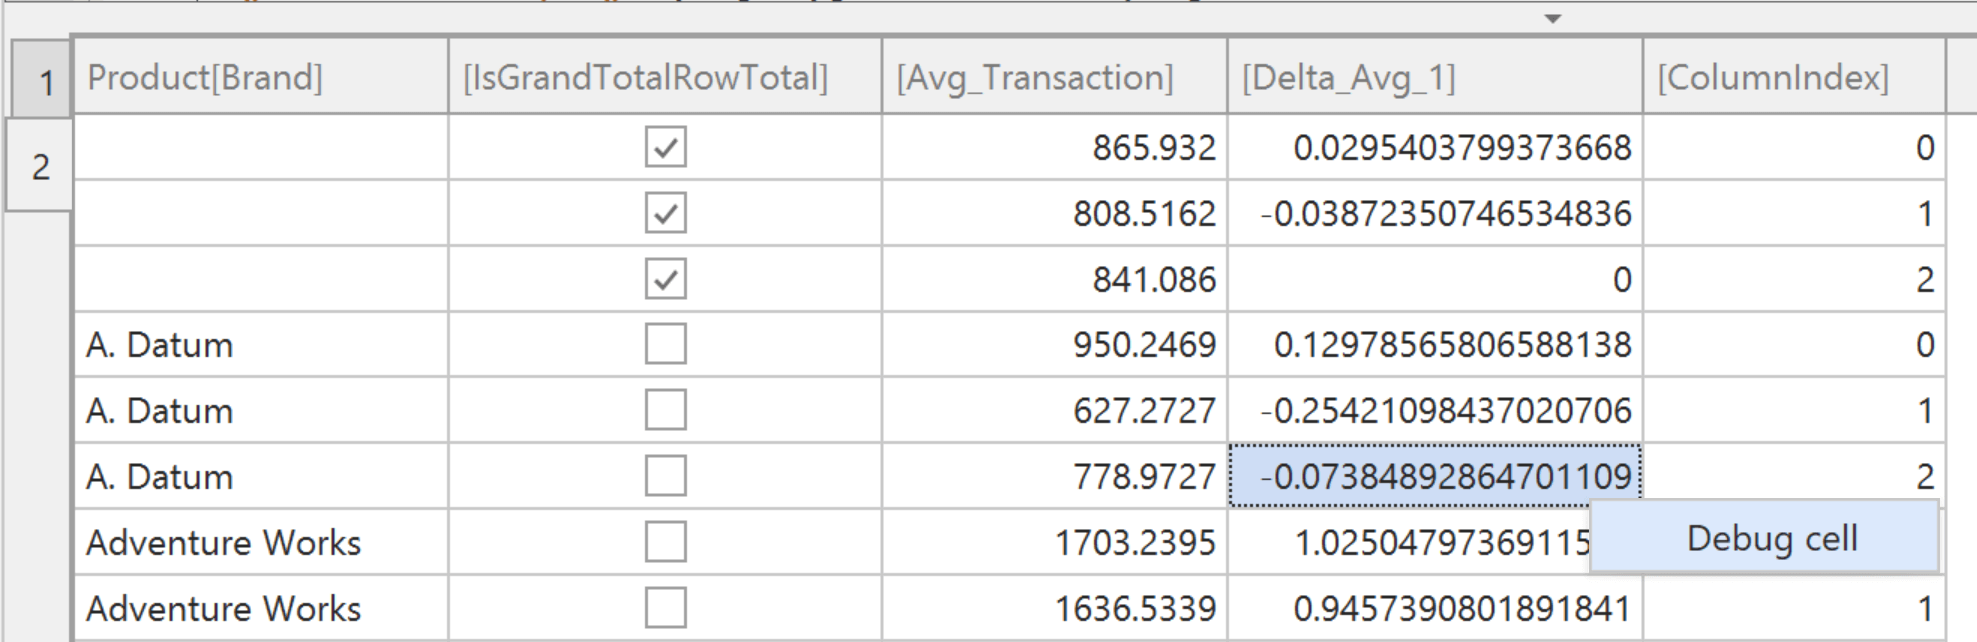
The cell selected in the previous screenshot is the value corresponding to the Total column of the Delta Avg 1 measure for the A. Datum brand. The value is -7.38% in the report, but it is displayed without the percentage notation in Tabular Editor. Using the right-click menu on that cell, we can invoke the DAX Debugger for that cell through the Debug cell menu item.
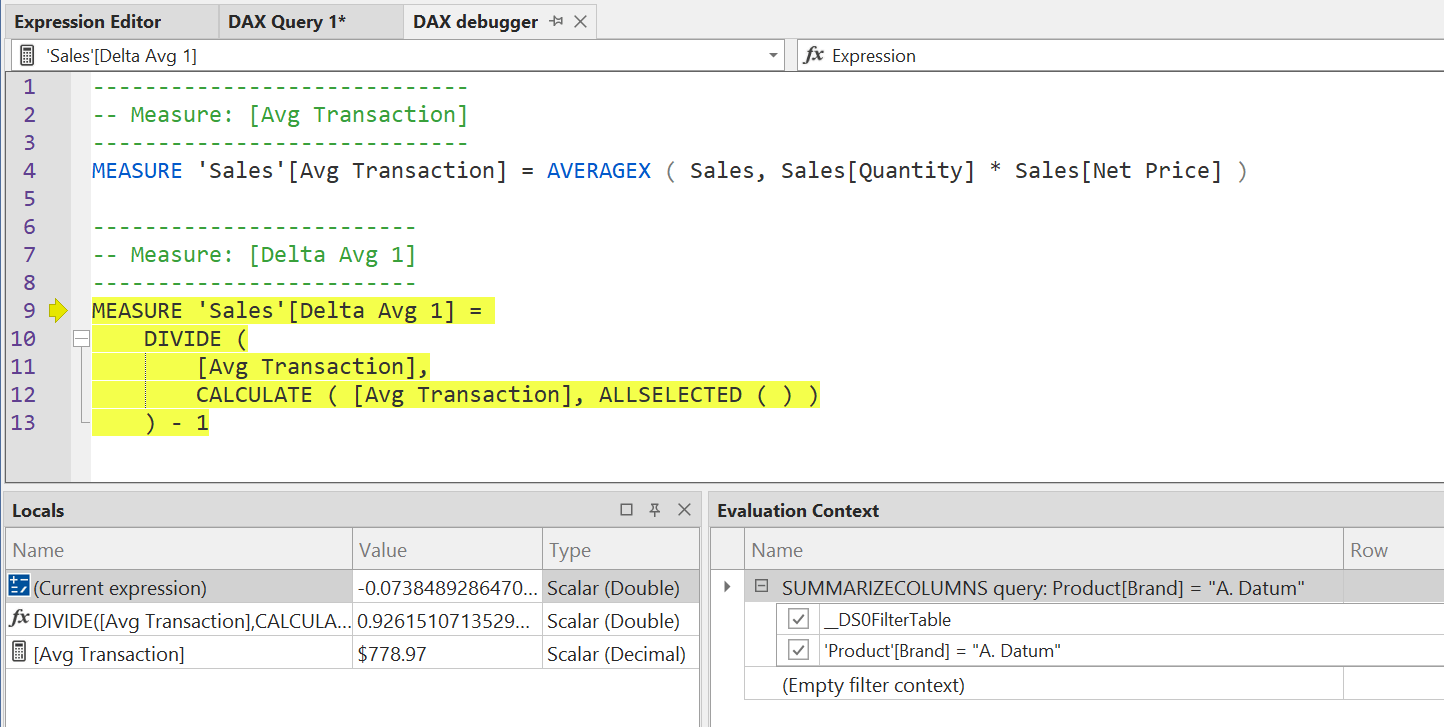
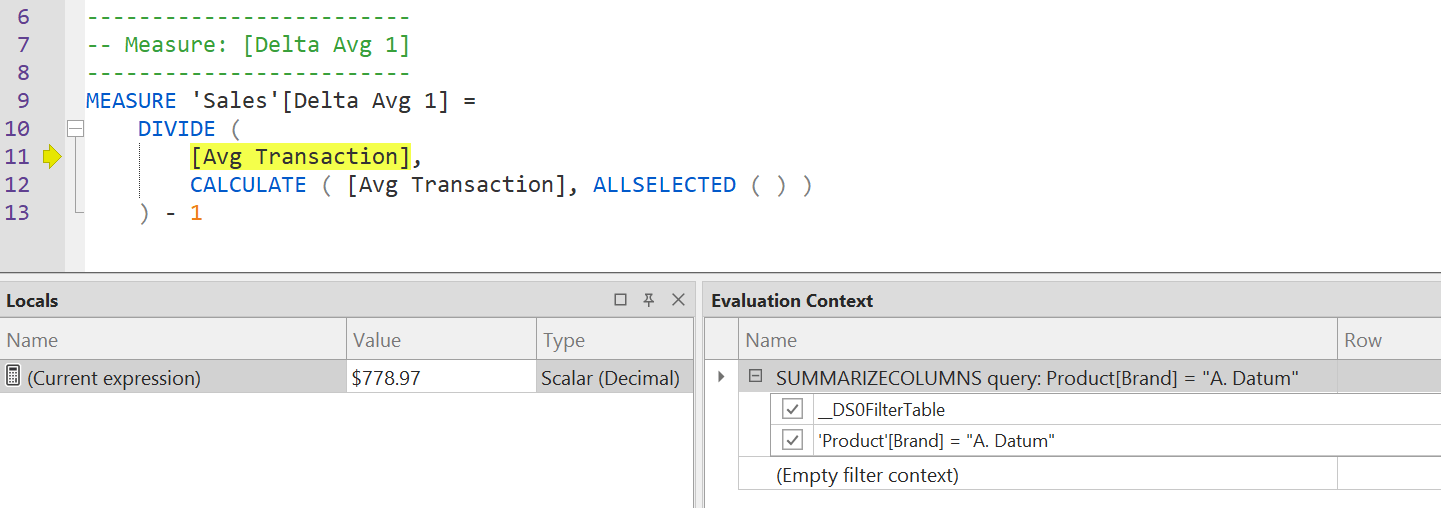
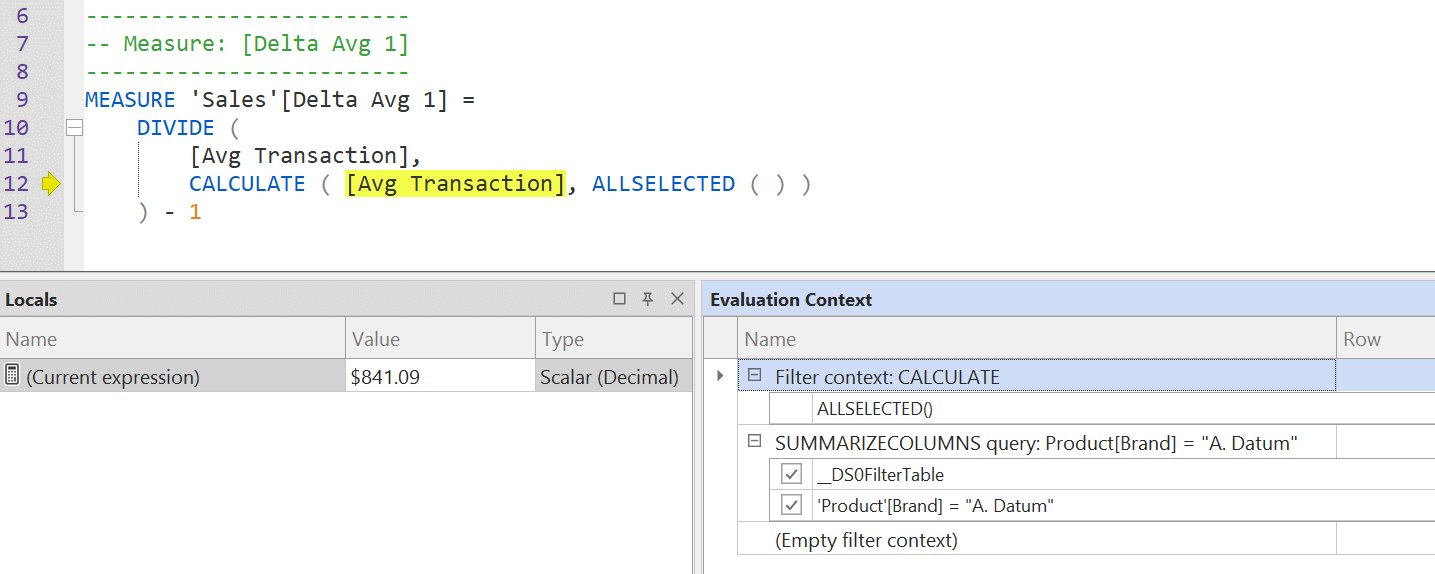
The initial debugger window shows the measures involved (Delta Avg 1 calls Avg Transaction) and the value returned by Delta Avg 1 in the cell. In the Evaluation Context window, we see the evaluation context used by the highlighted expression. In the Locals window, the (Current expression) row shows the result of the highlighted code in the current evaluation context. The following rows show the result of two expressions executed in the highlighted code: the DIVIDE expression and the Avg Transaction measure.
The Evaluation Context window shows the evaluation context in terms of the stack of filters applied. This means that the presence of a filter in the stack does not necessarily imply that this filter is actually active in the filter context, as a following directive in the stack might deactivate it. The Evaluation Context shows the innermost filter at the top of the list, and the outer filters follow in the list. Indeed, the outermost node is (Empty filter context). In the picture above, the SUMMARIZECOLUMNS node includes both the filter arguments (such as __DS0FilterTable) and the group-by columns (such as Product[Brand]).
The F11 shortcut “steps into” the execution. The first step highlights the entire expression included in the Delta Avg 1 measure.
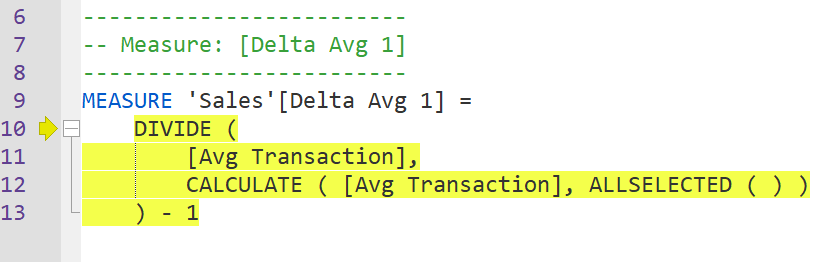
Another F11 shortcut highlights the first function in the measure, which is the entire DIVIDE function.
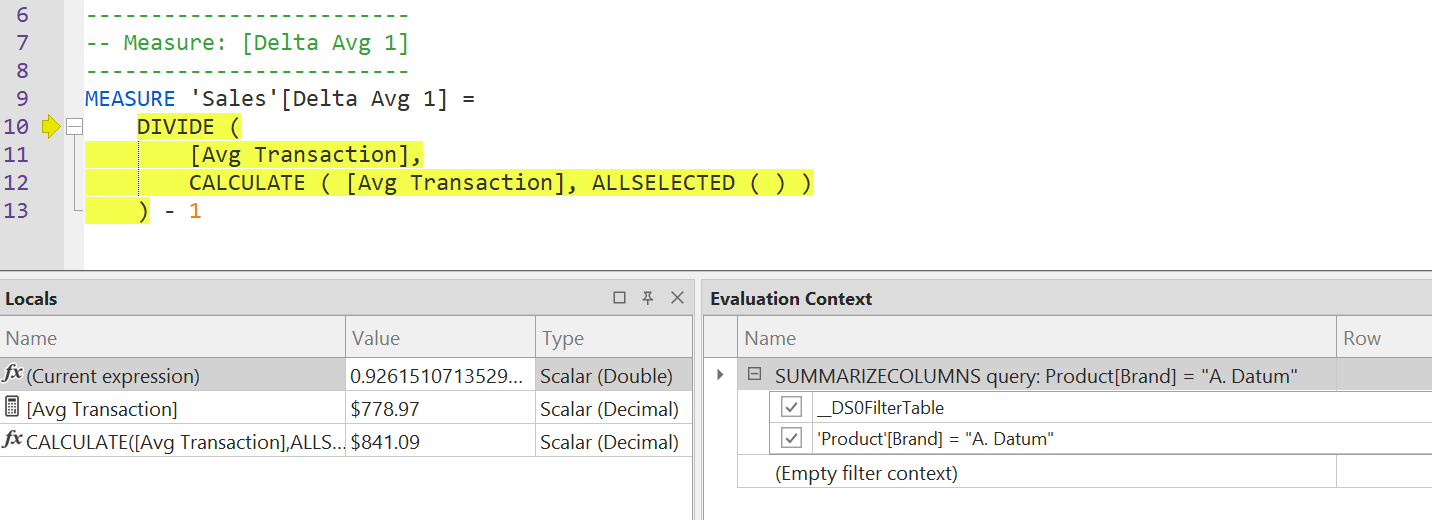
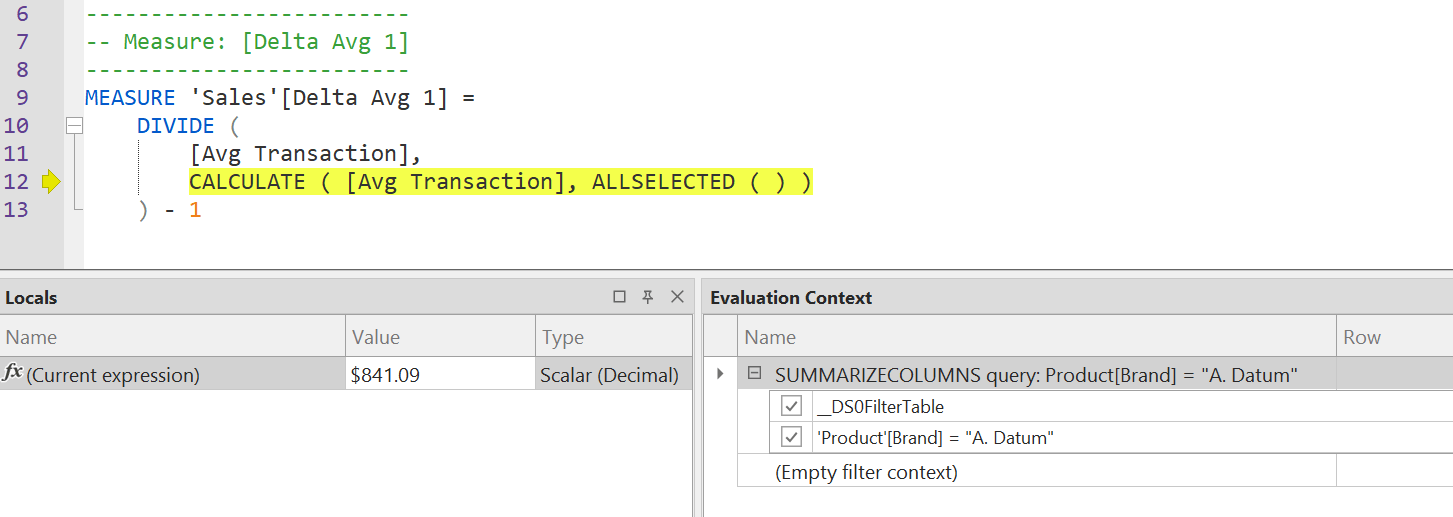
We have enough information in the Locals window to understand why the result of the Delta Avg 1 measure is not 100%. The (Current expression) row in Locals shows the result of DIVIDE; the second row shows the DIVIDE numerator result (Avg Transaction); the third row shows the DIVIDE denominator result, which is a different number (841.09). The number in the denominator is the same for all the brands; this is not visible at this point, but we see that it is a different number, and we want to understand how it was calculated.
So far, the content of the Evaluation Context window has not changed. Another Step Into (F11) action displays a different content in Evaluation Context.
The Locals window shows only the (Current Expression) result, which is the evaluation of Avg Transaction. The Evaluation Context window still shows the same evaluation context, which filters the A. Datum product brand. Because we are not interested in analyzing the internal calculation of Avg Transaction, we now use Step Over (F10) to skip the internal steps of this argument and move on to the next expression.
The result of (Current Expression) in the Locals window is now the same as the value we have seen in the second row of the Locals window from the beginning of our debugging section. Yet, the Evaluation Context is still the same. We want to see what happens during this evaluation because we do not understand why the result of Avg Transaction is different. We expected to also see the number we saw in the numerator, as the goal is to divide the amount by the average of all the years for the selected brand. It is time to use Step Into (F11) again.
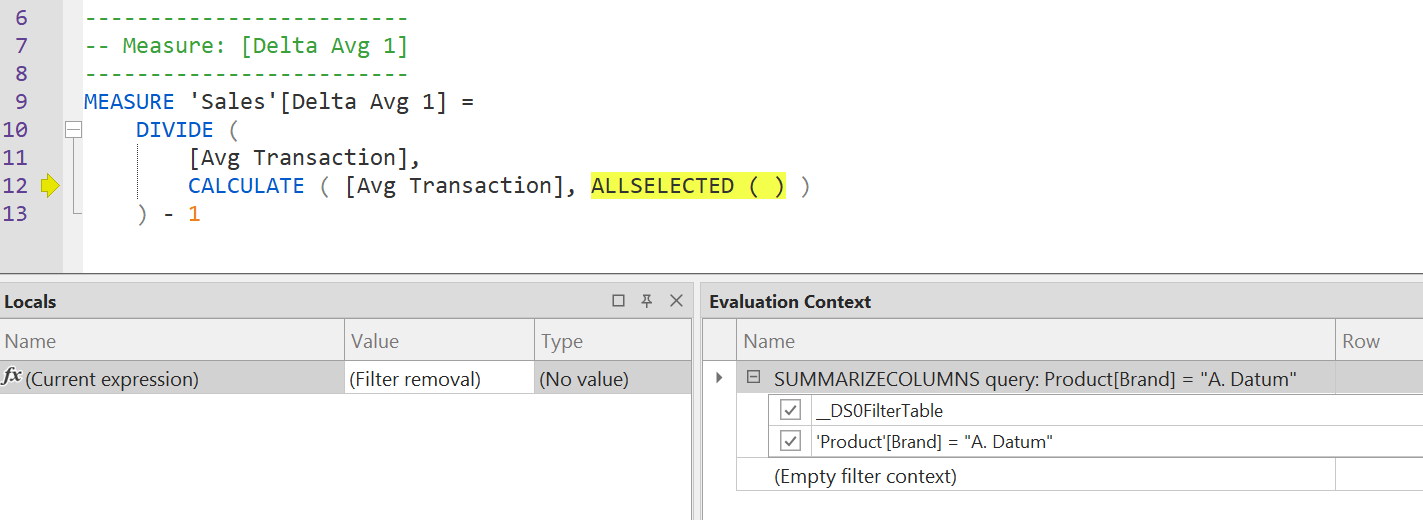
ALLSELECTED is evaluated before Avg Transaction. Because ALLSELECTED is a filter modifier, the (Current expression) row in the Locals window shows (Filter removal) as a result because a filter modifier does not return anything. We invoke Step Into (F11) again.
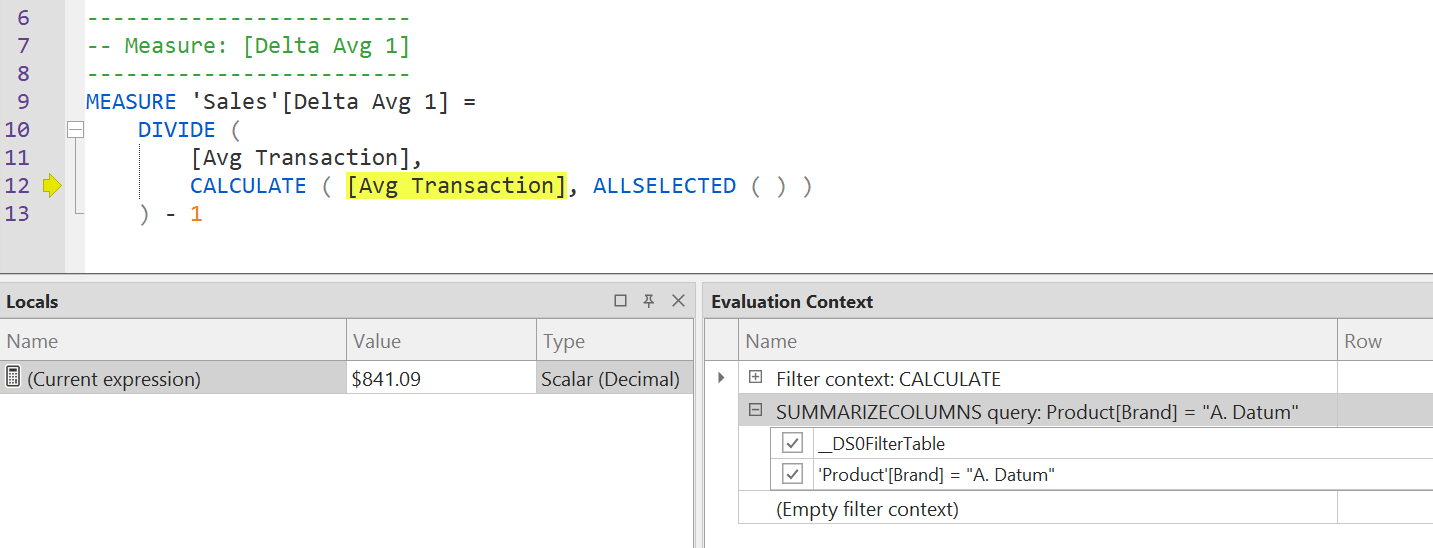
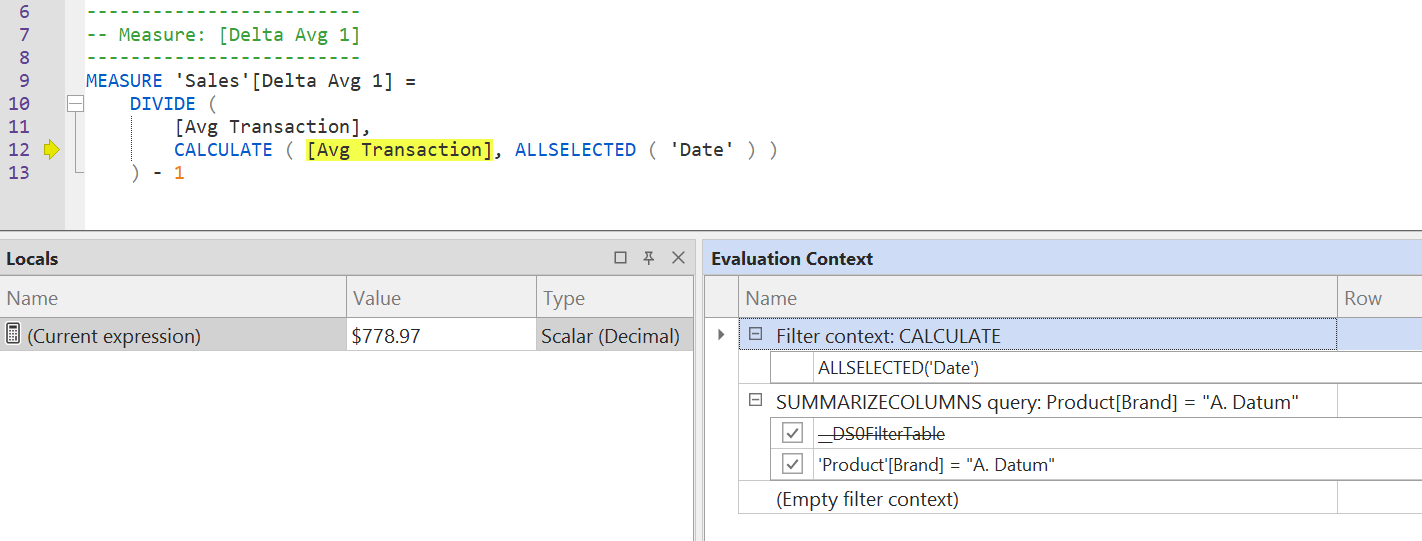
The evaluation context shows the entire stack of filters applied to the evaluation context. The first we see is the filter introduced by CALCULATE, which we should expand.
Once expanded, the filter context applies ALLSELECTED, which removes all the filters provided by SUMMARIZECOLUMNS. The two filters in SUMMARIZECOLUMNS should be struck through in the Evaluation Context window. But there is a bug in the version of Tabular Editor 3 we used to write this article (v3.4) . That bug should be fixed in an upcoming release. However, the checkboxes of the filter in SUMMARIZECOLUMNS can be used to figure out which of those filters are ignored by ALLSELECTED. For example, if we press Step Out (SHIFT+F11) twice, we go back to the step where the DIVIDE function was highlighted. In this visualization, we have numerator and denominator of DIVIDE in Locals, and we can uncheck the filters to find which filter is removed by ALLSELECTED so that Avg Transaction produces the same result in the second and third row of the Locals window.
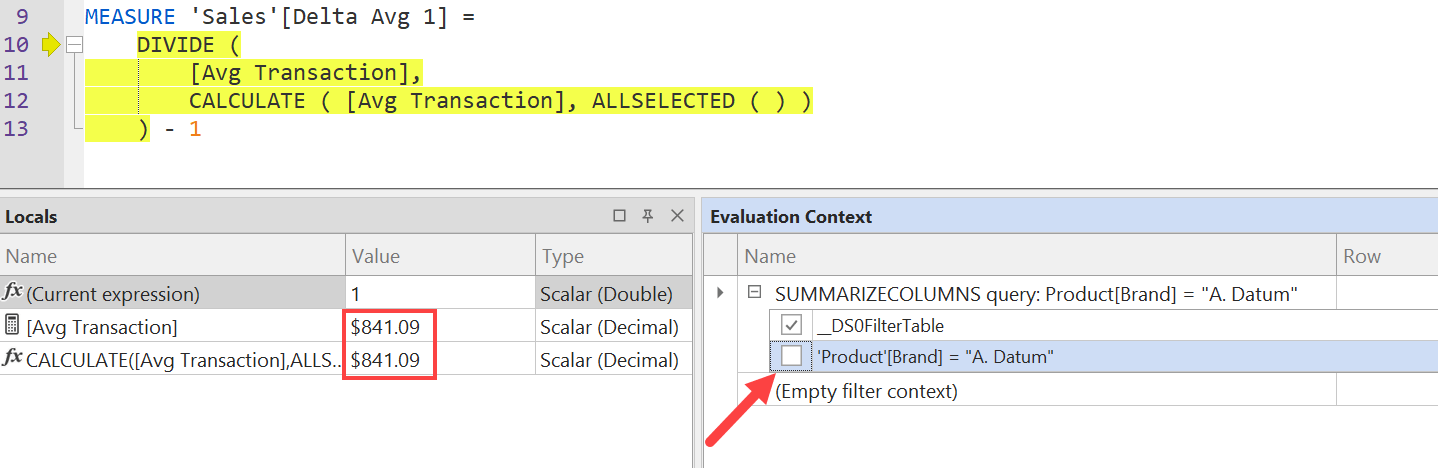
Indeed, by removing the filter on Product Brand in the Evaluation Context, we see that the result of Avg Transaction (second row in Locals) is the same as the result of CALCULATE with ALLSELECTED (third row in Locals). This means that ALLSELECTED is removing the filter from Product[Brand], which is not what we wanted. Our goal was to remove only the filter on Date by using ALLSELECTED ( ‘Date’ ), as we did in the Delta Avg 2 measure in the example with the variables.
By using Tabular Editor 3, we can close the Debugger window and modify the code of Delta Avg 1.
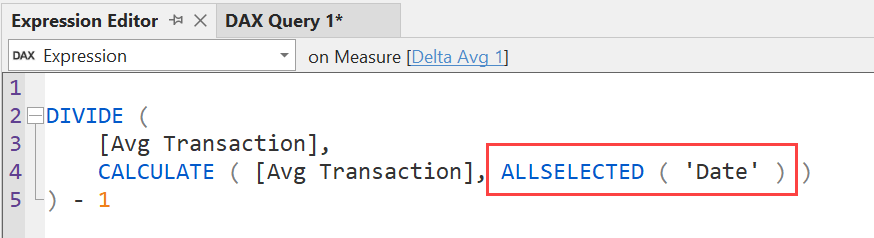
We save the code and go back to the DAX Query window, where the result is now correct.
We can also see the changed content of the Evaluation Context window while executing the DIVIDE denominator expression.
The __DS0FilterTable filter corresponds to the filter on Date[Year] defined in the initial part of the DAX query to implement the filter pane selection of years 2018 and 2019:
// DAX Query
DEFINE
  VAR __DS0FilterTable =
    TREATAS ( {2018, 2019}, 'Date'[Year] )
The DAX Debugger in Tabular Editor 3 is a very advanced tool to evaluate partial expressions in a complex report while keeping track of the filter context applied. Even though we used several screenshots to show the process, navigating back and forth in the execution steps is extraordinarily efficient and productive.
Conclusions
Structuring your code by using variables that can easily be replaced in the last line of a measure is an easy way to quickly view the intermediate results of a measure without needing an external tool. When the issue involves multiple levels of nested measures, this simple approach might not be productive, and you might need to spend time creating test reports to investigate the evaluation of inner measures.
DAX Studio offers an alternative to modifying the model: you can modify the code locally in query measures and move the fixed measure back to the original model only after having tested the code in different queries. While this technique does not modify reports and data models during the investigation, it requires the skills to manipulate a DAX query in order to control the result.
DAX Debug Output is an external tool to display the result of EVALUATEANDLOG, which is a DAX function that displays the intermediate step of a calculation. In order to use EVALUATEANDLOG you must modify the DAX code of your measures and remember to remove EVALUATEANDLOG function calls after your investigation, because these functions slow down the execution of the report. Moreover, the output produced by EVALUATEANDLOG requires a deeper understanding of how the engine computes a measure for the entire report, making it more difficult to understand the execution logic step by step.
Tabular Editor 3 is the only tool providing a real DAX Debugger experience that allows you to execute the code step by step, while also displaying the Evaluation Context for each execution step. While techniques do exist to display the active filter context at any given point, Tabular Editor 3 is the gold standard in term of productivity, as it provides within seconds pieces of information that might require hours to collect in more complex reports.
While Tabular Editor 3 is the best tool available to investigate calculation issues, every technique described in this article comes with pros and cons. We continue to use variables and DAX Studio daily. In contrast, EVALUATEANDLOG is useful to investigate the internal behavior of the engine or to display the content of an intermediate temporary table used in a measure; but it does not accelerate the investigation as the other techniques do, at least in more common cases.
Returns all the rows in a table, or all the values in a column, ignoring any filters that might have been applied inside the query, but keeping filters that come from outside.
ALLSELECTED ( [<TableNameOrColumnName>] [, <ColumnName> [, <ColumnName> [, … ] ] ] )
Safe Divide function with ability to handle divide by zero case.
DIVIDE ( <Numerator>, <Denominator> [, <AlternateResult>] )
Create a summary table for the requested totals over set of groups.
SUMMARIZECOLUMNS ( [<GroupBy_ColumnName> [, [<FilterTable>] [, [<Name>] [, [<Expression>] [, <GroupBy_ColumnName> [, [<FilterTable>] [, [<Name>] [, [<Expression>] [, … ] ] ] ] ] ] ] ] ] )
Return the value of the first argument and also log the value in DAX evaluation log.
EVALUATEANDLOG ( <Value> [, <Label>] [, <MaxRows>] )
Evaluates an expression in a context modified by filters.
CALCULATE ( <Expression> [, <Filter> [, <Filter> [, … ] ] ] )