 Marco Russo & Alberto Ferrari
Many article ideas come from questions we receive from our customers and readers, and this article is no exception. The requirement is to analyze the sales volume before and after a selected time period, to a specific customer segment. In this case we define the segment as the brand that the customers have purchased in the past. For example, considering the customers who purchased Contoso-branded products in February 2018, what is the Sales Amount of Contoso and other products sold to those same customers 180 days before and after February 2018?
This scenario is a variation of the Like-for-like comparison pattern, where we consider a subset of customers that have performed transactions in a given time period. We identify the customer by using Customer[Name], so you can easily modify the formula and use another Customer attribute as your target – for example Customer[City].
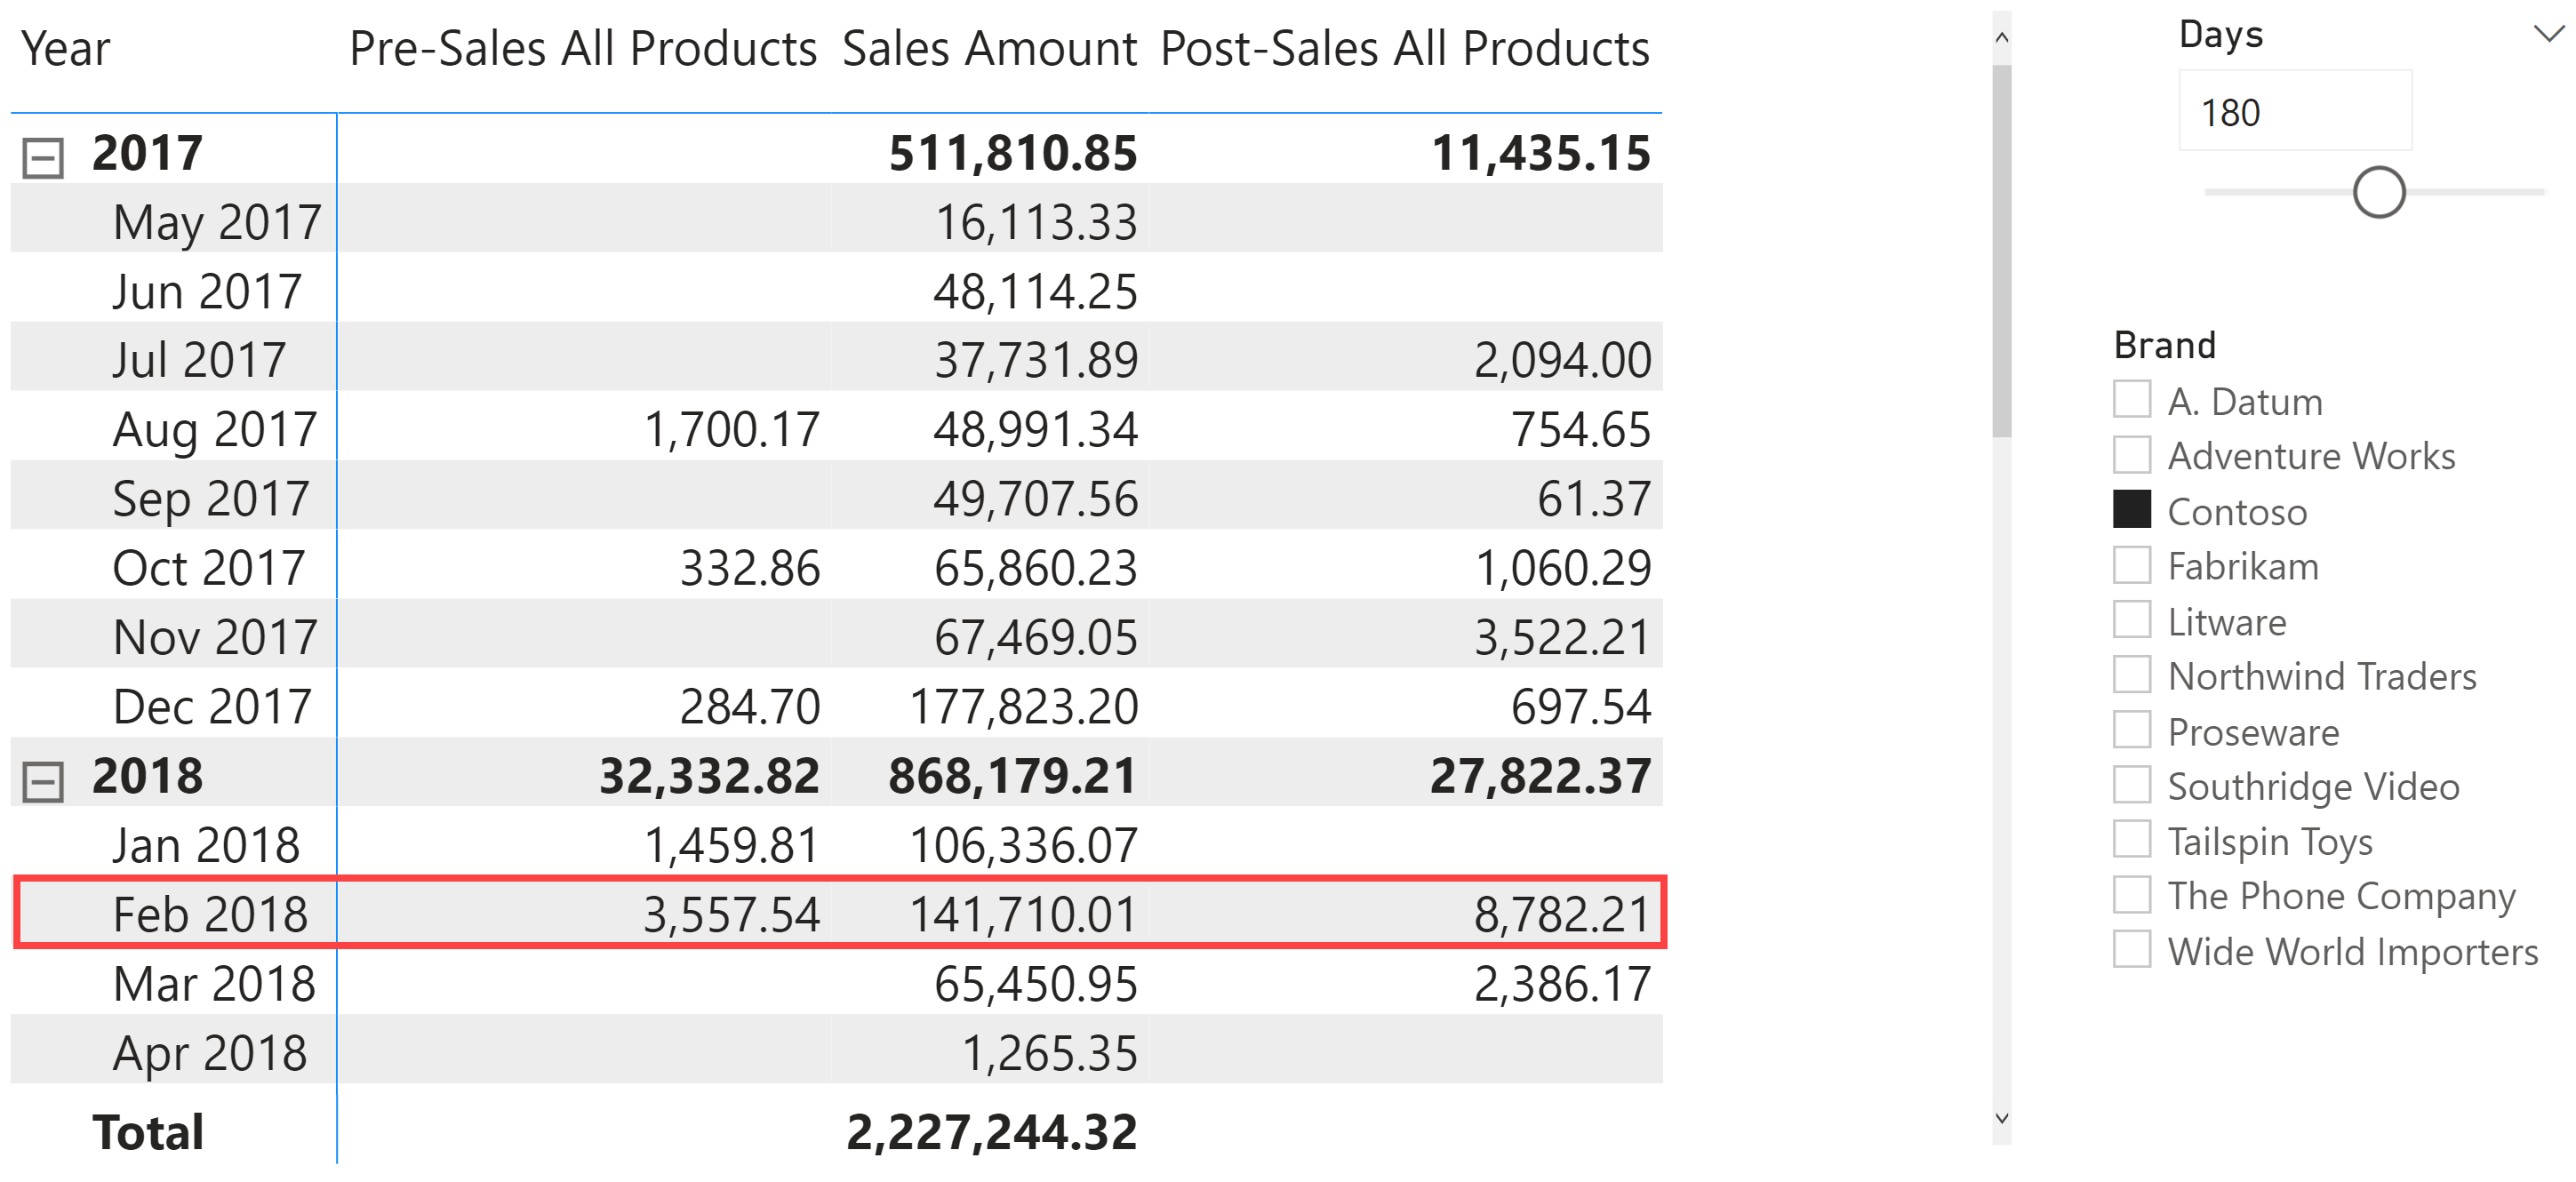
The first goal is to obtain the result displayed below. We see Pre-Sales All Products, which shows the Sales Amount measure evaluated over all the products in the 180 days before the time period considered on the rows, only for customers purchasing Contoso products within the period considered on the rows. Similarly, Post-Sales All Products shows the Sales Amount measure computed with the same criteria in the 180 days following the time period displayed on the rows. The Days slicer is a parameter used to modify the length of the pre- and post- durations we want to look at.
The Pre-Sales All Products measure removes the Brand filter by using REMOVEFILTERS ( Product ) and replaces the filter on Customers in order to use only the customers that have transactions in Sales. This filter replacement is accomplished by removing any customer filter with REMOVEFILTERS ( Customer ) and applying the filter only on Customer[Name] with the TargetCustomer variable; the latter is evaluated considering the Contoso brand filter. The DATESBETWEEN function filters the 180 days before the selected period:
Pre-Sales All Products :=
VAR FirstDateOfPeriod = MIN ( 'Date'[Date] )
VAR PeriodDays = [Days Value]
VAR TargetCustomers =
    SUMMARIZE ( Sales, Customer[Name] )
VAR FilterPeriod =
    DATESBETWEEN (
        'Date'[Date],
        FirstDateOfPeriod - PeriodDays,
        FirstDateOfPeriod - 1
    )
VAR Result =
    CALCULATE (
        [Sales Amount],
        REMOVEFILTERS ( 'Product' ),
        REMOVEFILTERS ( Customer ),
        TargetCustomers,
        FilterPeriod
    )
RETURN Result
The Post-Sales All Products measure displays few differences from Pre-Sales All Products, because it only changes how the DATESBETWEEN filter is evaluated:
Post-Sales All Products :=
VAR LastDateOfPeriod = MAX ( 'Date'[Date] )
VAR PeriodDays = [Days Value]
VAR TargetCustomers =
    SUMMARIZE ( Sales, Customer[Name] )
VAR FilterPeriod =
    DATESBETWEEN (
        'Date'[Date],
        LastDateOfPeriod + 1,
        LastDateOfPeriod + PeriodDays
    )
VAR Result =
    CALCULATE (
        [Sales Amount],
        REMOVEFILTERS ( 'Product' ),
        REMOVEFILTERS ( Customer ),
        TargetCustomers,
       FilterPeriod
    )
RETURN Result
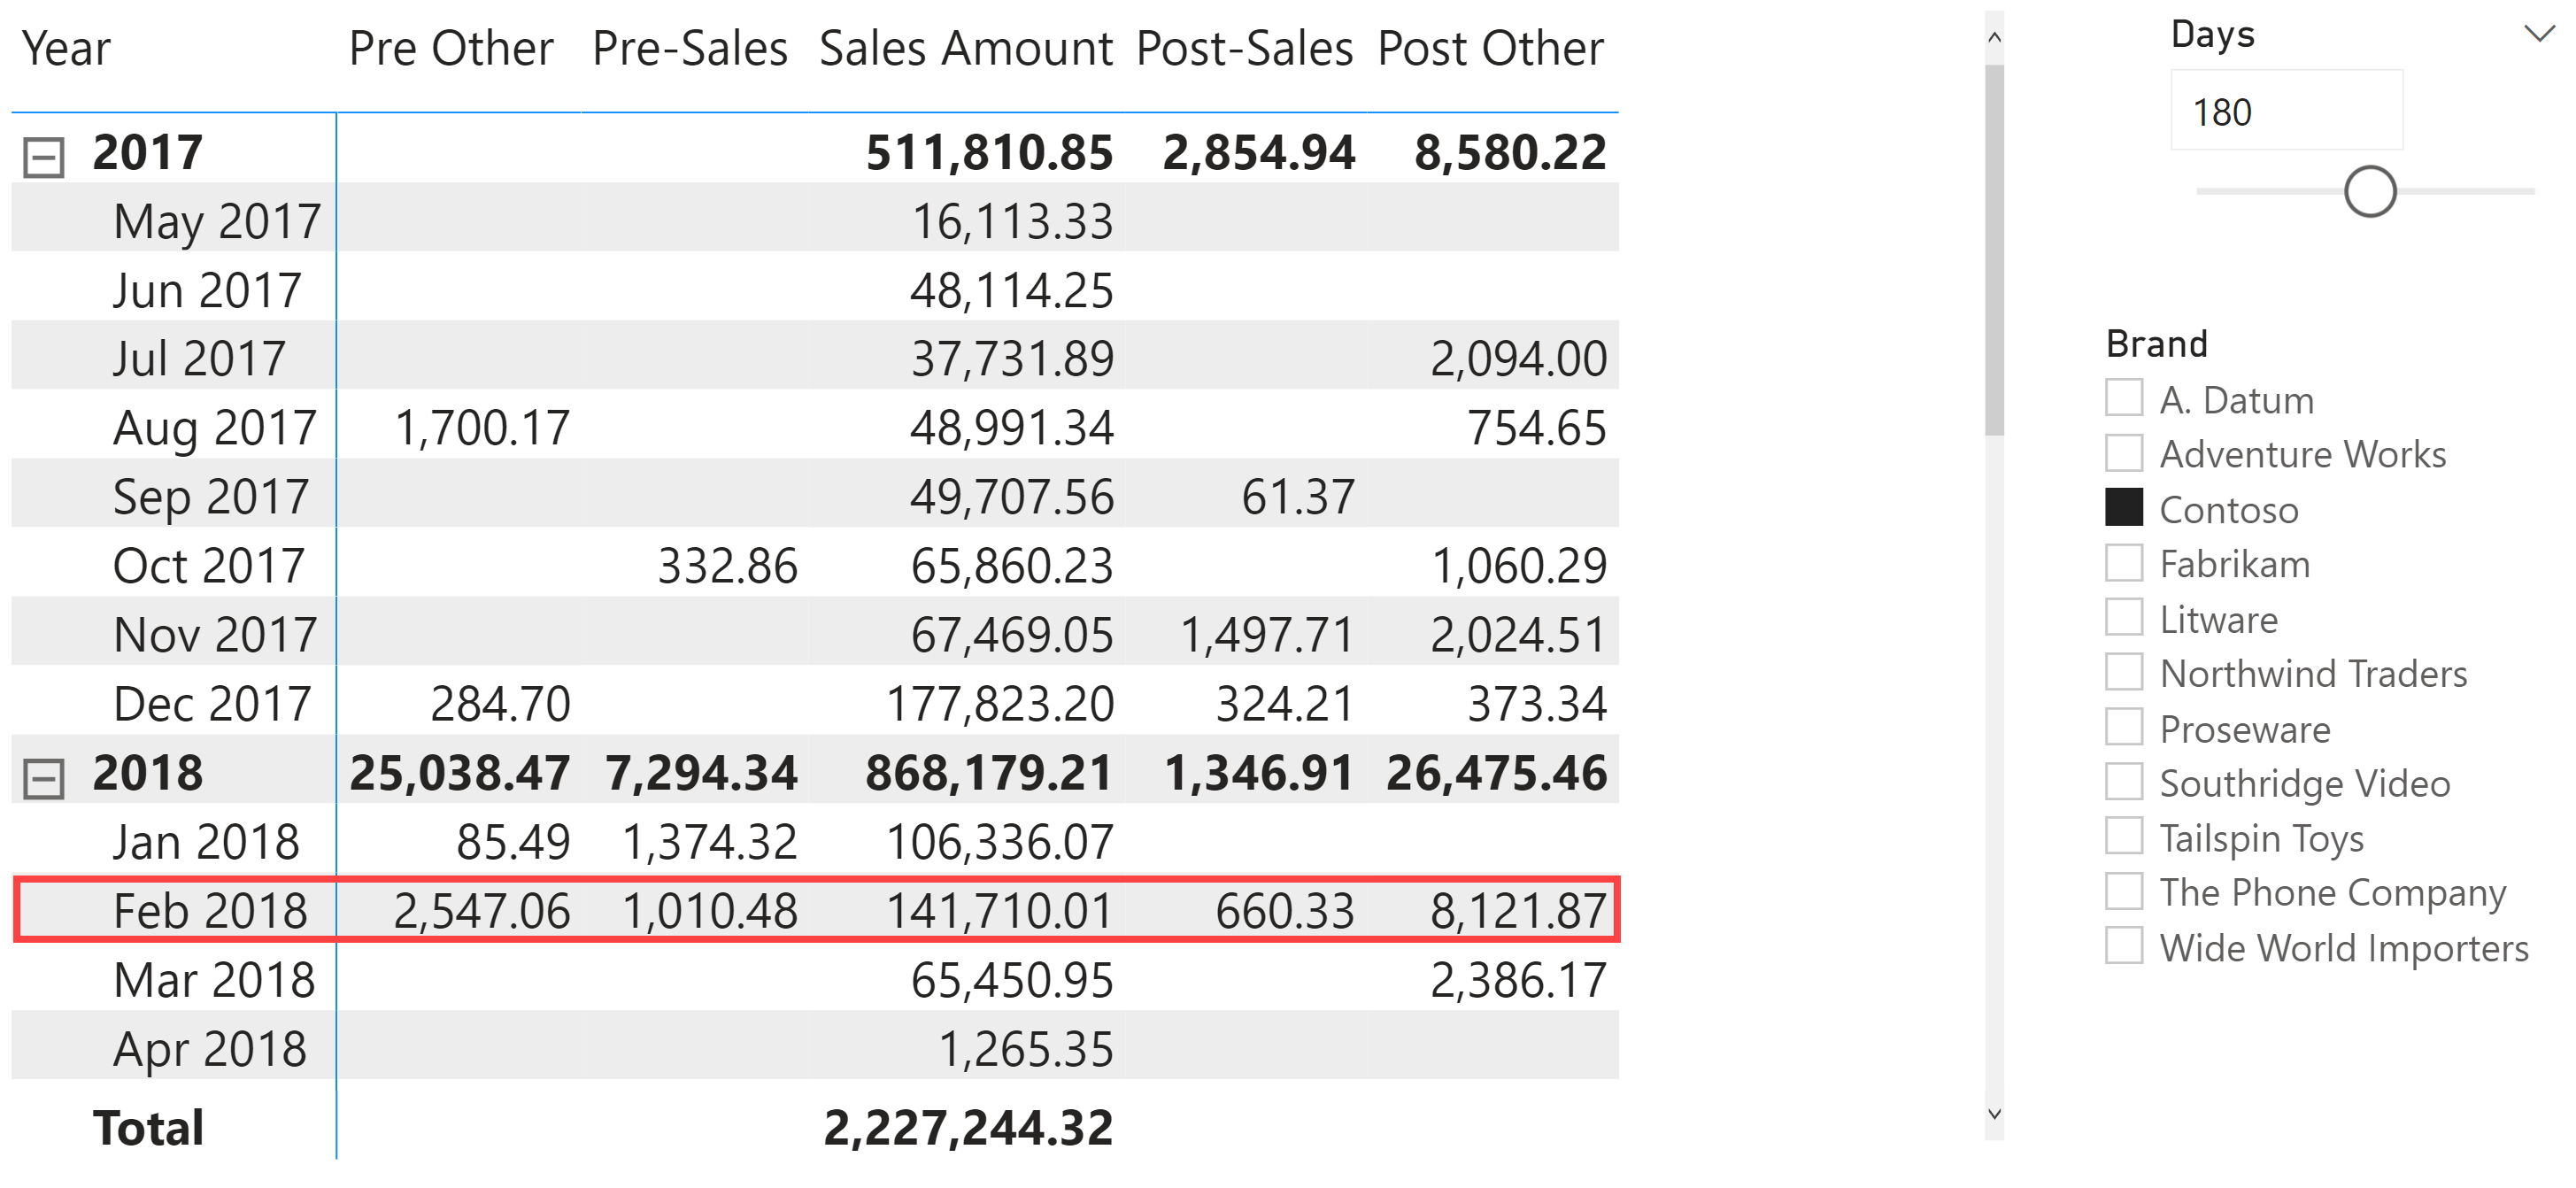
An additional requirement can be to display pre- and post- sales, and also split these values between sales of the brand selected for Sales Amount and sales of other brands, pooled together. In the following example, Pre Sales shows the sales in the previous 180 days of the brand selected in the slicer for Sales Amount. The Pre Other column shows the Pre-Sales Other Products measure, which computes the difference between Pre-Sales All Products and Pre-Sales.
The Pre-Sales measure is almost identical to Pre-Sales All Products: the only difference is that we no longer apply REMOVEFILTERS ( ‘Product’ ) to remove the filter over Product, so Pre-Sales returns the sales in the previous 180 days only for Contoso branded products:
Pre-Sales :=
VAR FirstDateOfPeriod = MIN ( 'Date'[Date] )
VAR PeriodDays = [Days Value]
VAR TargetCustomers =
    SUMMARIZE ( Sales, Customer[Name] )
VAR FilterPeriod =
    DATESBETWEEN (
        'Date'[Date],
        FirstDateOfPeriod - PeriodDays,
        FirstDateOfPeriod - 1
    )
VAR Result =
    CALCULATE (
        [Sales Amount],
        -- does not change the filter on Product
        REMOVEFILTERS ( Customer ),
        TargetCustomers,
        FilterPeriod
    )
RETURN Result
The Pre-Sales Other Products measure computes the difference between Pre-Sales All Products and Pre-Sales, replacing zero with BLANK:
Pre-Sales Other Products :=
VAR Delta = [Pre-Sales All Products] - [Pre-Sales]
VAR Result = DIVIDE ( Delta, Delta <> 0 )
RETURN Result
The Post-Sales and Post-Sales Other Products measures are obtained with a similar approach and are available in the sample file that you can download.
We have seen how to solve a particular business problem by manipulating the filter context to reduce the amount of code required and improve performance. If you want to know more about how to control the filter context, take a look at the filter context material on SQLBI. Start by watching the free Introducing DAX video course. Once you have digested that content, proceed with one of our in-person classroom courses and/or with watching the Mastering DAX online video course.
Clear filters from the specified tables or columns.
REMOVEFILTERS ( [<TableNameOrColumnName>] [, <ColumnName> [, <ColumnName> [, … ] ] ] )
Returns the dates between two given dates.
DATESBETWEEN ( <Dates>, <StartDate>, <EndDate> )
Returns a blank.
BLANK ( )