 Marco Russo
The visual-level filters of a visual in Power BI allow you to reduce the number of elements in a visual. This approach makes it very easy to apply a filter to the top 10 products in a report, according to the selection required in other slicers or visuals.
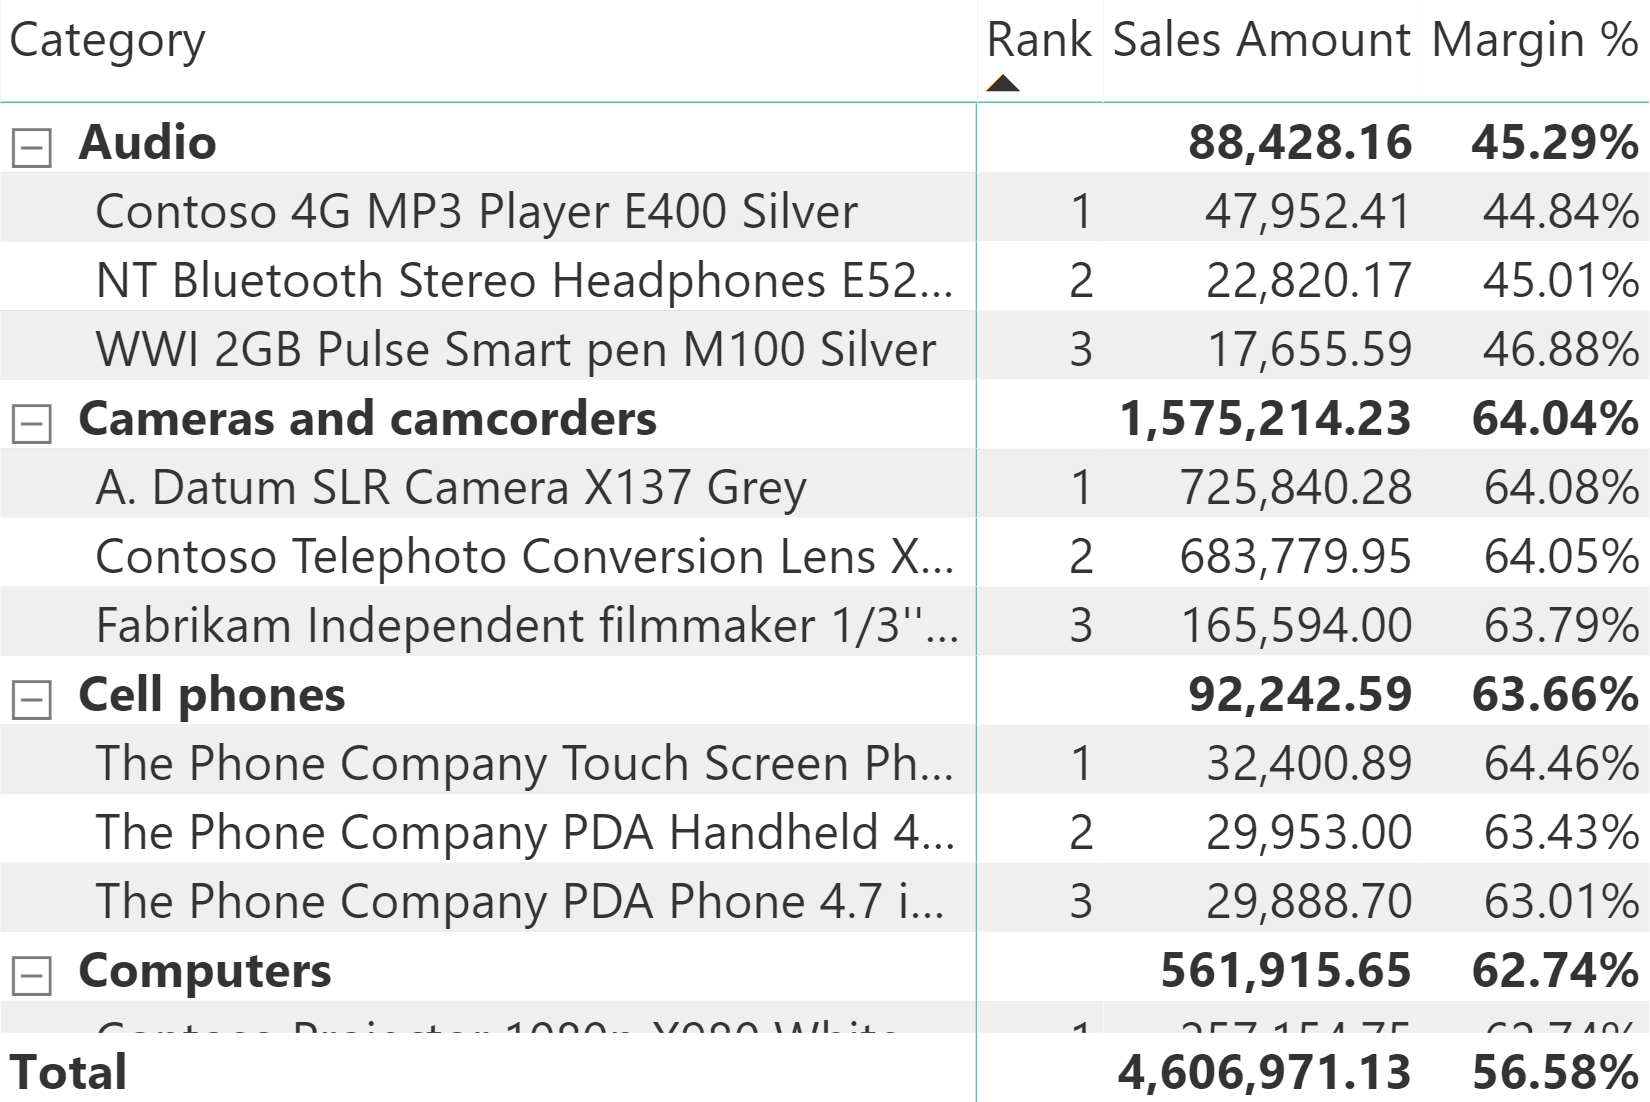
However, the user interface of Power BI does not provide an easy way to create a single visualization displaying the top three products for each category – or, in general, the top N items for each group defined by the user. The goal is to obtain the following result.
A common approach to this scenario is to create a complex measure that hides the result if the element should not be displayed. In other words, it computes the ranking of the product and it blanks out the result if the ranking is larger than three. Though easy to implement, this approach requires modifying all the measures that should be displayed in a visual and negatively impacts performance. A better solution is to create a specific measure to use in the visual-level filter: that measure is executed only once for each product to define the set of visible items, without requiring any change to the other measures used in the visualization. We will see different options to solve the scenario.
A first, simple solution is to measure the rank of each product within its category, filtering the result of this measure in the visual.
The Rank Product measure returns the ranking of a product within its category. The ISINSCOPE function guarantees that the ranking only applies to a single Product Name, whereas the CALCULATETABLE function retrieves all the product names visible in the visual for the current group of products. For example, we used the Product Category in the visual, but the same measure would work for any other column of Product used in the visual.
Rank Product =
IF (
    ISINSCOPE( 'Product'[Product Name] ),
    RANKX (
        CALCULATETABLE (
            VALUES ( 'Product'[Product Name] ),
            ALLSELECTED ( 'Product'[Product Name] )
        ),
        [Sales Amount]
    )
)
Please note that the inner CALCULATETABLE is not the same as just ALLSELECTED ( Product[Product Name] ). Indeed, the measure must consider the filter context on Product[Category] created by the visual. The VALUES function accomplishes this task, whereas ALLSELECTED alone would ignore the filter applied by the visual, producing a wrong result for the measure.
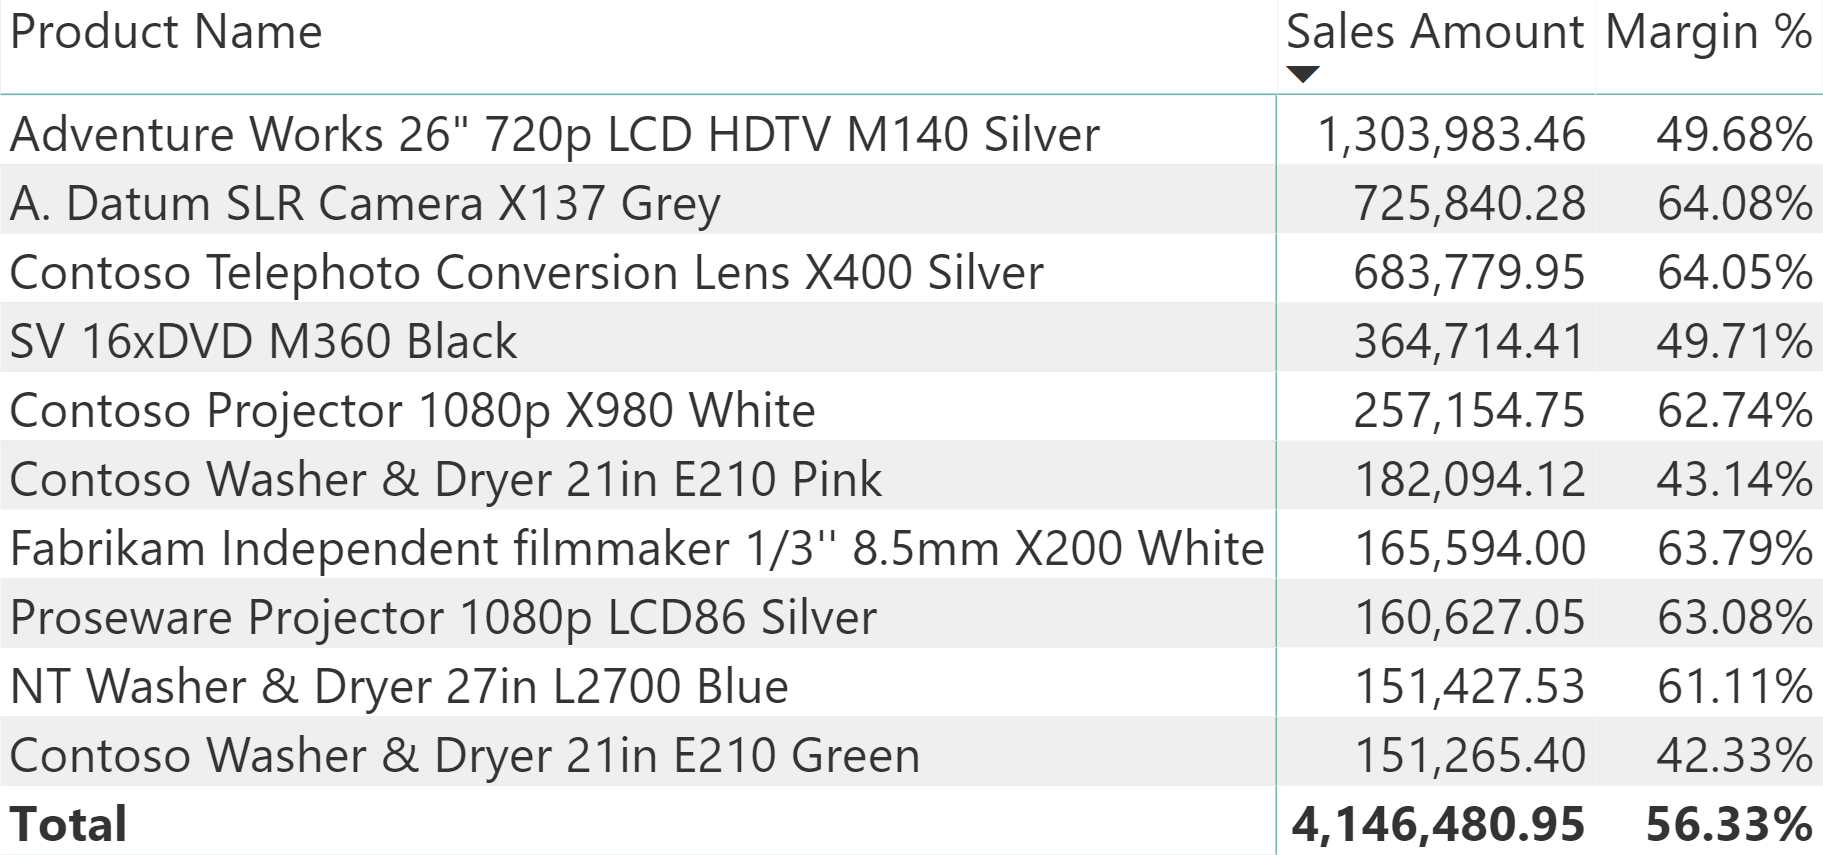
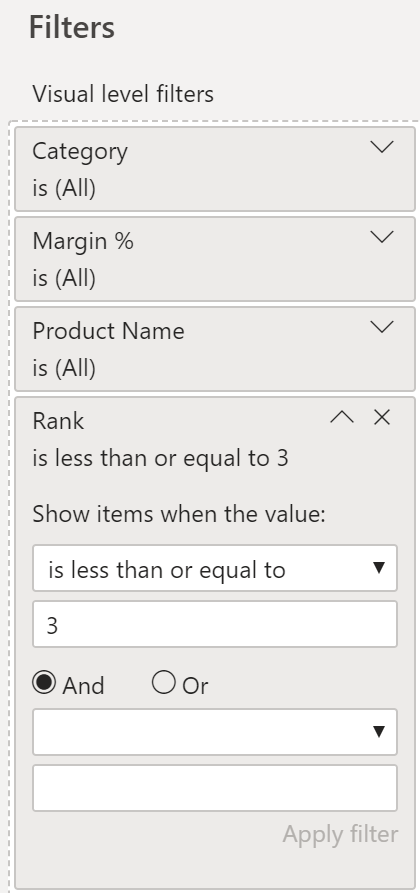
You apply this measure to the visual filter of a matrix with a Product Name granularity only filtering products that return a ranking smaller than or equal to three.
This approach works and the same Rank Product measure can be used in the visualization to accurately sort the products within each category. The visual can also include additional measures, such as the Margin % included in the previous screenshot.
Alternative filter approach
The idea behind a possible alternative approach is that it is not necessary to compute the exact ranking of all the products: it is enough to retrieve the top three products for each category, applying them to the filter of the visual. However, the internal calculation for TOPN requires the same complexity as RANKX, so this is not really an optimization – it is more an educational exercise to see alternative DAX techniques.
Because we cannot provide a table as a visual-level filter, we can create a measure that returns 1 if the product selected in the filter context should be visible, and 0 otherwise. The FilterTop3ByCat_Filter measure does that by generating the list of products to filter for each category using a combination of GENERATE and TOPN – it then applies the result to the filter context using KEEPFILTERS.
FilterTop3ByCat_Filter =
VAR Top3Cat =
    CALCULATETABLE (
        GENERATE (
            VALUES ( 'Product'[Category] ),
            TOPN (
                3,
                CALCULATETABLE ( VALUES ( 'Product'[Product Name] ) ),
                [Sales Amount]
            )
        ),
        ALLSELECTED()
    )
RETURN
    CALCULATE (
        1 * ( NOT ISEMPTY ( 'Product' ) ),
        KEEPFILTERS ( Top3Cat )
    )
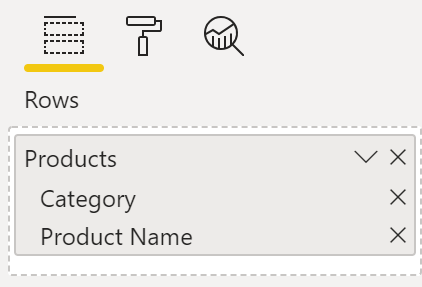
One major drawback of this solution is that the measure must be designed specifically for the combination of columns applied to the visual. For example, the matrix used in the sample report has the Category and Product Name columns visible in the rows.
Remember that this measure is evaluated for each product before the visual is prepared. Applying ALLSELECTED at the beginning is thus critical to remove the dependency from the context transition happening during the iteration of the combinations of Category and Product Name applied to the rows of the matrix. This way the Top3Cat variable produces the same result regardless of the product iterated while preparing the visual-level filter, resulting in a single evaluation for all the products. The KEEPFILTERS in the final CALCULATE combines this list of visible products with the current selection, producing the expected result for the measure: 1 if there is at least one product, or 0 if there are no products visible through the new filter. This measure is a good exercise to review your knowledge of context transition, ALLSELECTED, and KEEPFILTERS.
Even though this approach does not provide any advantage in this scenario, it is worth noting that you can create a special DAX measure specifically designed for the visual-level filters. This way, you can customize selections of items in a visual thereby overcoming the limitations of the options available in the user interface of Power BI. The advantage of this approach is that the existing measures in the data model can work without any change – unless you want to include the hidden items in the group subtotal, as explained in the following sections.
Displaying unfiltered subtotals of groups of filtered items
By using the visual level filter, the Sales Amount value of a Category corresponds to the sum of the top three products of that category. In other words, the Sales Amount measure only displays the sum of the visible products, based on the filter applied to the visual.
If you want to show the sum of all the products at the category level, then you need a different Sales Unfiltered measure that ignores the filter over the products when the condition is met.
Sales Unfiltered =
IF (
    ISINSCOPE ( 'Product'[Product Name] ),
    [Sales Amount],
    IF (
        ISINSCOPE ( 'Product'[Category] ),
        CALCULATE (
            [Sales Amount],
            ALL ( 'Product'[Product Name] )
        )
    )
)
The Sales Unfiltered measure simply returns Sales Amount at the Product Name level, whereas it computes Sales Amount removing the filter from Product Name when invoked at the Category level. This way, you can display a matrix sorting the Categories by total Sales Amount considering all the products, even though only the top three are displayed in the detail of the matrix.
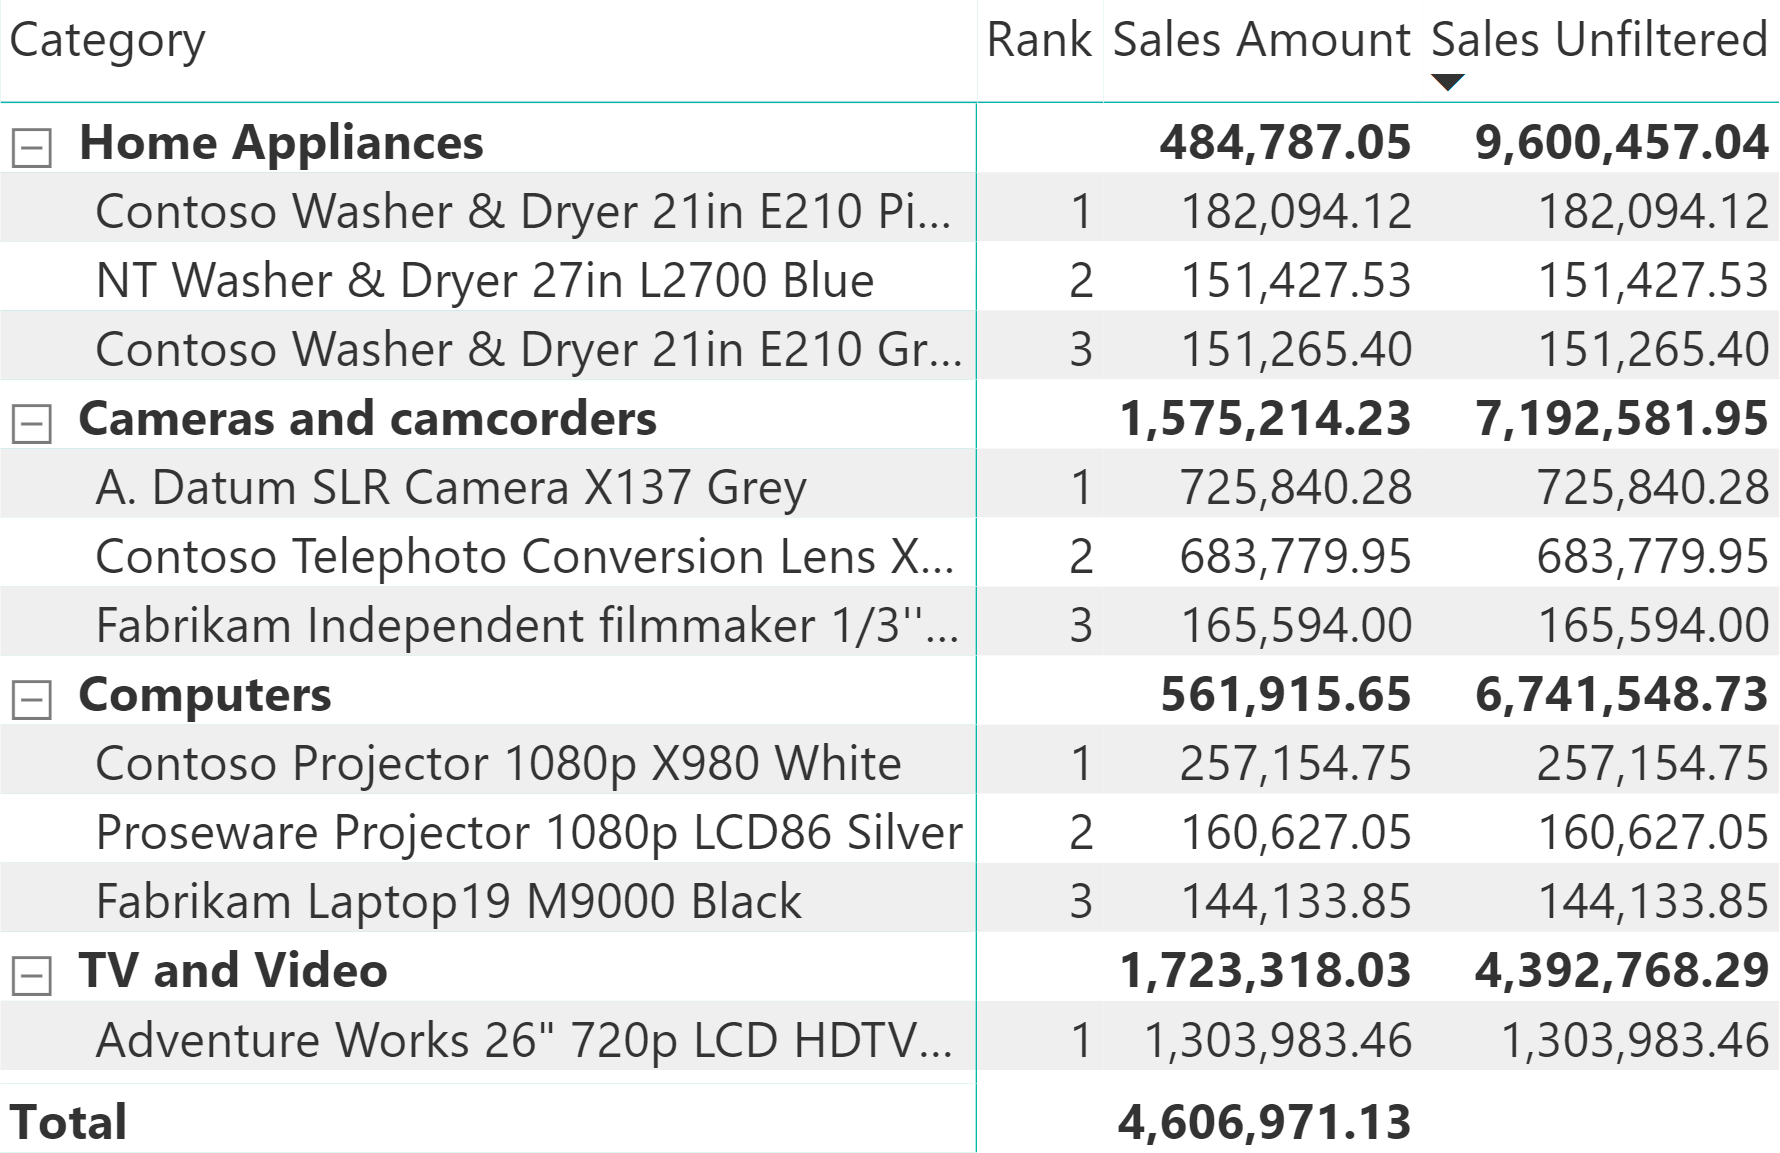
The previous version of Sales Unfiltered does not show any value in the grand total, but the reason for that was to show the structure of the measure that identifies the level of the hierarchy, Product Name or Category. A better version of Sales Unfiltered just remove the filter over Product Name in case there is any another hierarchy level, including the total. This is the measure used in the following examples of rank measures.
Sales Unfiltered =
IF (
    ISINSCOPE ( 'Product'[Product Name] ),
    [Sales Amount],
    CALCULATE (
        [Sales Amount],
        ALL ( 'Product'[Product Name] )
    )
)
Displaying a ranking of groups of filtered items
In the previous examples, the Rank measure was blank at the Category level. If you want to display the ranking of categories and products, you need the following measure which changes the RANKX arguments depending on the current level of the visualization:
Rank Multi =
IF (
    ISINSCOPE( 'Product'[Product Name] ),
        RANKX (
        CALCULATETABLE (
            VALUES ( 'Product'[Product Name] ),
            ALLSELECTED ( 'Product'[Product Name] )
        ),
        [Sales Amount]
    ),
    IF (
        ISINSCOPE( 'Product'[Category] ),
        RANKX (
            ALLSELECTED ( 'Product'[Category] ),
            [Sales Unfiltered]
        )
    )
)
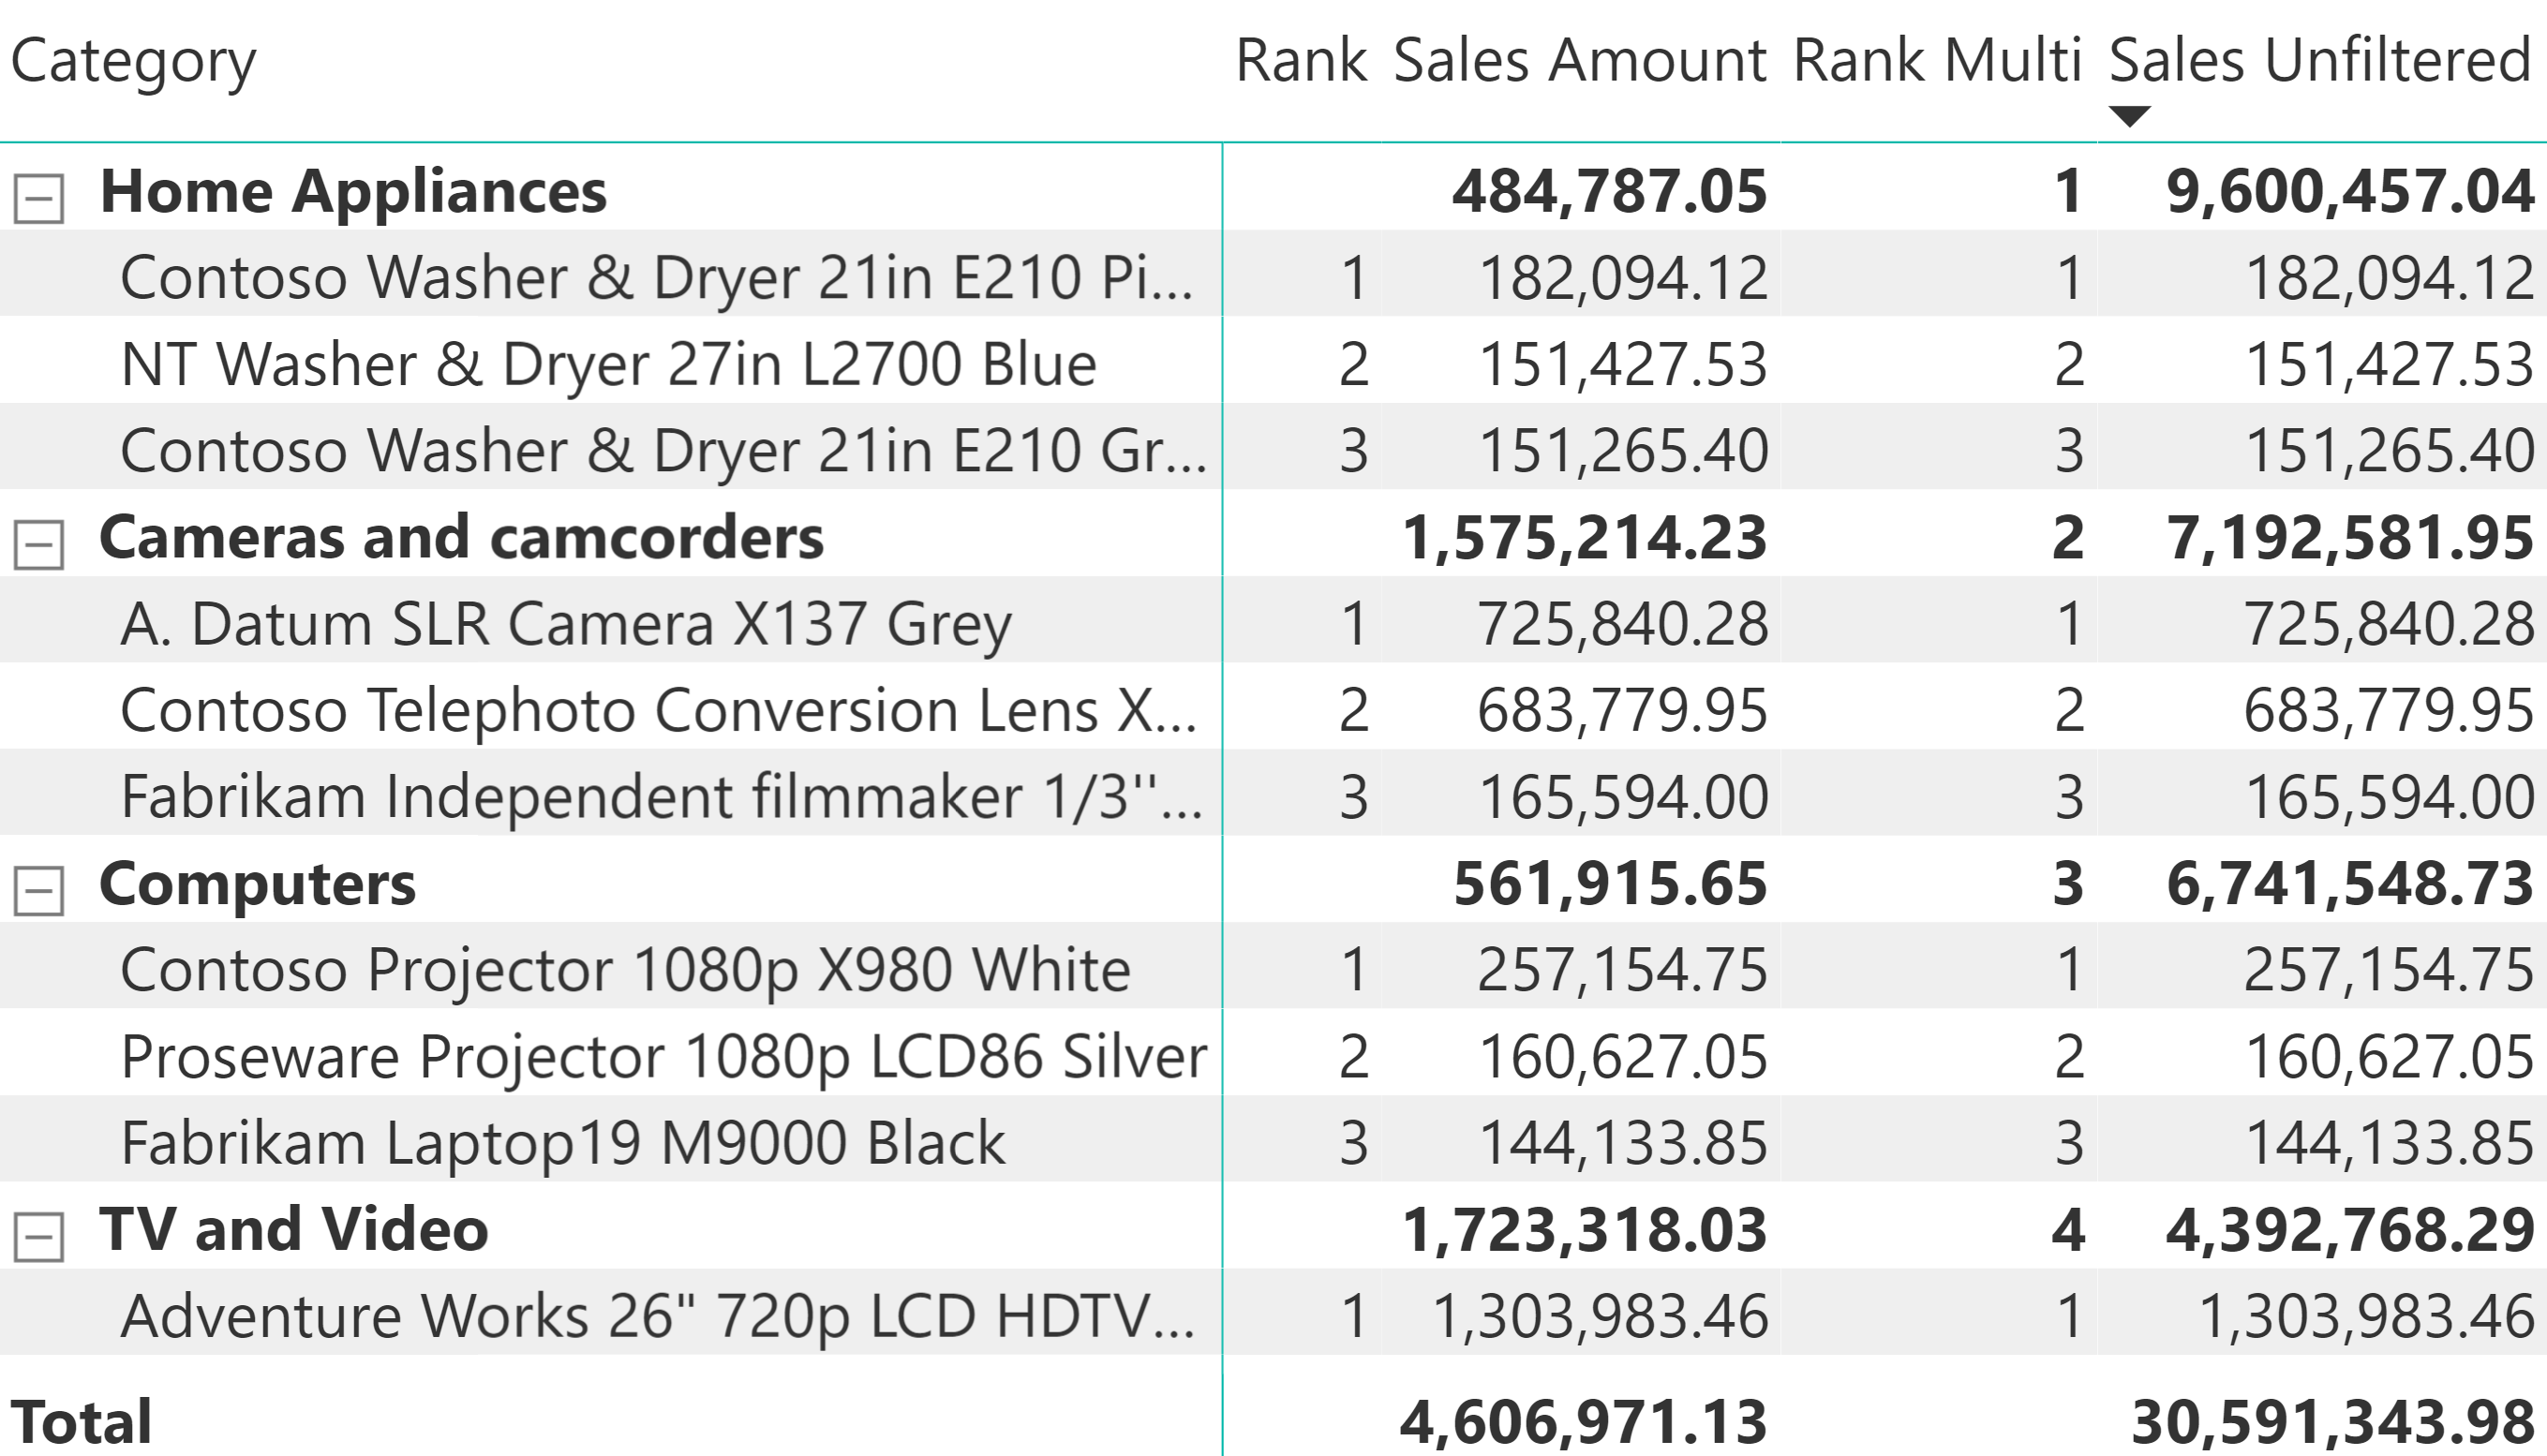
The Rank Multi measure correctly sorts categories by using the Sales Unfiltered measure, as shown in the following screenshot.
If you want to create a ranking that considers the Sales Amount measure of the products filtered in the visual, there is some complexity involved in getting the proper filter context at the Category level. The ALLSELECTED condition is required to retrieve the combinations of Categories and Products filtered in the visual; therefore, the Sales Amount value of the current category must be stored in a variable before losing the current filter context in order to execute the RANKX with the proper value.
Rank Visual =
IF (
    ISINSCOPE ( 'Product'[Product Name] ),
    RANKX (
        CALCULATETABLE (
            VALUES ( 'Product'[Product Name] ),
            ALLSELECTED ( 'Product'[Product Name] )
        ),
        [Sales Amount]
    ),
    IF (
        ISINSCOPE ( 'Product'[Category] ),
        VAR CategorySales = [Sales Amount]
        RETURN
            CALCULATE (
                RANKX (
                    VALUES ( 'Product'[Category] ),
                    [Sales Amount],
                    CategorySales
                ),
                ALLSELECTED ()
            )
    )
)
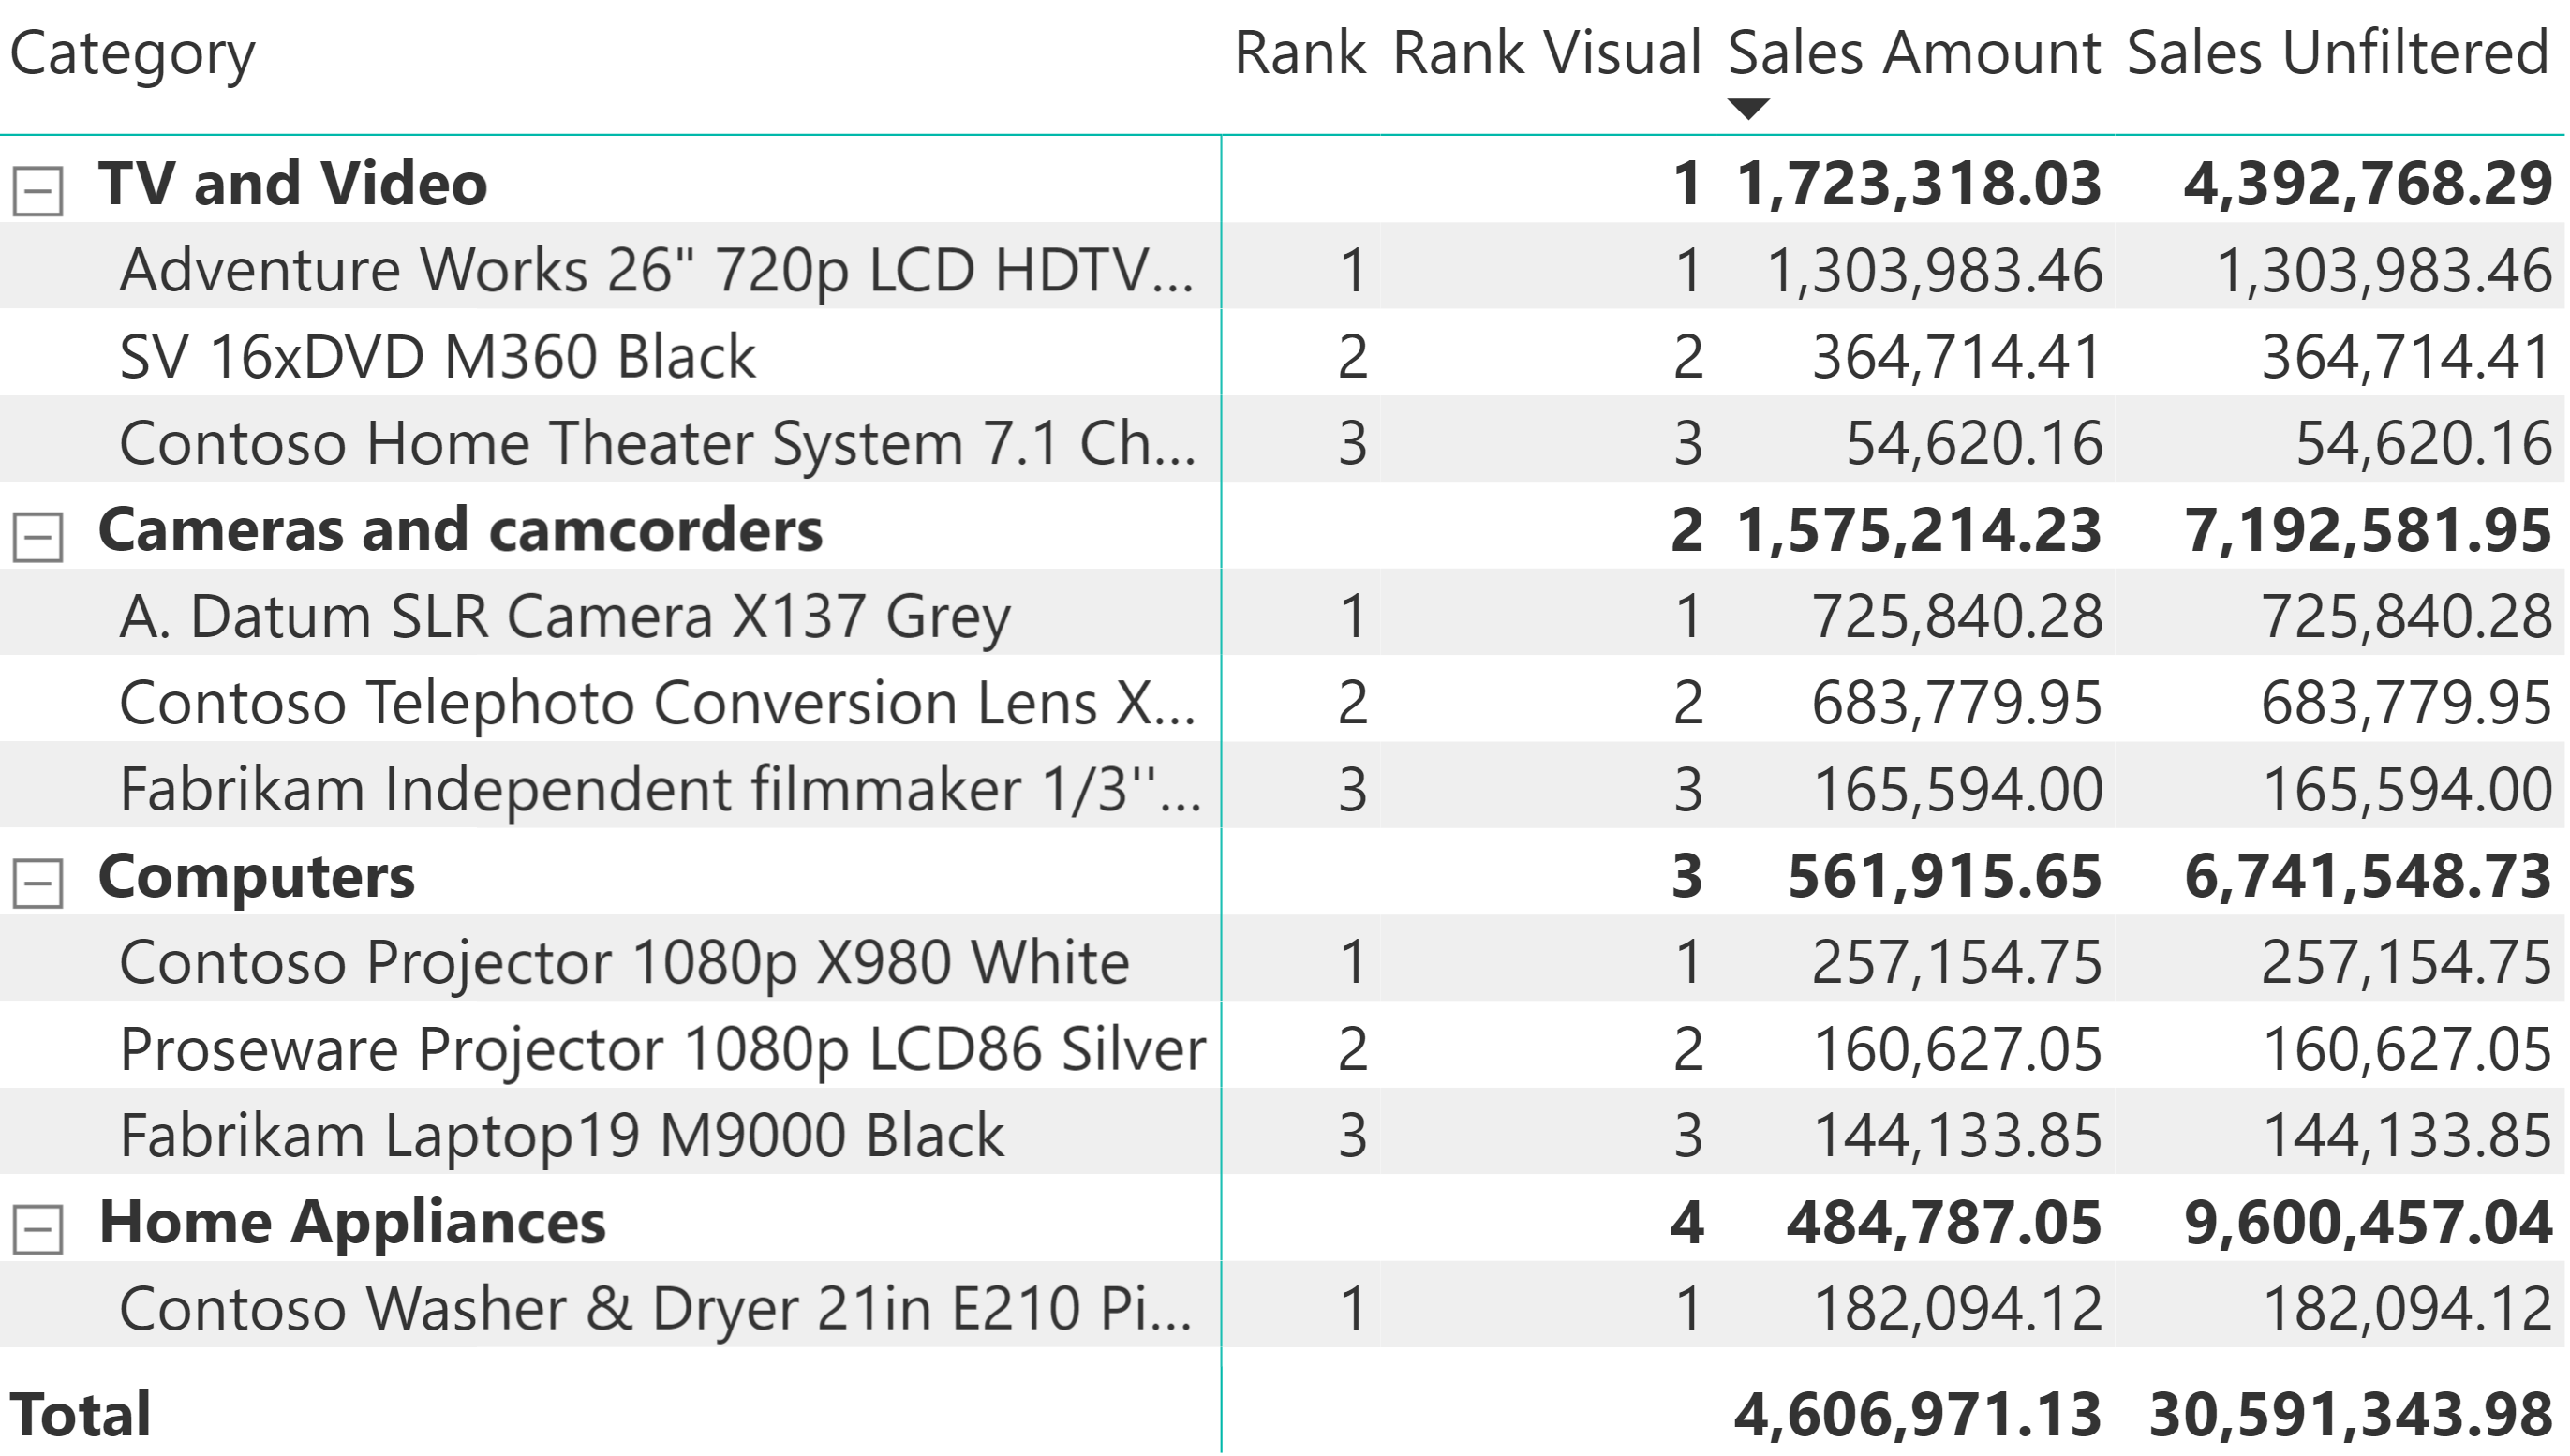
The Rank Visual measure produces the following result, computing the ranking at the Category and Product Name levels accurately, based on the visible Sales Amount measure.
Conclusions
Applying specific measures to the visual-level filter of a visualization is a very powerful technique to completely customize the items shown in a report. The presence of this filter requires special measures in order to display values related to items not included in the visual level filter.
Returns true when the specified column is the level in a hierarchy of levels.
ISINSCOPE ( <ColumnName> )
Evaluates a table expression in a context modified by filters.
CALCULATETABLE ( <Table> [, <Filter> [, <Filter> [, … ] ] ] )
Returns all the rows in a table, or all the values in a column, ignoring any filters that might have been applied inside the query, but keeping filters that come from outside.
ALLSELECTED ( [<TableNameOrColumnName>] [, <ColumnName> [, <ColumnName> [, … ] ] ] )
When a column name is given, returns a single-column table of unique values. When a table name is given, returns a table with the same columns and all the rows of the table (including duplicates) with the additional blank row caused by an invalid relationship if present.
VALUES ( <TableNameOrColumnName> )
Returns a given number of top rows according to a specified expression.
TOPN ( <N_Value>, <Table> [, <OrderBy_Expression> [, [<Order>] [, <OrderBy_Expression> [, [<Order>] [, … ] ] ] ] ] )
Returns the rank of an expression evaluated in the current context in the list of values for the expression evaluated for each row in the specified table.
RANKX ( <Table>, <Expression> [, <Value>] [, <Order>] [, <Ties>] )
The second table expression will be evaluated for each row in the first table. Returns the crossjoin of the first table with these results.
GENERATE ( <Table1>, <Table2> )
Changes the CALCULATE and CALCULATETABLE function filtering semantics.
KEEPFILTERS ( <Expression> )
Evaluates an expression in a context modified by filters.
CALCULATE ( <Expression> [, <Filter> [, <Filter> [, … ] ] ] )