Bertrand d’Arbonneau added a new feature in the last version (v 1.09) of Power Pivot Utilities, which allows the visualization of Dependents and Precedents measures in the measure list created by the List Measures tool.
How to use the new features:
- Clieck List measures to create a table with a list of all the measures of the Power Pivot data model.
- Select a measure name by clicking on the corresponding cell in the Measure column.
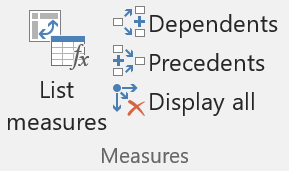
- Press the Dependents or Precedents button in the Measures ribbon. A new column Level is added to the table that lists the measures. The Level column displays the distance from/to the selected measure. The button also filters the table to show only the related measures.
- Press Display all to remove the Level column and filter, showing all the measures again.
The button that calls DAX Studio might not work with DAX Studio 2.7.0 and 2.7.1 – the problem will be fixed by the upcoming version 2.7.2 of DAX Studio.