 Marco Russo & Alberto Ferrari
This article is part of a series of articles about the basics of DAX. In a previous article, we introduced the first evaluation context in DAX: the row context. If you are not familiar with the row context, we strongly suggest that you start by reading that article first. Here, we build upon your knowledge of the row context to introduce the second evaluation context: the filter context.
Be mindful that the most relevant information you need to master about evaluation contexts is the difference between the row context and the filter context. You cannot appreciate any difference until you know exactly what the two contexts are. This is the reason why approaching the filter context without any existing knowledge about the row context would be only partially useful.
After this introduction, it is time to dive into the details of the filter context. The filter context is nothing but a filter currently active on the data model. Filters are almost always present during the calculation of a DAX formula, and they affect the results.
For example, the following measure seems to compute Sales Amount over the entire Sales table, because there are no specific filters set inside the expression:
Sales Amount :=
SUMX (
    Sales,
    Sales[Quantity] * Sales[Net Price]
)
And yet, depending on the filter context the formula will compute different values. If a user slices by Product[Brand], the formula computes Sales Amount for different brands, as you can see in the following matrix.
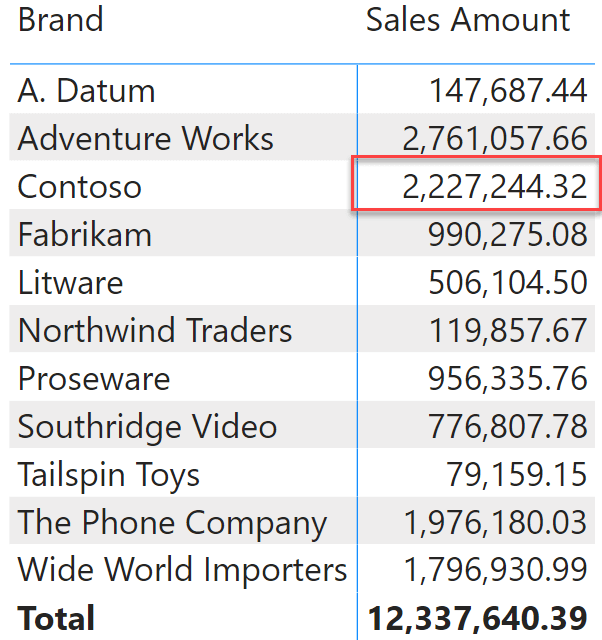
Despite the behavior being intuitive, we need to understand it a little deeper. At the grand total, the formula computes the sales amount for all the rows. In the other rows of the matrix, it computes different values. Although the engine is computing the same formula, it produces different values in different cells. The difference among the cells is the filter context. The matrix creates a filter context that is different for each cell. Consequently, the engine computes the same formula under different filters, therefore producing different results.
For example, the highlighted cell is showing the sales amount for Contoso, because the measure is being computed inside a filter context that shows only the value Contoso for the Product[Brand] column.
A very common mistake made by newbies is to think that each row in a matrix is evaluated in a row context, because they equate a row in a matrix with the row context. This is not the case. A row context exists within an active iteration. No iteration, no row context. Therefore, the individual rows of the matrix are not computed inside a row context. Each cell of the matrix is evaluated in a filter context that happens to filter a single value for the Brand column. If you carefully think about that, despite each cell in the matrix being a single row, its value is the aggregation of several products – namely all the products from the same brand. The filter context in each cell is not filtering one particular row from Product. The filter context is filtering one individual value for the Product[Brand] column. Hence, the filter actually results in multiple rows being visible in the Product table.
The filter context can filter multiple columns at once. If you add the year on the columns of the matrix, the scenario becomes a bit more complex.
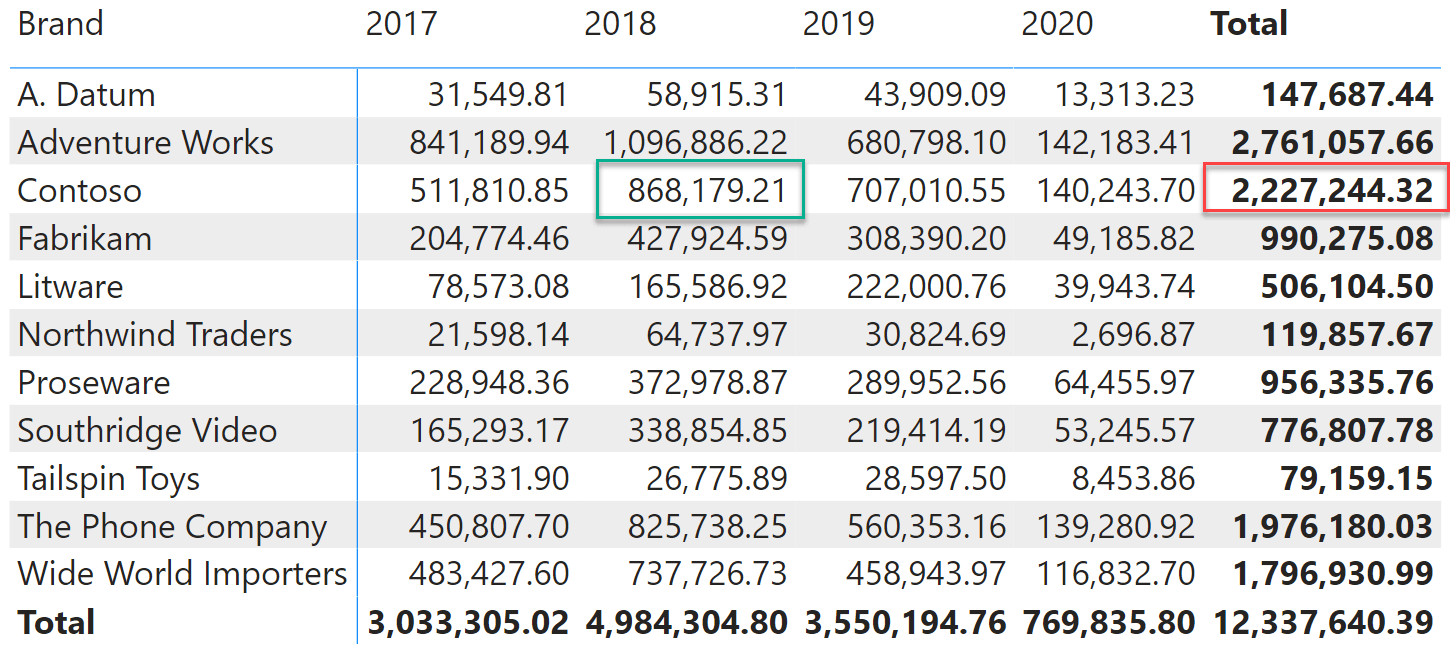
The red box is highlighting the value we just saw in the previous figure. In the red box (Contoso, Total), there are no filters on the year, therefore the filter context is filtering only Contoso. In the green box (Contoso, 2018), however, there are two columns being filtered: one for the Contoso brand and one for the year 2018. Again, same formula, different filter contexts, hence different results.
The filter context filters columns. The filter context is created by Power BI to reflect any filter that is active on the current cell. Filters can be activated by the current visual, or by using the filter pane, by cross-filtering visuals, slicers or by any other available means. No matter where they originated from, all these filters are combined into a single filter context that is active in the cell of the visual. Moreover, every cell has a different filter context. If two cells had the same filter context, they would show the same value.
One way to think about the difference between the row context and the filter context is to focus on their use. A row context is needed whenever you operate on values in a single row of a table. The filter context, on the other hand, changes the way data is aggregated and/or scanned.
Power BI does not create the row context of each cell by running a separate query for each cell. Instead, it uses the SUMMARIZECOLUMNS function that performs a grouping by some columns and then it computes expressions in the filter context resulting from the group-by columns. The following query is a simplification of what the previous matrix is showing (it is missing the subtotals). If you are a DAX newbie, the formula itself is likely to be overwhelming. So focus only on the separation of filter context vs. row context, explained after the code:
EVALUATE
SUMMARIZECOLUMNS (
    'Product'[Brand],                              -- Groups by Brand
    'Date'[Year],                                  -- Groups by Year
    "Sales Amount",                                -- Adds a new column named Sales Amount
        SUMX (                                     -- Starts an iteration, inside a filter context
            Sales,                                 -- Iterates sales of the given brand and year
            Sales[Quantity] * Sales[Net Price]     -- Multiplication, executed in the row context
        )                                          -- After SUMX there is no longer a row context
)
SUMMARIZECOLUMNS retrieves all the values of Product[Brand] and Date[Year]. For each combination of brand and year, it creates a filter context with that combination and then evaluates the expression for Sales Amount. When the SUMX function starts, the filter context is already active, therefore SUMX scans only the rows belonging to the given combination. It then computes the multiplication of Sales[Quantity] times Sales[Net Price] row by row.
The two contexts (row and filter) operate in different parts of the expression, achieving different goals. At the risk of being pedantic, let us repeat this important detail: the row context is not the same as the filter context. The row context exists only in calculated columns or during an iteration, whereas the filter context is set for the entire formula, restricting the rows visible in the model.
The filter context is created automatically by Power BI as part of the evaluation of DAX queries to populate the visuals. Developers have the option of creating their filter context too, by leveraging CALCULATE. For example, to compute the value of Sales Amount for only the customers living in Europe, you can use the following expression:
Europe Sales :=
CALCULATE (
    [Sales Amount],
    Customer[Continent] = "Europe"
)
CALCULATE changes the filter context under which Sales Amount is being computed, by setting a filter on the Customer[Continent] column for it to be Europe. Nonetheless, talking about CALCULATE would require much more time and effort. Here, the purpose of the article is to introduce the filter context and highlight some differences between the row and the filter contexts.
There is another important difference between the row context and the filter context. The row context iterates a table. Therefore, during the iteration you can access the value of each column of only the iterated table. Columns in different tables are not affected by the presence of a row context, even if there are relationships linking the tables together.
The filter context, on the other hand, operates at the model level. When you place a filter on a column, the filter affects the column, the table that the column belongs to and all the tables that can be reached through relationships. By default, the filter is propagated from the one-side of a relationship to the many-side. Nonetheless, by activating bidirectional relationships, you can propagate the filter context both ways: from the one-side to the many-side and from the many-side to the one-side.
The direction of propagation of the filter context is reflected in the arrow found in the middle of any relationship in the Power BI diagram view.
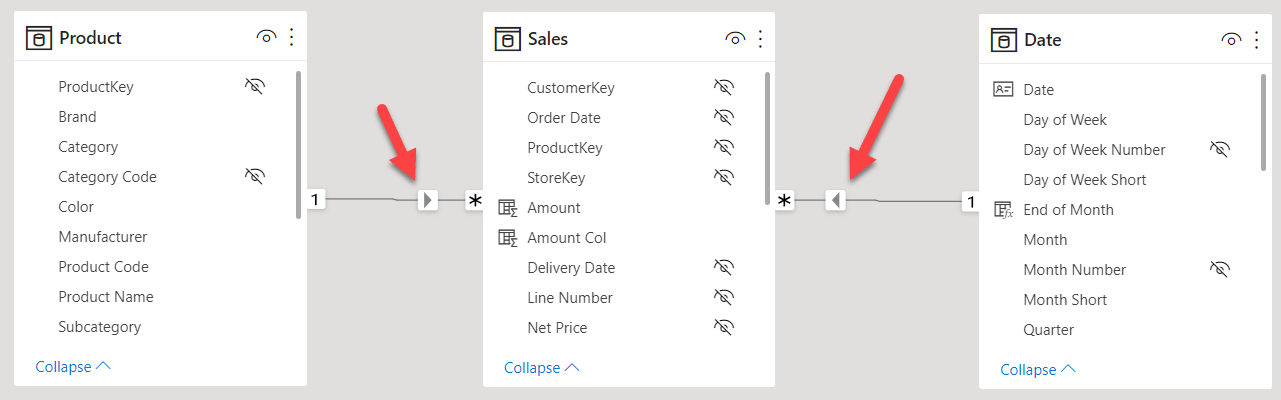
By default, the propagation occurs from the one-side towards the many-side, meaning that a filter on the Date table is propagated to the Sales table, and the same applies from Product towards Sales. But then a filter on Sales is propagated neither to Product nor to Date.
You have the option of changing how the filter context propagates by activating bidirectional relationships. If the relationship between Product and Sales were a bidirectional relationship, then a filter on Sales would propagate to Product. Word of advice, bidirectional relationships are a powerful and dangerous tool. Do not use bidirectional relationships unless you have a very clear understanding of data modeling concepts and DAX. If you are interested, you can find more information about the perils of bidirectional relationship here: Bidirectional relationships and ambiguity in DAX – SQLBI.
Conclusions
There would be a lot more to talk about when it comes to the row context and the filter context. These concepts are the foundation of the entire DAX language, which is why we created a suite of books, courses, and videos about these important concepts. In this article, we merely scratched the surface. If you want to learn more, then start by watching the free Introducing DAX video course. Once you have digested that content, proceed with one of our in-person classroom courses and/or with watching the Mastering DAX online video course.
Keep in mind that reaching a solid understanding of both the row context and the filter context is of paramount importance if you plan on becoming a good DAX developer.
Create a summary table for the requested totals over set of groups.
SUMMARIZECOLUMNS ( [<GroupBy_ColumnName> [, [<FilterTable>] [, [<Name>] [, [<Expression>] [, <GroupBy_ColumnName> [, [<FilterTable>] [, [<Name>] [, [<Expression>] [, … ] ] ] ] ] ] ] ] ] )
Returns the sum of an expression evaluated for each row in a table.
SUMX ( <Table>, <Expression> )
Evaluates an expression in a context modified by filters.
CALCULATE ( <Expression> [, <Filter> [, <Filter> [, … ] ] ] )
Articles in the DAX 101 series
- Computing running totals in DAX
- Counting working days in DAX
- Summing values for the total
- Year-to-date filtering weekdays in DAX
- Creating a simple date table in DAX
- Automatic time intelligence in Power BI
- Using CONCATENATEX in measures
- Previous year up to a certain date
- Sorting months in fiscal calendars
- Using USERELATIONSHIP in DAX
- Mark as Date table
- Row context in DAX
- Filter context in DAX
- Introducing CALCULATE in DAX
- Understanding context transition in DAX
- Using KEEPFILTERS in DAX
- Variables in DAX
- Using RELATED and RELATEDTABLE in DAX
- Introducing ALLSELECTED in DAX
- Introducing RANKX in DAX