 Alberto Ferrari
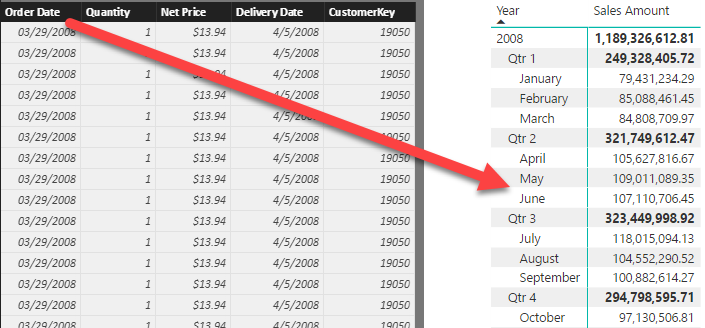
Power BI offers the Auto Date/Time feature, which enables easy browsing of data by year, quarter, month and date. In the following model the Sales table contains the Order Date column, which contains only the date. The user can browse it using year and quarter by simply dropping the date into a matrix:
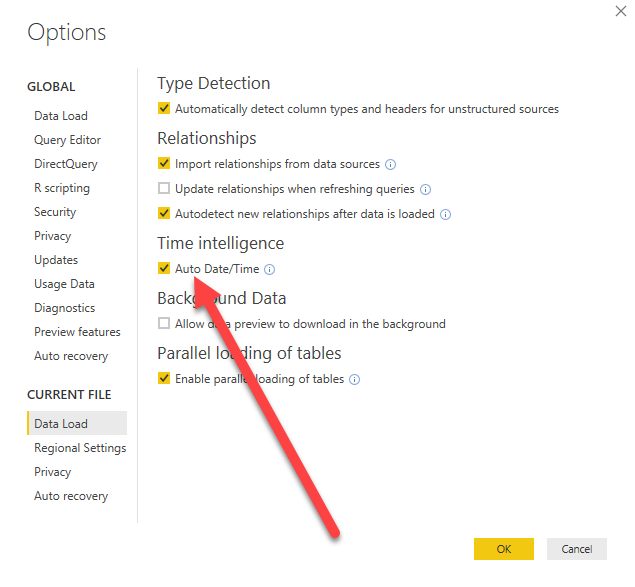
The Auto Date/Time feature can be turned on or off using the File|Options and Settings|Options dialog, under Data Load. It is turned on by default. You can find more details in this other video: Disabling auto date-time in Power BI.
In order to slice data by the different attributes of the date, Power BI automatically creates one date table for each date column in the model. Thus, if the model contains five date columns across one or more tables, there will be five automatic date tables in the model. Moreover, these tables are hidden from the user because Power BI handles them automatically.
The user can reference these tables by using a special syntax, which Power BI uses in the creation of quick calculations. For example, the quick calculation of year-to-date (YTD) based on the Sales[Order Date] column is the following:
Sales Amount YTD :=
IF (
    ISFILTERED ( 'Sales'[Order Date] ),
    ERROR ( "Time intelligence quick measures can only be grouped …" ),
	TOTALYTD ( 'Sales'[Sales Amount],  'Sales'[Order Date].[Date] )
)
The second parameter of TOTALYTD is not a simple column reference. It contains the table name, the column name and then, separated with a dot, another column name. The full meaning of this syntax is the following:
Reference the Date column in the automatic date table created for the Order Date column in the Sales table.
Although this is a useful feature for very simple models, it comes with some severe limitations:
- It is not possible to customize the automatic date tables. By default, they contain Year, Quarter, Month and Date. If the user needs additional attributes, it is not possible to add them to the model.
- There is a separate automatic date table for each Date column in the model, making it very hard to build reports that slice multiple tables or that compute values based on different dates in a single table.
- Computing running totals in DAX
- Counting working days in DAX
- Summing values for the total
- Year-to-date filtering weekdays in DAX
- Creating a simple date table in DAX
- Automatic time intelligence in Power BI
- Using CONCATENATEX in measures
- Previous year up to a certain date
- Sorting months in fiscal calendars
- Using USERELATIONSHIP in DAX
- Mark as Date table
- Row context in DAX
- Filter context in DAX
- Introducing CALCULATE in DAX
- Understanding context transition in DAX
- Using KEEPFILTERS in DAX
- Variables in DAX
- Using RELATED and RELATEDTABLE in DAX
- Introducing ALLSELECTED in DAX
- Introducing RANKX in DAX
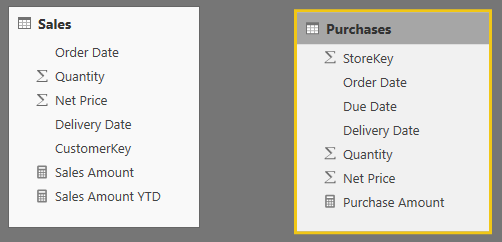
While the first point requires no further explanation, the second point is worth expanding on with a couple of examples. Consider a model containing two tables, Sales and Purchases:
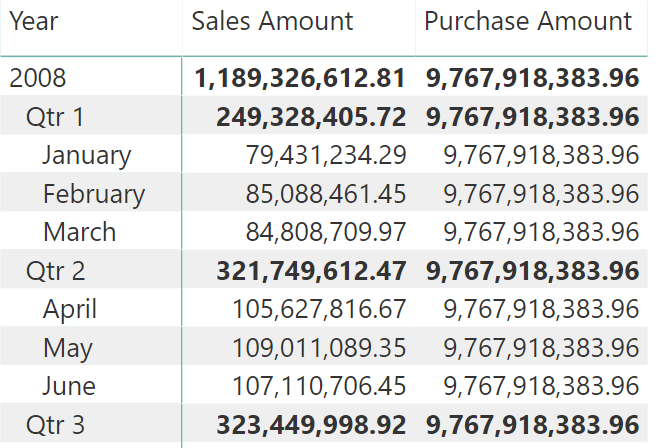
The automatic date table created for Sales[Order Date] filters only Sales and it will not filter Purchases. On the other hand, the automatic date table created for Purchases[Order Date] filters only Purchases. It is not possible to filter both tables using a single column. Thus, a report showing sales and purchases in the same visual shows up looking like this:
Although very evident with multiple tables, the same problem is present when there are multiple kinds of dates in the same table. For example, Sales contains both the order date and the delivery date. The user might want to produce a report showing ordered amount and delivery amount in the same visual, like this:
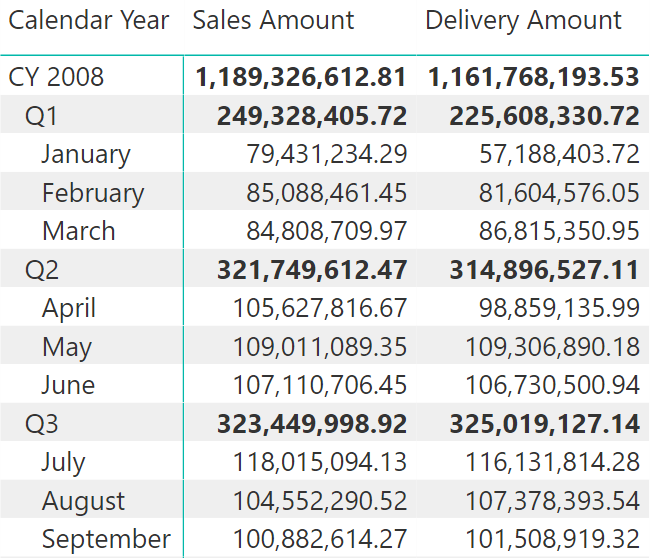
This is not an available option by relying solely on the automatic date table, because there will be two date tables: one for the sale date and one for the delivery date.
Thus, automatic date/time handling in Power BI only works in a scenario where there is a single table with a single Date column. Any other scenario requires a custom Date table and the authoring of time intelligence calculations in DAX, because it is not possible to use Quick Calculations. It is worth mentioning that the creation of a Date table is a very simple step, as described in the Creating a Simple date table in DAX article.
Evaluates the specified expression over the interval which begins on the first day of the year and ends with the last date in the specified date column (or in the evaluation context if a calendar reference is provided) after applying specified filters.
TOTALYTD ( <Expression>, <Dates> [, <Filter>] [, <YearEndDate>] )