 Marco Russo & Alberto Ferrari
Power BI lets you reduce the number of rows in a visual by using visual-level filters. For example, you can filter the top 3 products in a report, according to the selection required in other slicers or visuals.
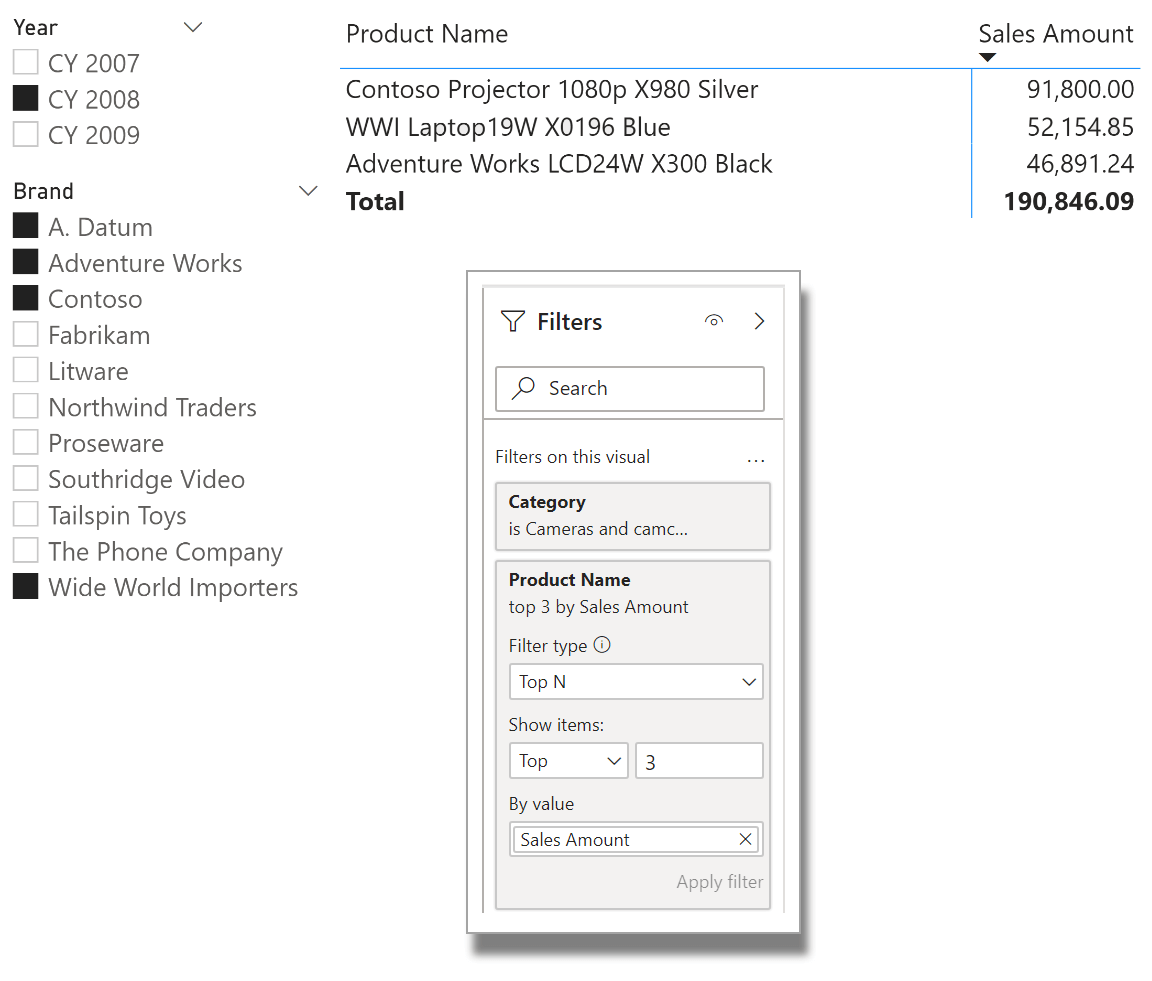
However, if you want to repeat the top 3 products filter for each category in the same visual, you do not have a straightforward solution in Power BI. The first goal is to obtain the following result.
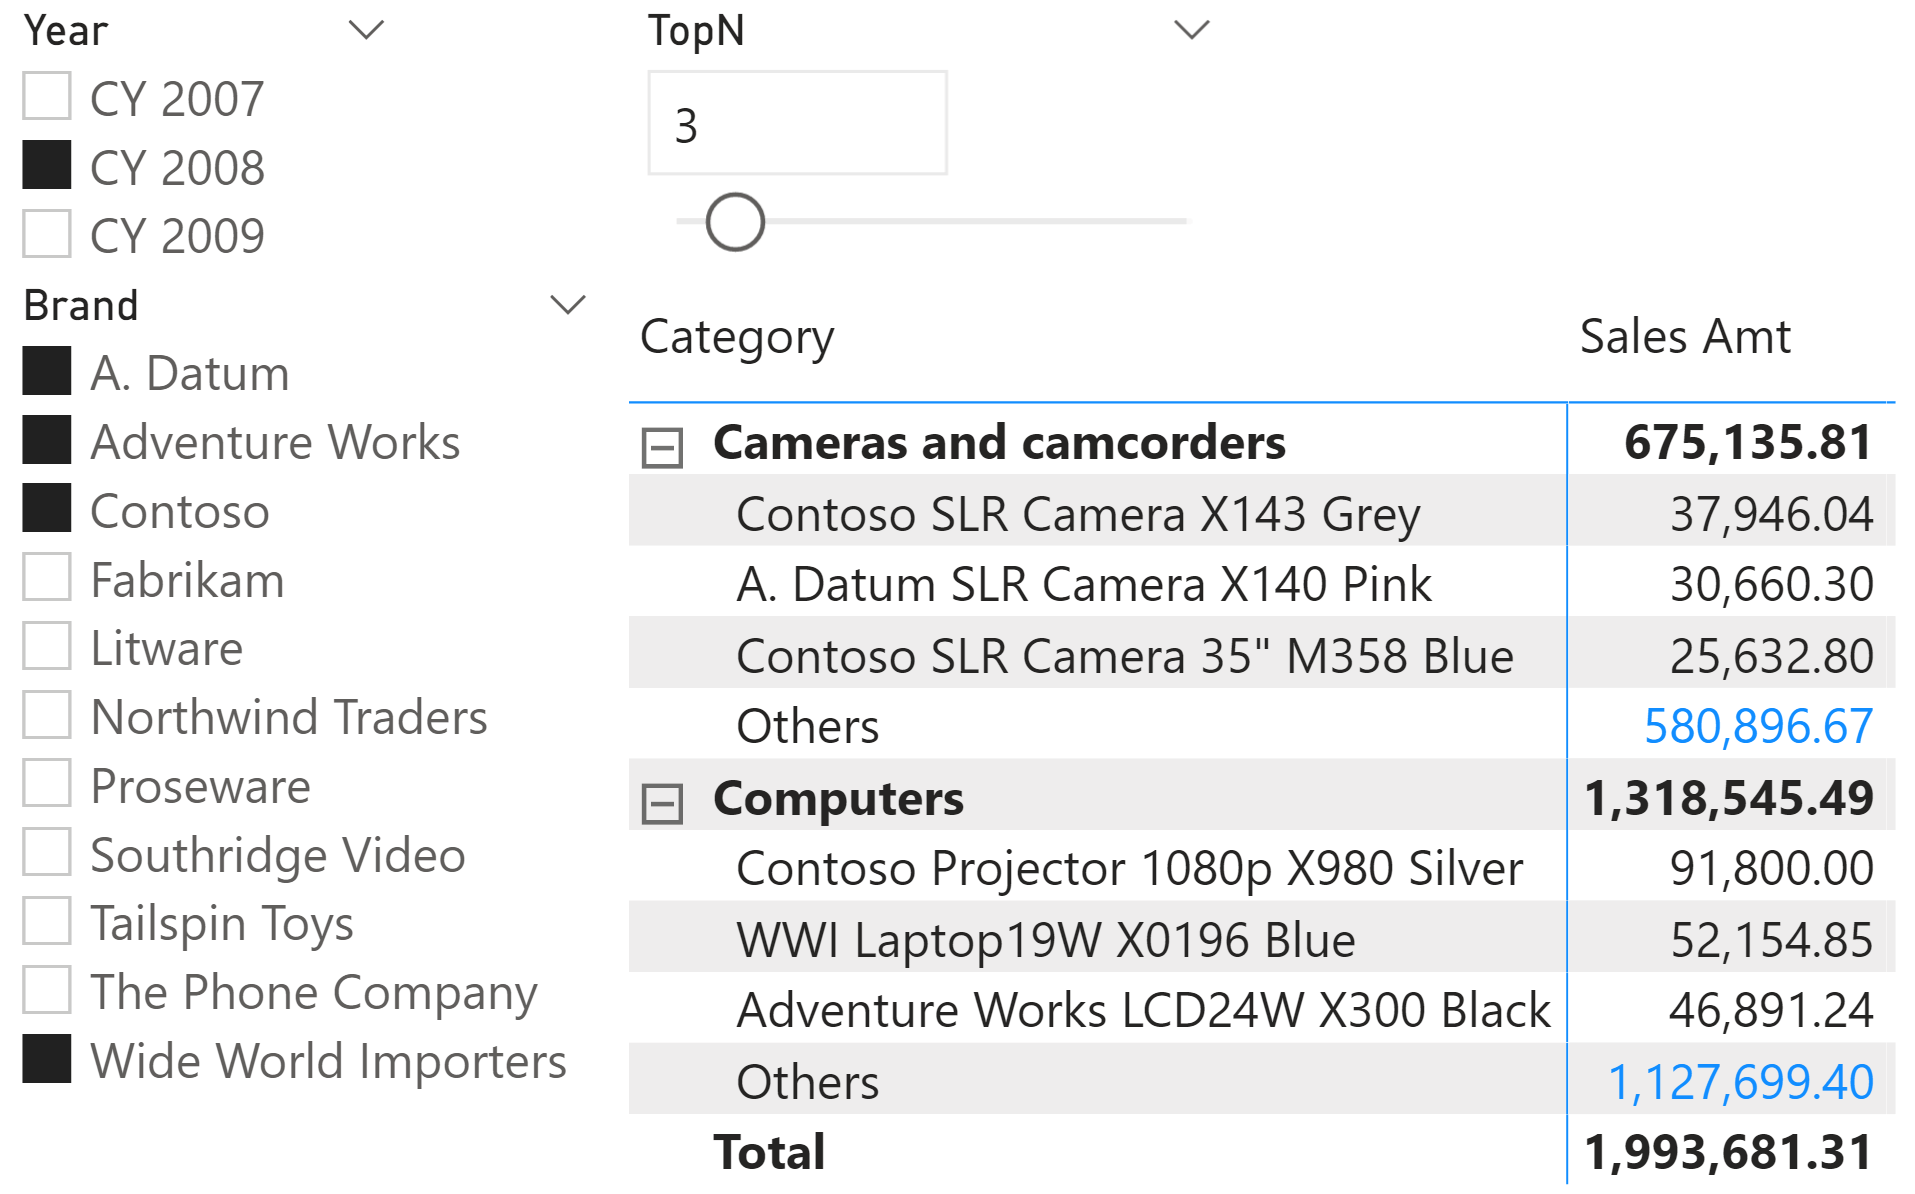
A more frequent requirement is to display the top 3 products (or top 10 – we use 3 just to simplify the examples) in detail, followed by an “Others” row that includes all the other products not included in the top 3 set. Thus, the final goal is to display the following report.
There are several challenges:
- Filtering the top 3 product names for each category by Sales Amount, according to any selection applied in the report. This filter has to be dynamic.
- Showing a row with “Others” in the Product Name
- Aggregating in “Others” the Sales Amount value of all the products not included in the top 3 set.
- Showing the products ordered by Sales Amount in descending order, while keeping the “Others” row always at the bottom in each category and highlighted, regardless of the amount being displayed in Sales Amount.
Filtering the top N products
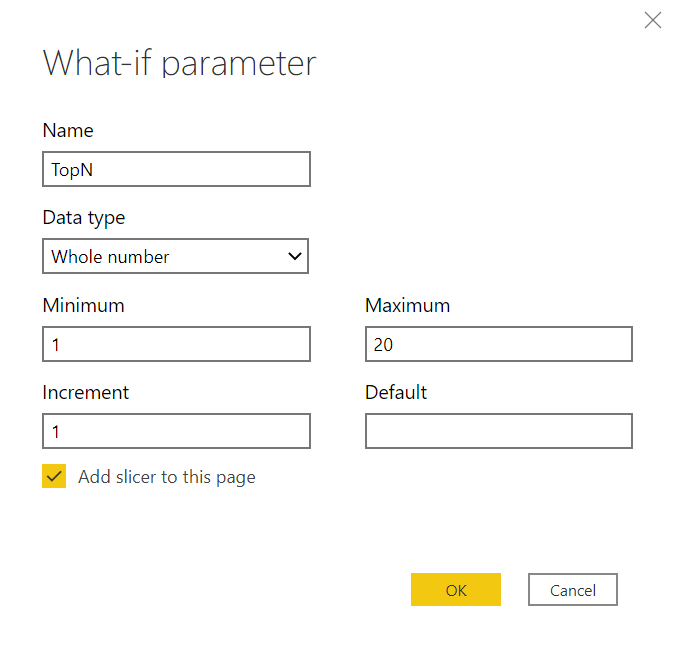
We need a dynamic parameter to provide a dynamic selection of the Top N. You can skip this step if you need a set number: just replace the TopN Value measure with the constant value you need. If you want to keep it dynamic, then you need to create a parameter table named TopN with a measure called TopN Value that returns the selected value. You can use the What-if parameter feature in Power BI for that purpose.
Power BI generates the TopN calculated table this way:
TopN = GENERATESERIES ( 1, 20, 1 )
The TopN Value measure is the following:
TopN Value := SELECTEDVALUE ( 'TopN'[TopN] )
In order to properly filter the visual, we need a Ranking by Sales measure that returns the ranking of a product in the visual:
Ranking by Sales :=
IF (
    ISINSCOPE ( 'Product'[Product Name] ),
    VAR ProductsToRank = [TopN Value]
    VAR SalesAmount = [Sales Amount]
    RETURN
        IF (
            SalesAmount > 0,
            VAR VisibleProducts =
                CALCULATETABLE (
                    VALUES ( 'Product' ),
                    ALLSELECTED ( 'Product'[Product Name] )
                )
            VAR Ranking =
                RANKX (
                    VisibleProducts,
                    [Sales Amount],
                    SalesAmount
                )
            RETURN
                IF (
                    Ranking > 0 && Ranking <= ProductsToRank,
                    Ranking
                )
        )
)
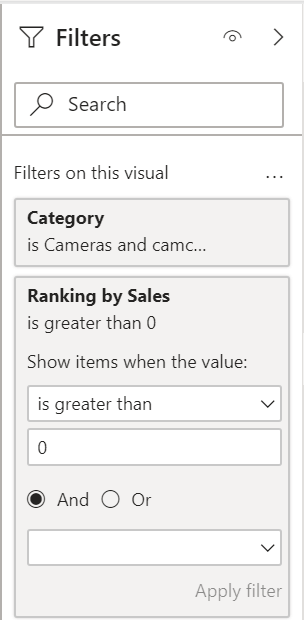
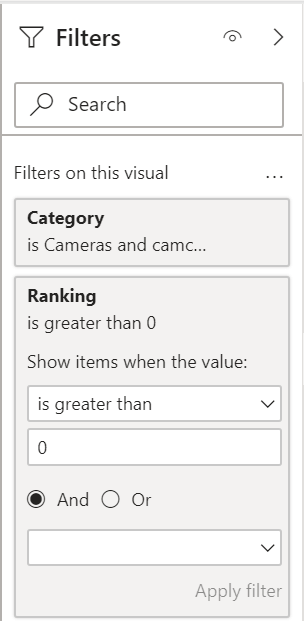
The VisibleProducts variable contains a list of products for the selection currently displayed in the visual. In the example, we have the top 3 products for each Product Category included in our report. The ranking that is returned is only up to the value selected in the TopN parameter – for this reason, we can use the result of Ranking by Sales to filter the visual, including only the products ranked in the 1-to-TopN Value range. We use a filter in the Power BI filter pane to accomplish this task.
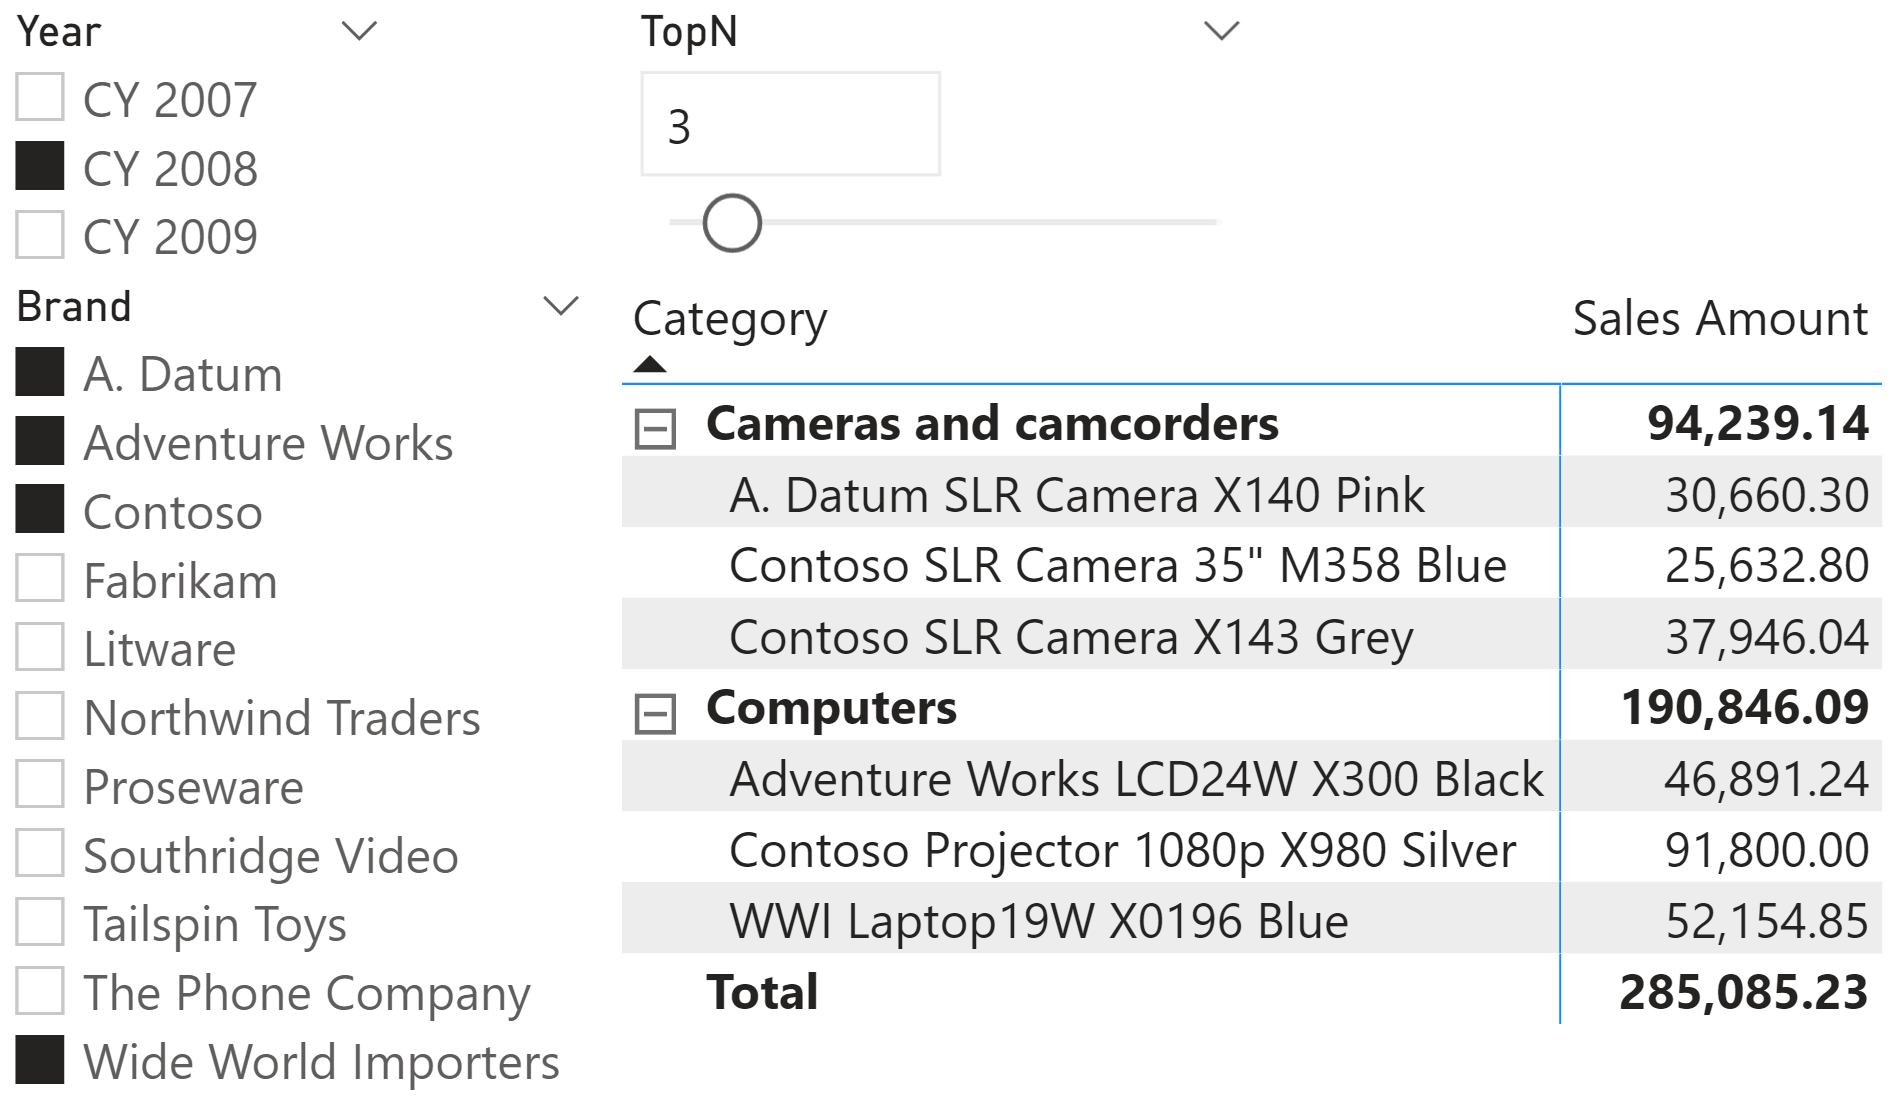
The Ranking by Sales measure can also be used to sort the report, as shown in the following screenshot.
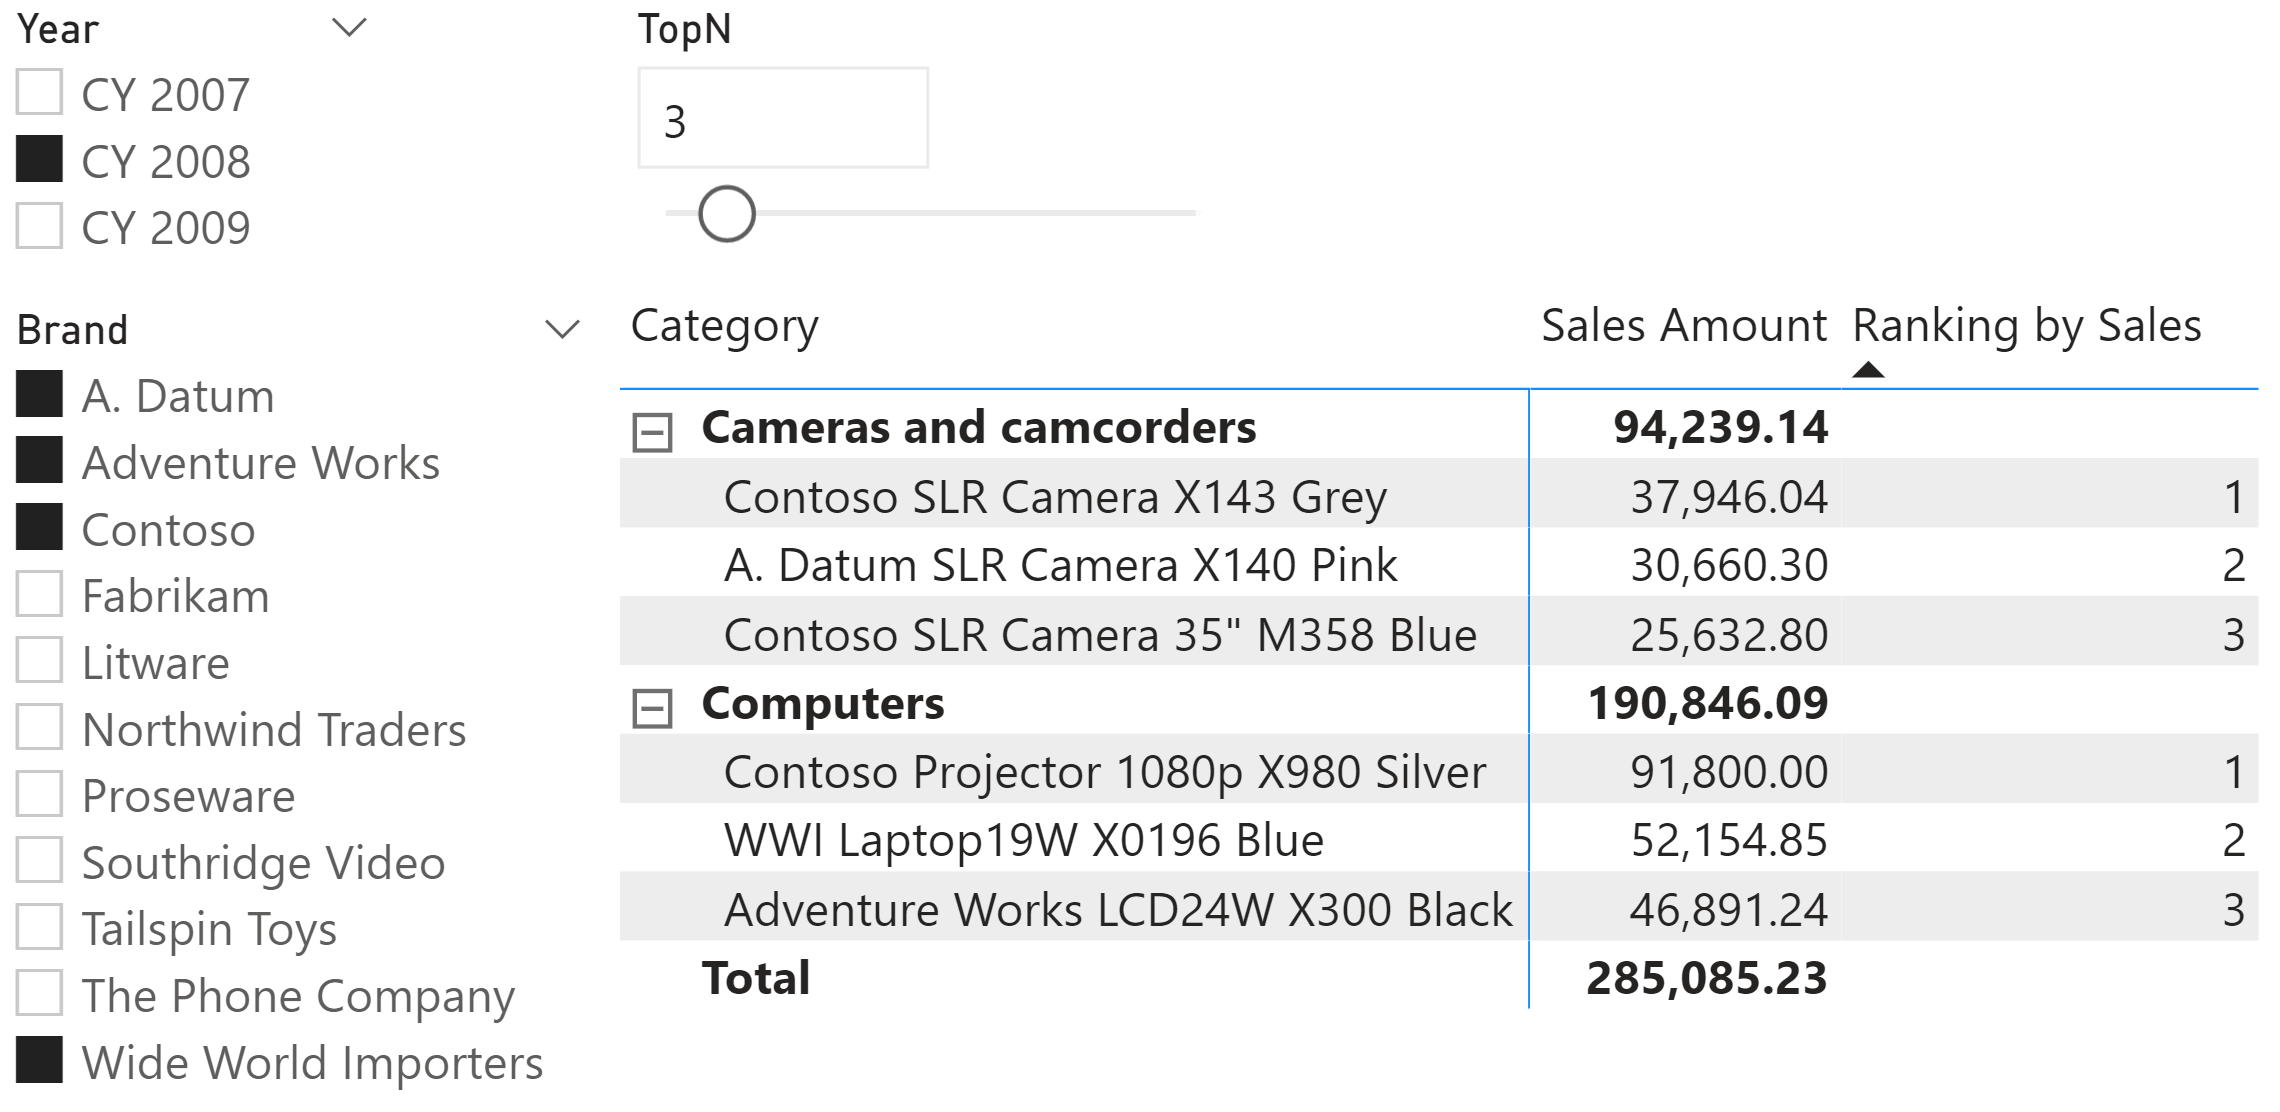
Even though in this last example you could use Sales Amount to sort the rows, later in the article you will see that using the Ranking by Sales measure is required to obtain an accurate sorting of the additional rows.
Showing a row with “Others”
The next step is to add a row with “Others”. We create a Product Names table that includes all the product names and an additional row with the string, “Others”:
Product Names =
UNION (
    ALLNOBLANKROW ( 'Product'[Product Name] ),
    { "Others" }
)
It is important to use ALLNOBLANKROW to avoid circular dependencies issues when creating a relationship. Indeed, the Product Names table is connected to the Product table through the Product Name column.
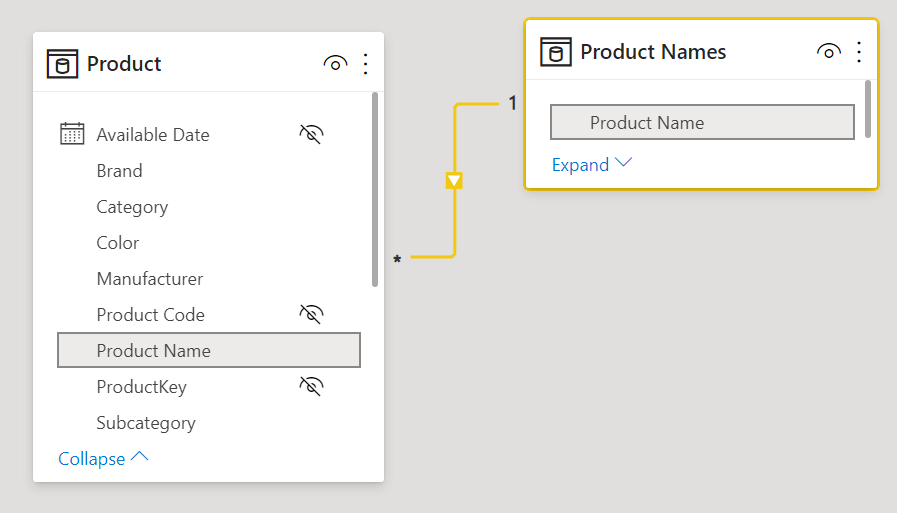
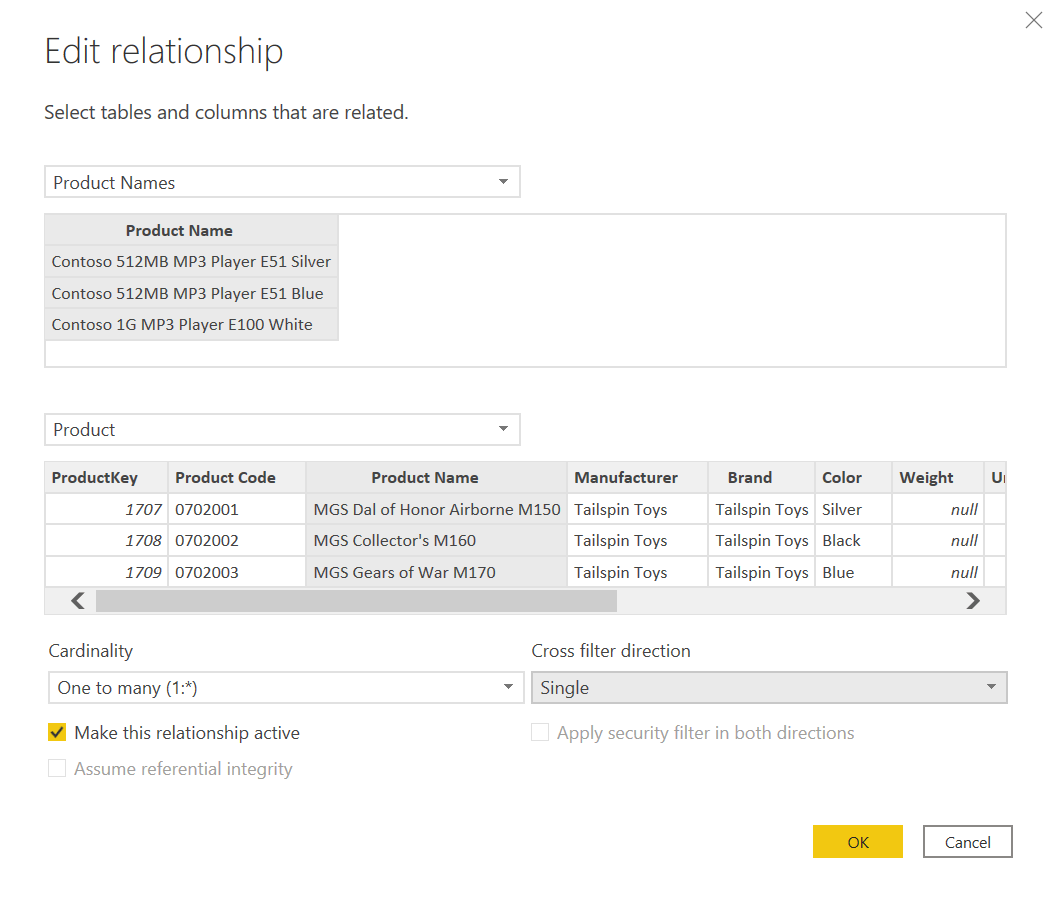
The relationship must be one-to-many with a single direction filter, going from Product Names to Product. By default, Power BI is likely to propose a one-to-one relationship. Make sure to set the relationship properties properly.
If we use ‘Product Names'[Product Name] instead of ‘Product'[Product Name] in the report, we also need to add a Ranking measure to see an additional “Others” row. Otherwise, the additional row would be hidden because the Sales Amount measure is still blank.
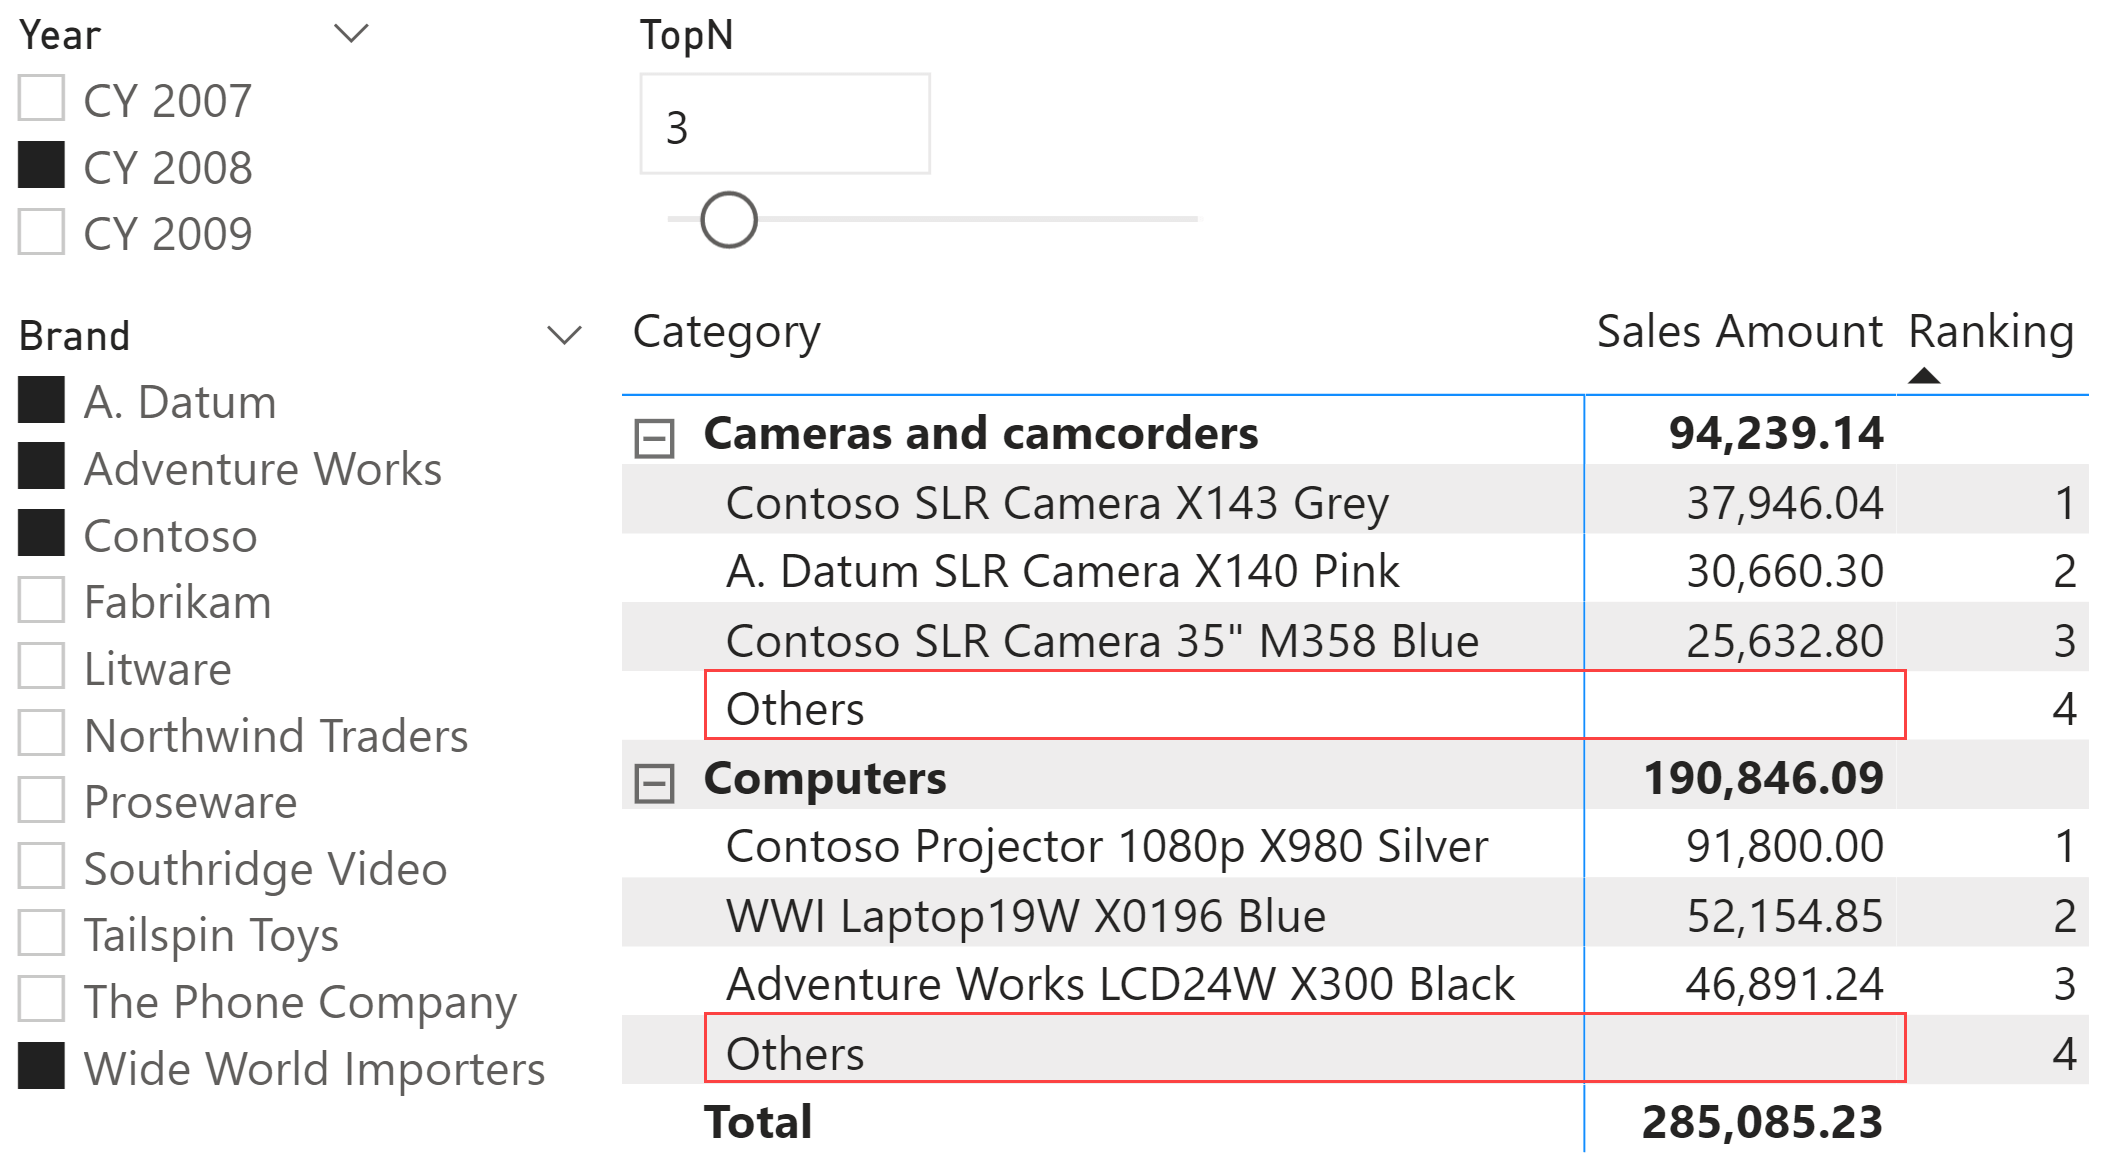
Every product name displayed in the report actually filters the corresponding product in the Product table. At this point, “Others” does not have any corresponding Sales Amount, because it does not filter any product – we will complete that calculation in the next step.
In order to display only the desired products, we use the technique we saw in the first step – albeit with a new version of the measure we use to filter and sort the products in the visual. We call this new measure, “Ranking”. As we had anticipated, the Ranking measure is also required in the previous screenshot in order to show the “Others” row, which would be hidden otherwise because the Sales Amount measure is blank. The Ranking measure is defined as follows:
Ranking :=
IF (
    ISINSCOPE ( 'Product Names'[Product Name] ),
    VAR ProductsToRank = [TopN Value]
    VAR SalesAmount = [Sales Amount]
    VAR IsOtherSelected =
        SELECTEDVALUE ( 'Product Names'[Product Name] ) = "Others"
    RETURN
        IF (
            IsOtherSelected,

            -- Rank for Others
            ProductsToRank + 1,

            -- Rank for regular products
            IF (
                SalesAmount > 0,
                VAR VisibleProducts =
                    CALCULATETABLE (
                        VALUES ( 'Product' ),
                        ALLSELECTED ( 'Product Names' )
                    )
                VAR Ranking =
                    RANKX (
                        VisibleProducts,
                        [Sales Amount],
                        SalesAmount
                    )
                RETURN
                    IF (
                        Ranking > 0 && Ranking <= ProductsToRank,
                        Ranking
                    )
            )
        )
)
When “Others” is selected, Ranking returns the number of products to be displayed, plus one. In the other cases, we use the technique explained in the previous step; we just make sure to use Product Names instead of Product to retrieve and manipulate the selection in the filter context. Now we use Ranking instead of Ranking by Sales to filter the visual.
Calculating Sales Amount for the “Others” row
In order to display the right Sales Amount in the “Others” row, we compute the sum of all the non-visible products. Most of the time, the report uses an additive measure, which makes it possible to compute the value of the “Others” row as the difference between the total of all the selected products and the products that have a ranking.
The Sales Amt measure computes the regular Sales Amount measure when a single product is selected, and the difference between all the products and the top N products when the “Others” row is selected:
Sales Amt :=
VAR SalesOfAll =
    CALCULATE (
        [Sales Amount],
        REMOVEFILTERS ( 'Product Names' )
    )
RETURN
    IF (
        NOT ISINSCOPE ( 'Product Names'[Product Name] ),

        -- Calculation for a group of products
        SalesOfAll,

        -- Calculation for one product name
        VAR ProductsToRank = [TopN Value]
        VAR SalesOfCurrentProduct = [Sales Amount]
        VAR IsOtherSelected =
            SELECTEDVALUE ( 'Product Names'[Product Name] ) = "Others"
        RETURN
            IF (
                NOT IsOtherSelected,

                -- Calculation for a regular product
                SalesOfCurrentProduct,

                -- Calculation for Others
                VAR VisibleProducts =
                    CALCULATETABLE (
                        VALUES ( 'Product' ),
                        ALLSELECTED ( 'Product Names'[Product Name] )
                    )
                VAR ProductsWithSales =
                    ADDCOLUMNS (
                        VisibleProducts,
                        "@SalesAmount", [Sales Amount]
                    )
                VAR SalesOfTopProducts =
                    SUMX (
                        TOPN (
                            ProductsToRank,
                            ProductsWithSales,
                            [@SalesAmount]
                        ),
                        [@SalesAmount]
                    )
                VAR SalesOthers =
                    SalesOfAll - SalesOfTopProducts
                RETURN
                    SalesOthers
            )
    )
There are three main branches in this calculation; they calculate a group of products, a regular product, or the Others row. The latter is the more complex calculation, which is optimized by computing the difference between the amount for all the products in the remaining filter context and the sum of the top three products. The measures have been optimized for performance, thus reducing the calculations required – for example, by reducing the list in VisibleProducts before performing the calculation of the top three products.
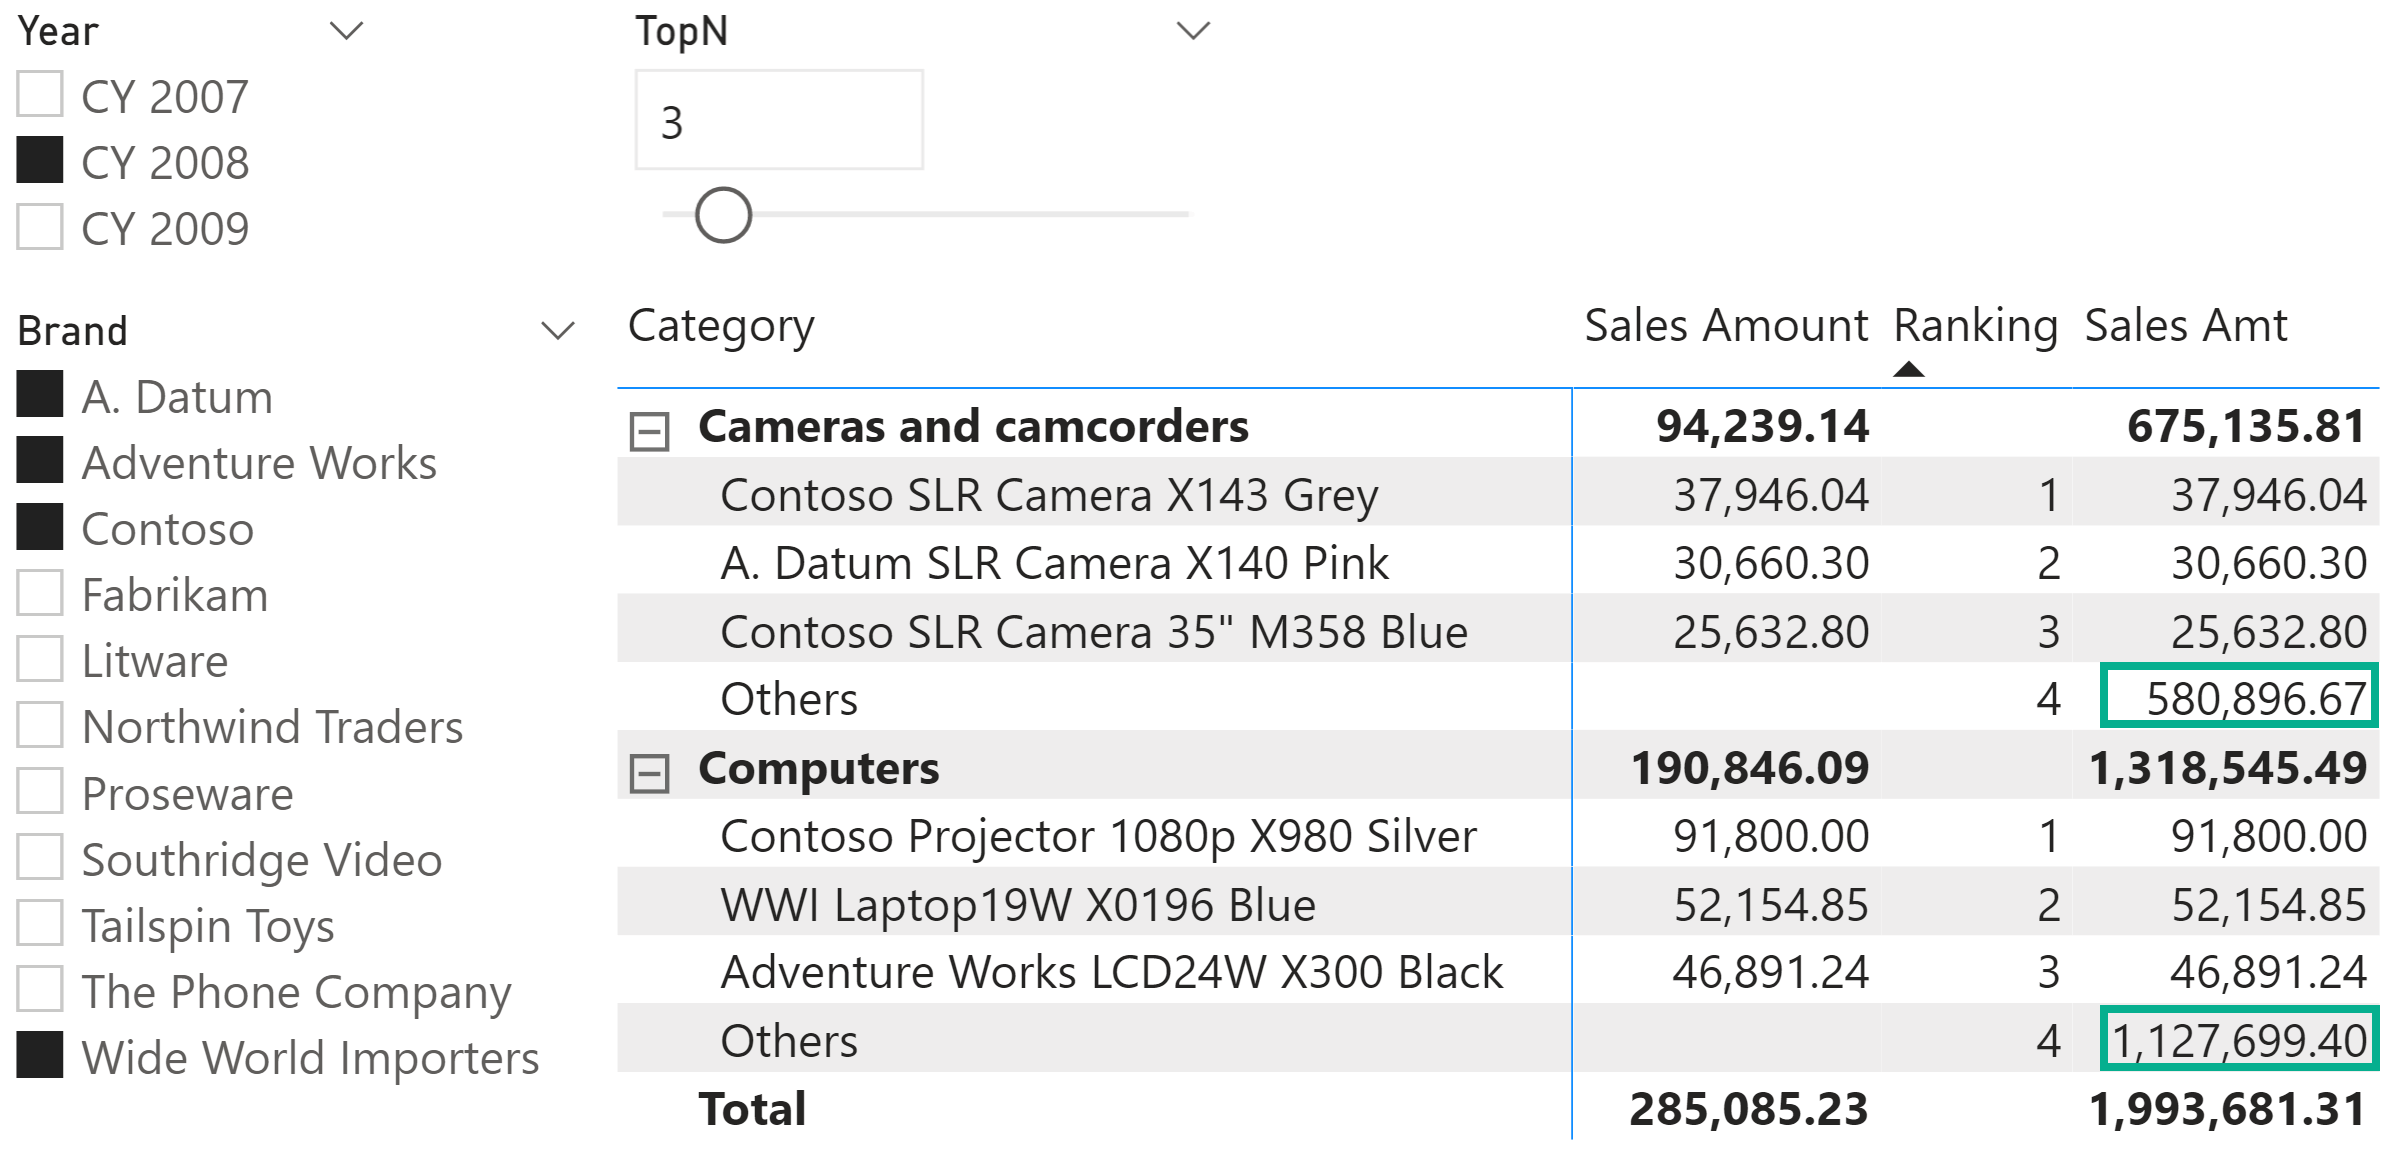
The ranking already provides the right sort order for the products in each category, placing the Others row after the top three products. The remaining step is the custom format of Sales Amt to highlight the Others row, described in the last section.
In case you use a non-additive measure, the sample file contains the complete definition of the Sales Amt Non Additive measure, where the calculation for Others is implemented by calculating the original Sales Amount measure and filtering out all the other products. This implementation is more flexible, but more expensive from a computational point of view:
Sales Amt Non Additive :=
... // the initial part is identical to Sales Amt

                -- Calculation for Others
                VAR VisibleProducts =
                    CALCULATETABLE (
                        VALUES ( 'Product' ),
                        REMOVEFILTERS ( 'Product Names'[Product Name] )
                    )
                VAR ProductsWithSales =
                    ADDCOLUMNS (
                        VisibleProducts,
                        "@SalesAmount", [Sales Amount]
                    )
                VAR FilterTopProducts =
                    TOPN (
                        ProductsToRank,
                        ProductsWithSales,
                        [@SalesAmount]
                    )
                VAR FilterOthers =
                    EXCEPT (
                        ProductsWithSales,
                        FilterTopProducts
                    )
                VAR SalesOthers =
                    CALCULATE (
                        [Sales Amount],
                        FilterOthers,
                        REMOVEFILTERS ( 'Product Names'[Product Name] )
                    )
                RETURN
                    SalesOthers
            )
    )
Highlighting Sales Amt for the “Others” row
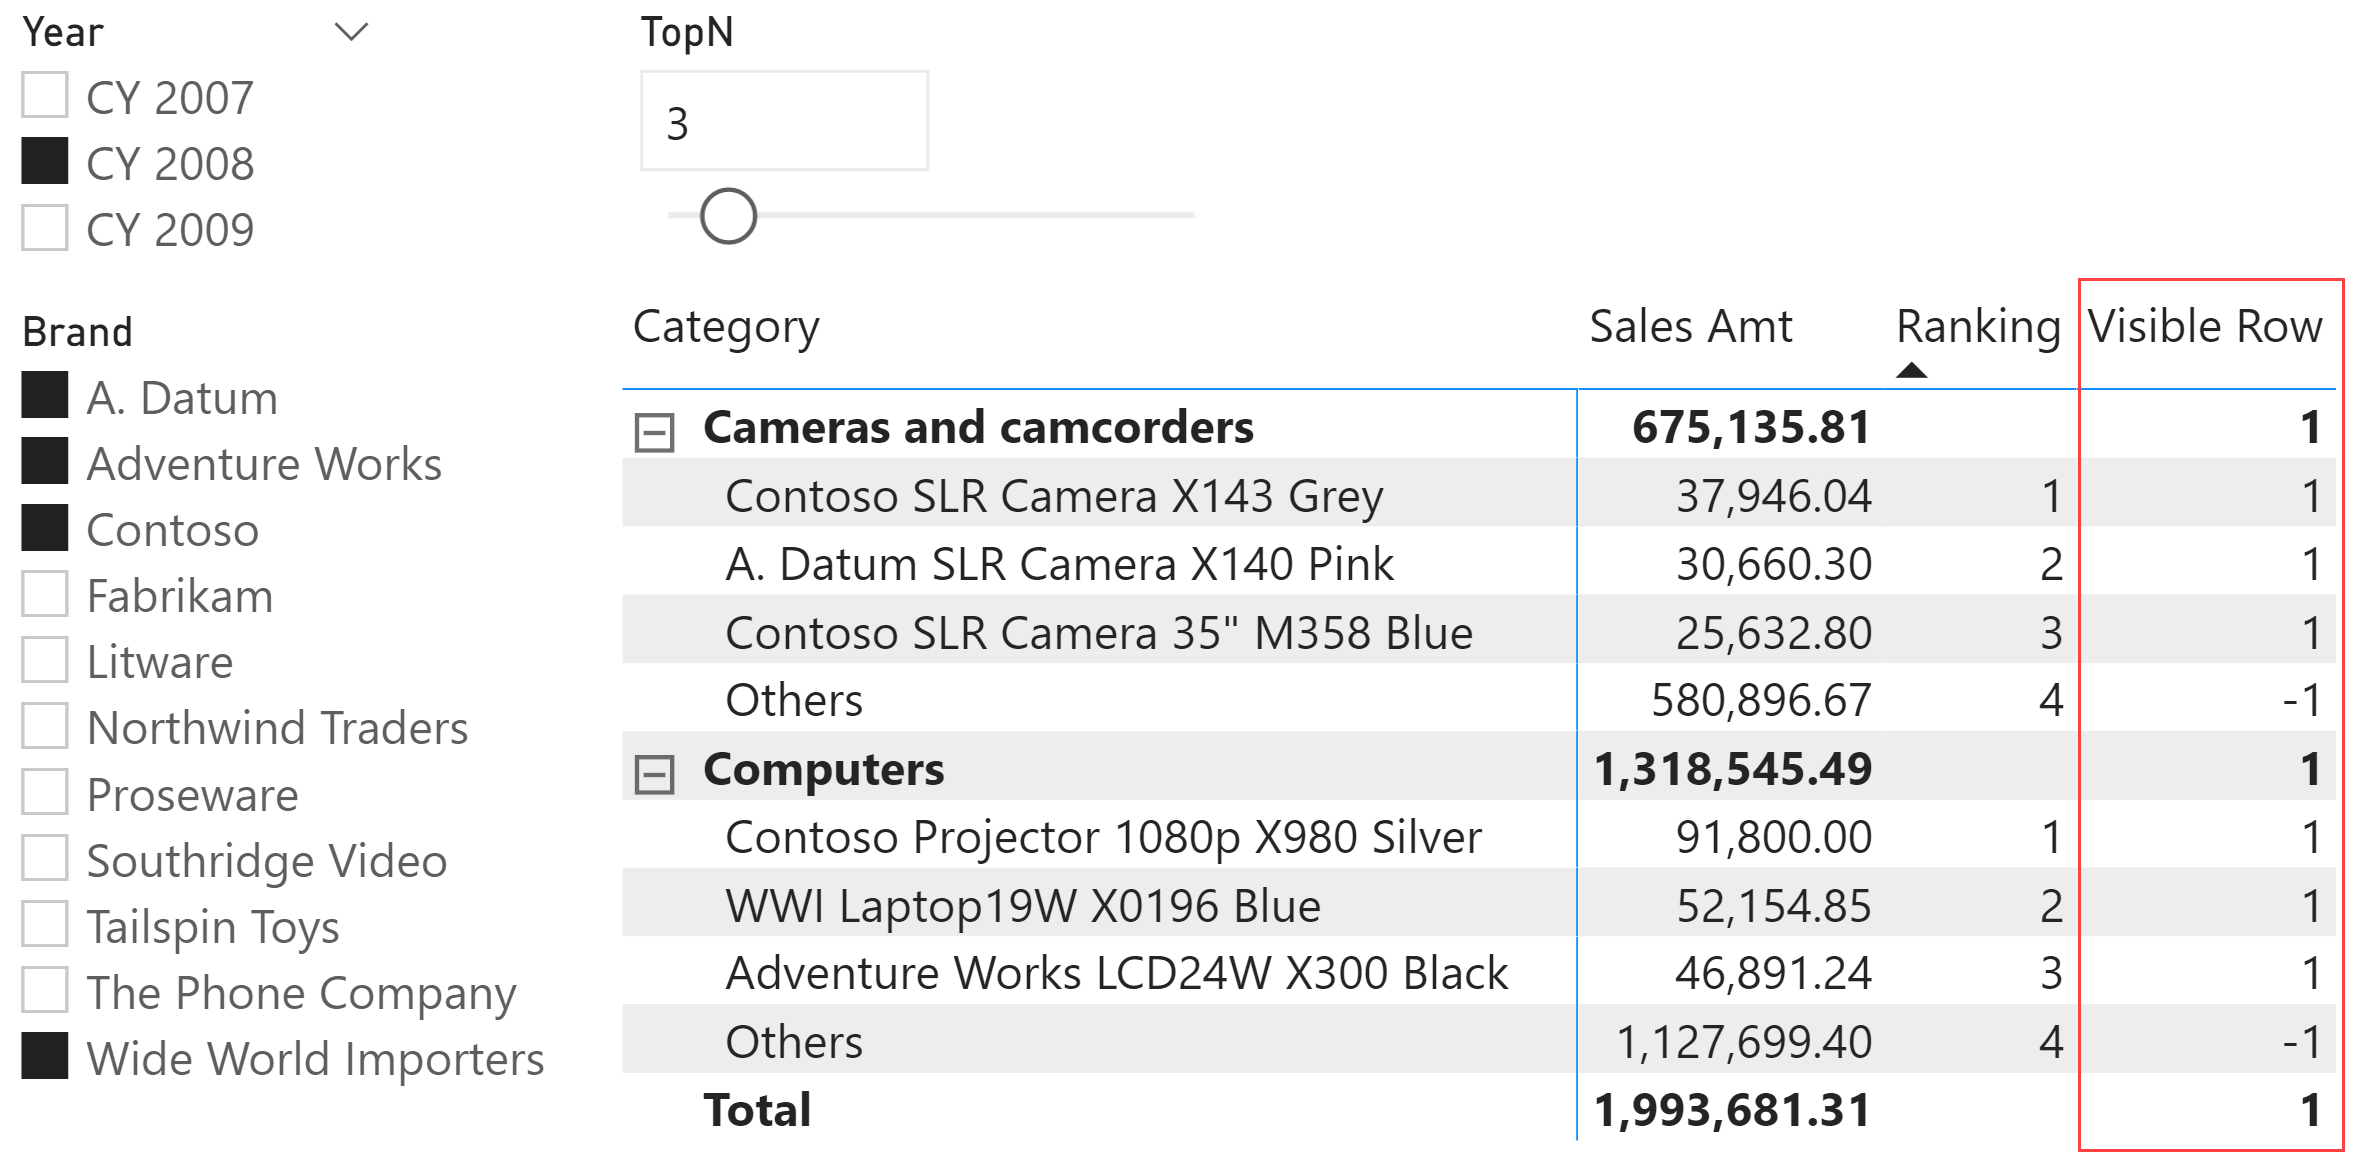
In order to highlight the Sales Amt measure in the “Others” row, we leverage the conditional formatting in Power BI. To simplify the business logic of the conditional formatting, we create a Visible Row measure that we can use to identify the “Others” row and to replace the visual filter condition previously based on the Ranking measure. The goal is to return 1 for the top three products and -1 for the “Others” row. Returning blank or 0 means that the row should be hidden. The filter condition on the visual is now, “Visible Row is not 0” instead of “Ranking is greater than 0”.
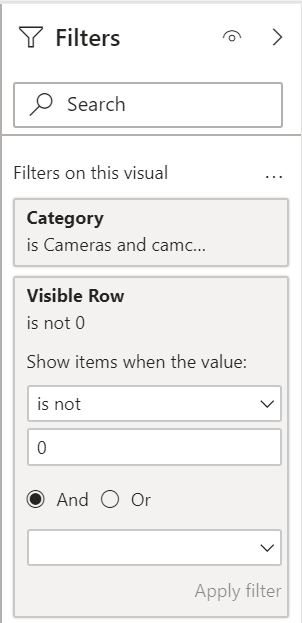
The following screenshot clarifies the expected value of Visible Row. The expected value is -1 only for “Others” and 1 for the top three products and for any group of products (Category subtotal and Grand Total in this example).
The Visible Row Simplified measure is a simple implementation of the required business logic. While this code is simpler to read, it is not the more optimized version:
Visible Row Simplified :=
-- Simpler version (up to 10% slower)
VAR Ranking = [Ranking]
VAR TopNValue = [TopN Value]
RETURN
    SWITCH (
        TRUE,
        NOT ISINSCOPE ( 'Product Names'[Product Name] ), 1,
        ISBLANK ( Ranking ), BLANK(),
        Ranking <= TopNValue, 1,
        Ranking = TopNValue + 1, -1,
        0
    )
The actual implementation of Visible Row implements the same business logic in a more efficient way, which is less readable:
Visible Row :=
VAR Ranking = [Ranking]
VAR TopNValue = [TopN Value]
VAR Result =
    IF (
        NOT ISBLANK ( Ranking ),
        ( Ranking <= TopNValue ) - ( Ranking = TopNValue + 1 )
    )
RETURN
    Result
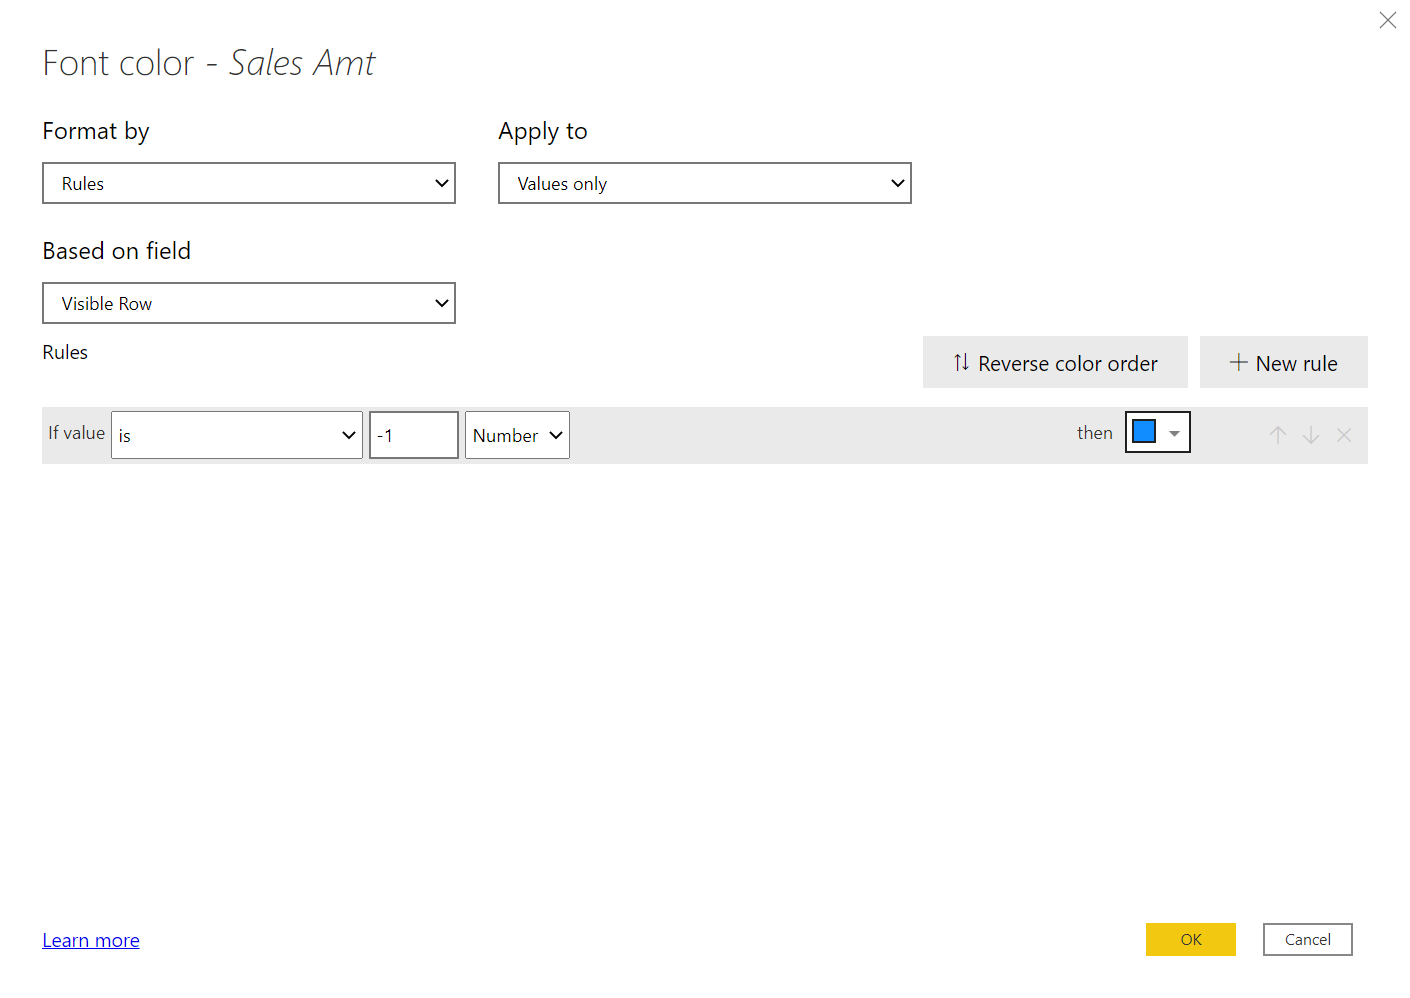
The Visible Row measure can be used in the conditional formatting logic for the Font color of the Sales Amt measure in the matrix visual by defining a rule based on the value -1 as described in the following screenshot.
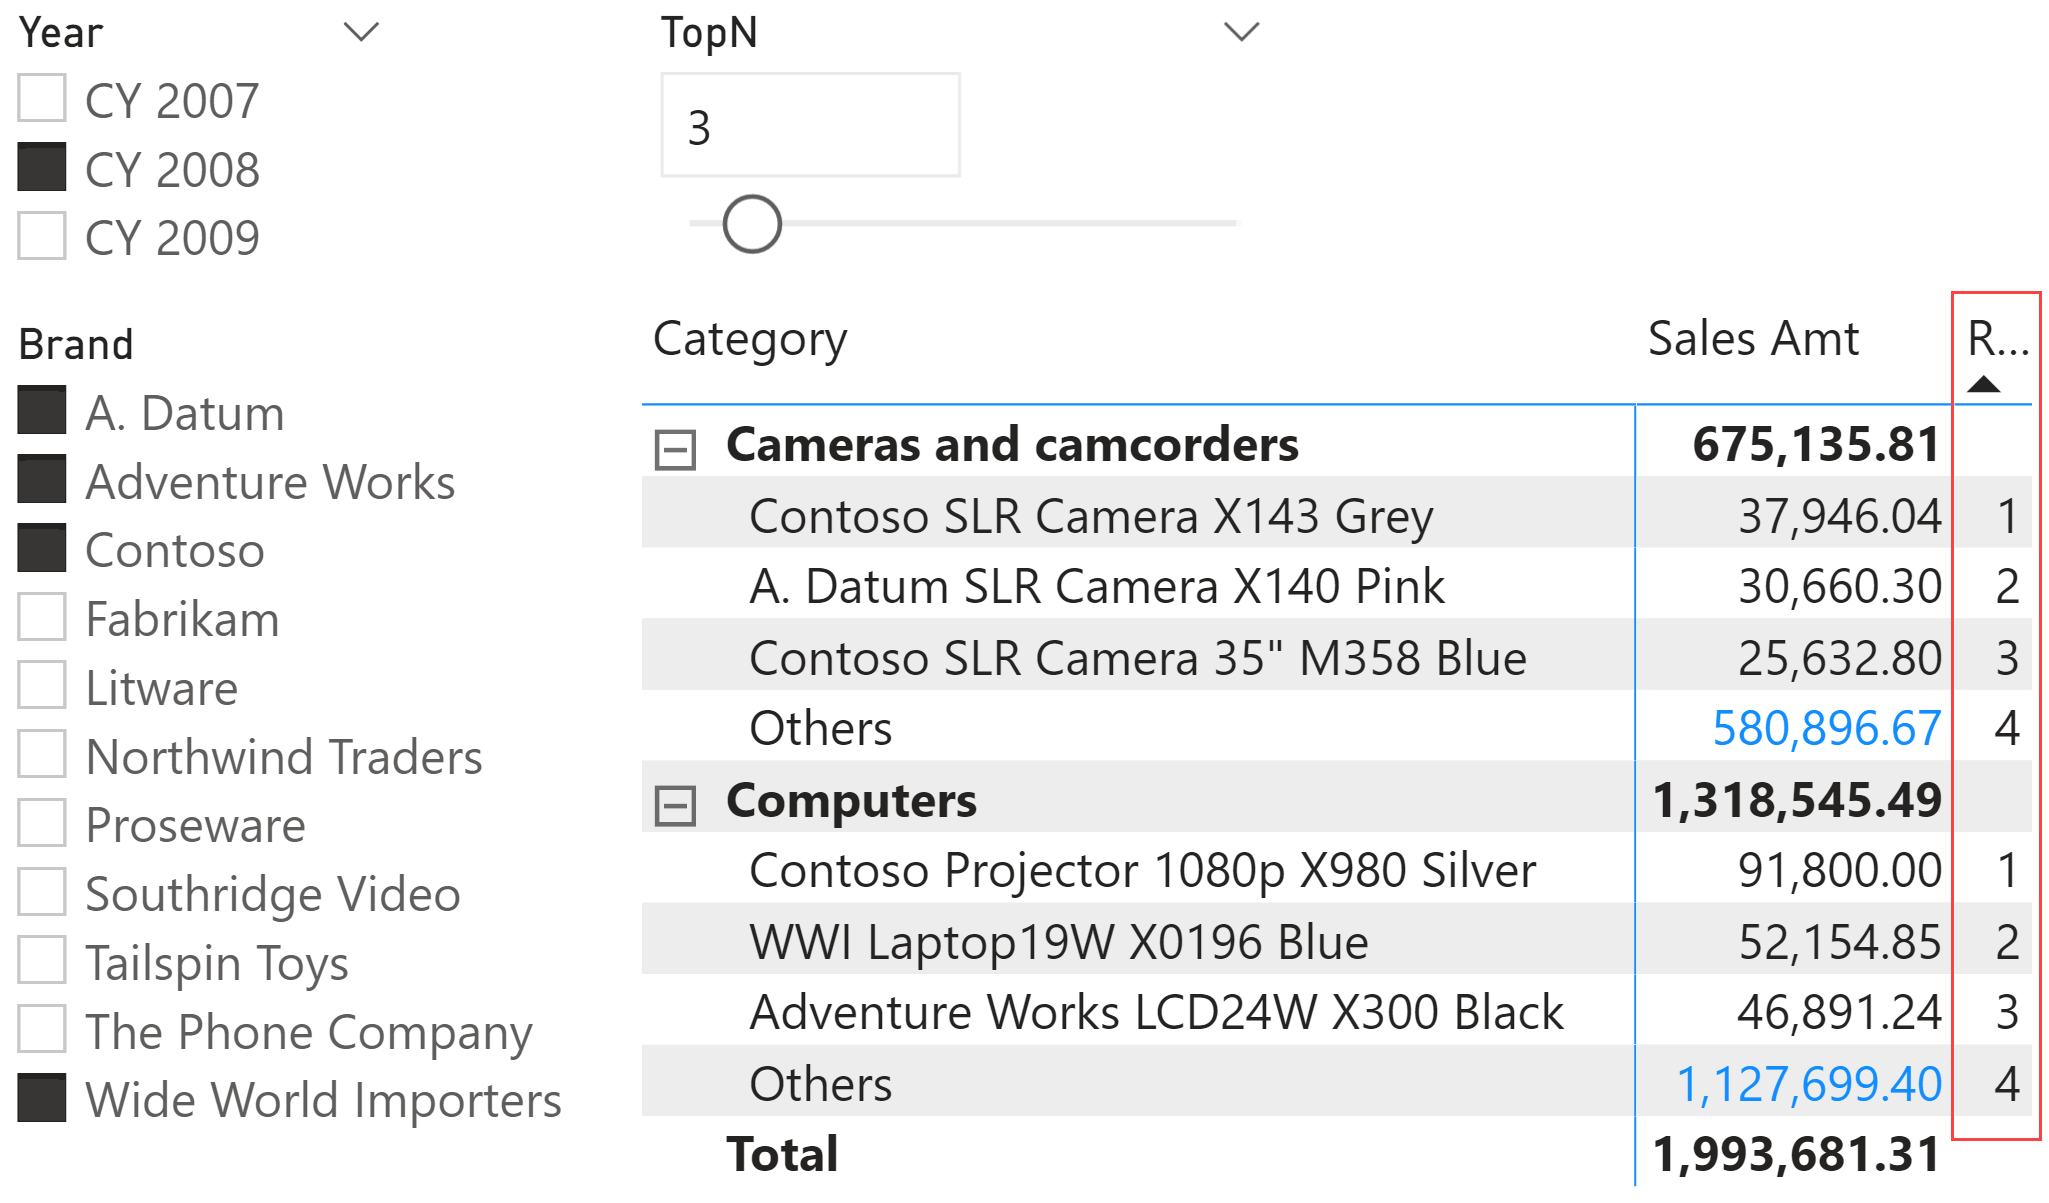
To refine the visual, first remove the Visible Row measure from the Values area of the matrix. The Visible Row measure is still applied as a filter to the visual. Then, minimize the column width of the Ranking header so that you can still use the column to sort the rows of the matrix – even though the ranking value is no longer visible. Please note that you have to disable the Word wrap setting of the Column headers visualization properties: by default, the Word wrap setting is enabled and increases the height of the column header if you shrink the column width more than the length of the column name. The following screenshot shows the Ranking column shrunk to a small width, but you can choose to reduce it to just a few pixels, thus making it completely invisible.
Conclusions
By adding a table with the list of product names and an additional “Others” row, you can obtain a visualization that satisfies many reporting requirements based on a filter of “top products” or “top customers”. Grouping the elements not included in the top selection into a single element that is calculated dynamically can simplify your data exploration.
The code included in the article has been optimized for performance. The companion video available describes in more detail the technique used in this example; it uses more educational code that does not have all the optimizations included in the sample file you can download.
Returns all the rows except blank row in a table, or all the values in a column, ignoring any filters that might have been applied.
ALLNOBLANKROW ( <TableNameOrColumnName> [, <ColumnName> [, <ColumnName> [, … ] ] ] )