 Alberto Ferrari
Data modeling capabilities in Power BI are very powerful. Sometimes, this power is used without considering its possible side effects. One feature that is often misused is the bidirectional cross-filter in relationships. You can find a description of risks and best practices in the Understanding Relationships in Power BI video and the Bidirectional relationships and ambiguity in DAX article. There is a feature in the June 2019 update of Power BI that greatly mitigates the need for bidirectional cross-filters: we can apply visual filters to slicers, so it is possible to filter slicers by using a measure. Let us see how this feature works and why it is so relevant.
In the following report, one slicer is filtering the customers by name, another slicer is showing colors and two matrices are showing sales amount by brand and by color. In the customer slicer, Amanda Allen is selected.
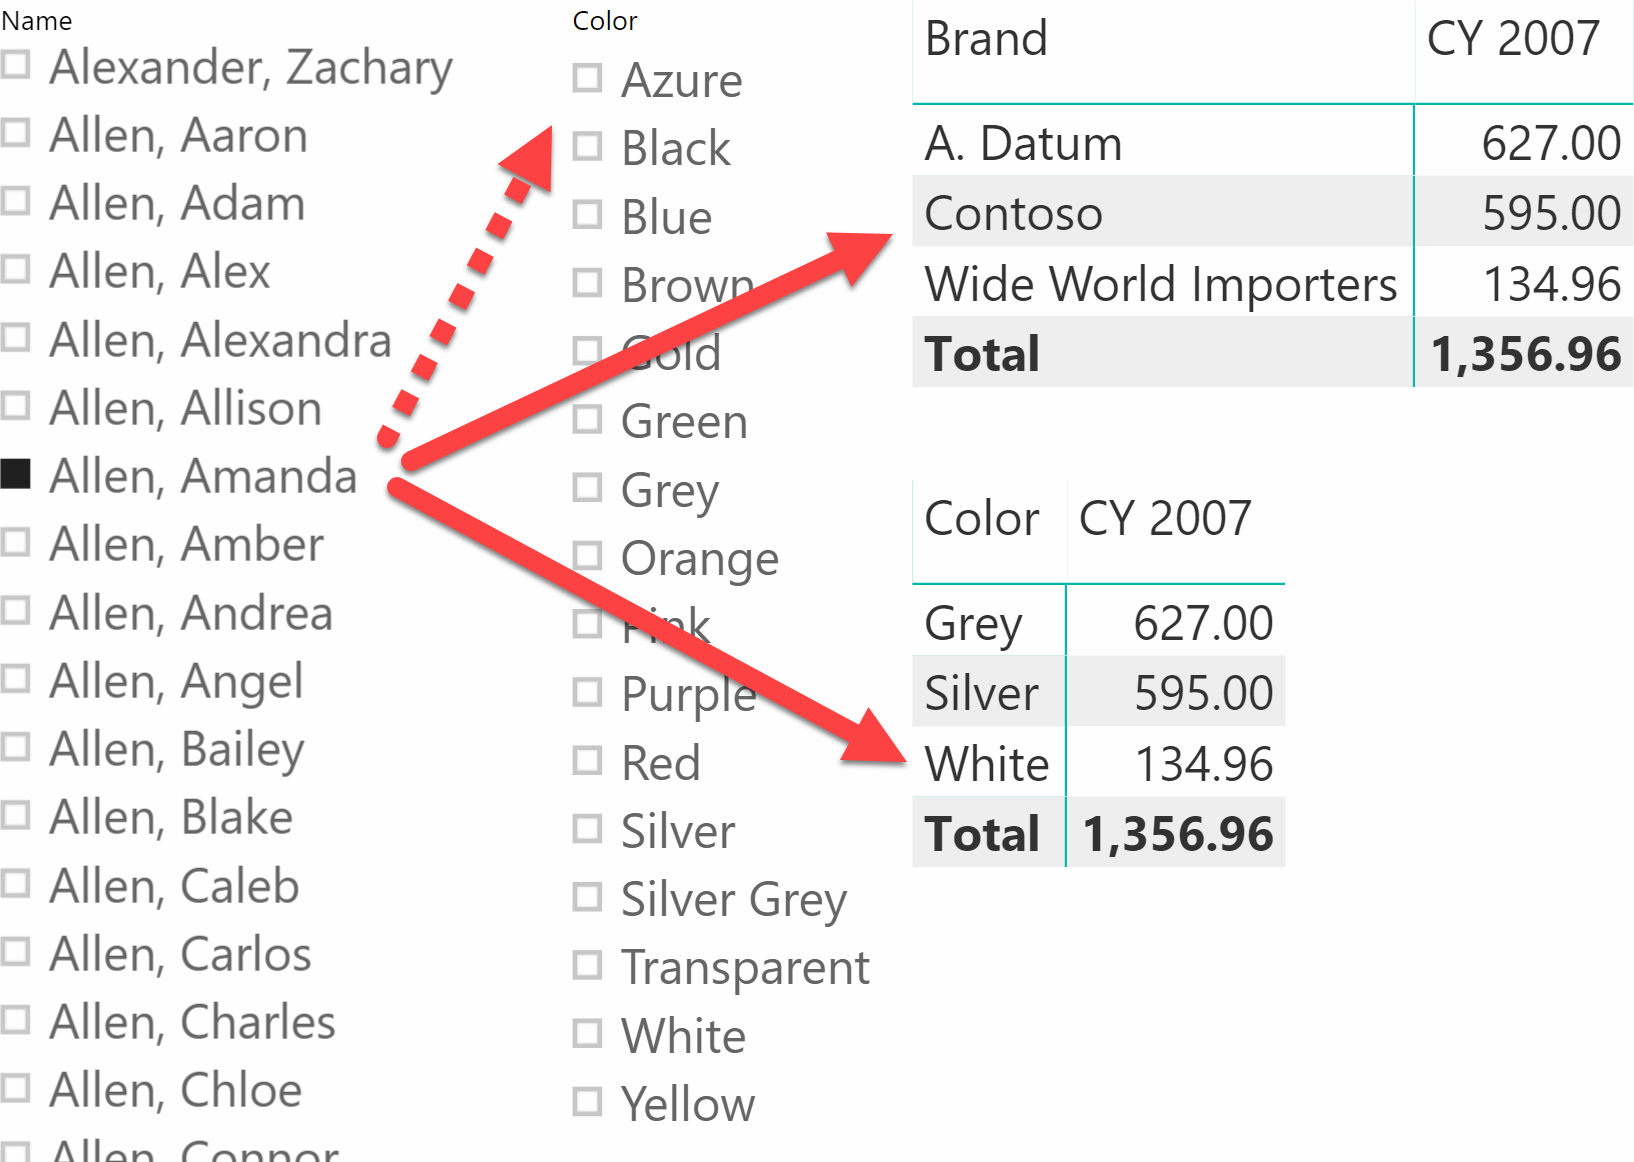
The noticeable thing about the behavior of the slicer is that the two matrices are showing only the brands and colors purchased by Amanda. Yet, the Color slicer is still showing all the colors, even though we know Amanda only purchased three colors: Grey, Silver and White.
The reason is that the matrices, like most Power BI visuals, hide rows if the measure they are showing produces a blank. Because Amanda did not buy any pink product, the value of Sales Amount for Pink results in a blank, therefore the matrix removes the pink color from its result. Prior to the May 2019 release of Power BI, slicers did not display this behavior because slicers did not have a measure to evaluate – they would only show a list of values from a column; Moreover, visual-level filters were not allowed in slicer visuals whereas they were available in other visuals such as charts, tables, and matrices.
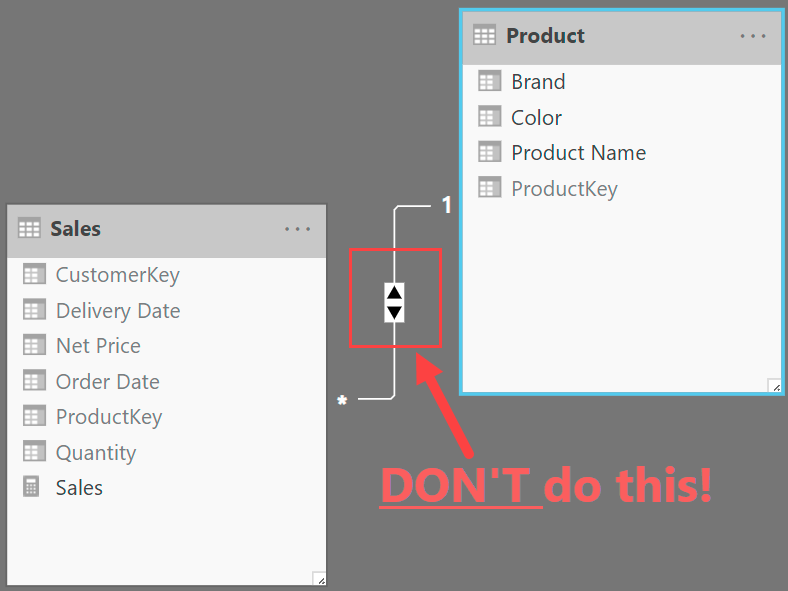
For these reasons, several developers relied on bidirectional filters to keep slicers in sync. By activating the bidirectional cross-filter in the relationship between Sales and Products, it is possible to filter the color by the customer – the filter context only shows colors related to products sold to the selected customers. Nevertheless, as we have already explained in a previous article, using bidirectional cross-filtering for syncing slicers is a very bad idea, putting your model at high risk of producing incorrect results.
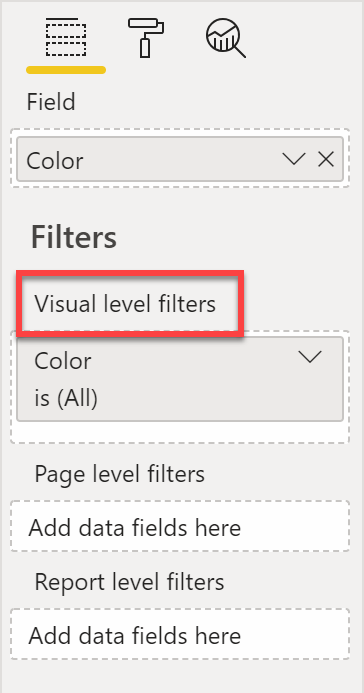
Power BI now allows the addition of visual-level filters to a slicer, including not only the column being sliced, but any measure:
Therefore, how can we hide colors that Amanda did not purchase? It is enough to use a measure that evaluates to blank when there are no sales for Amanda. Sales Amount works just fine for this:
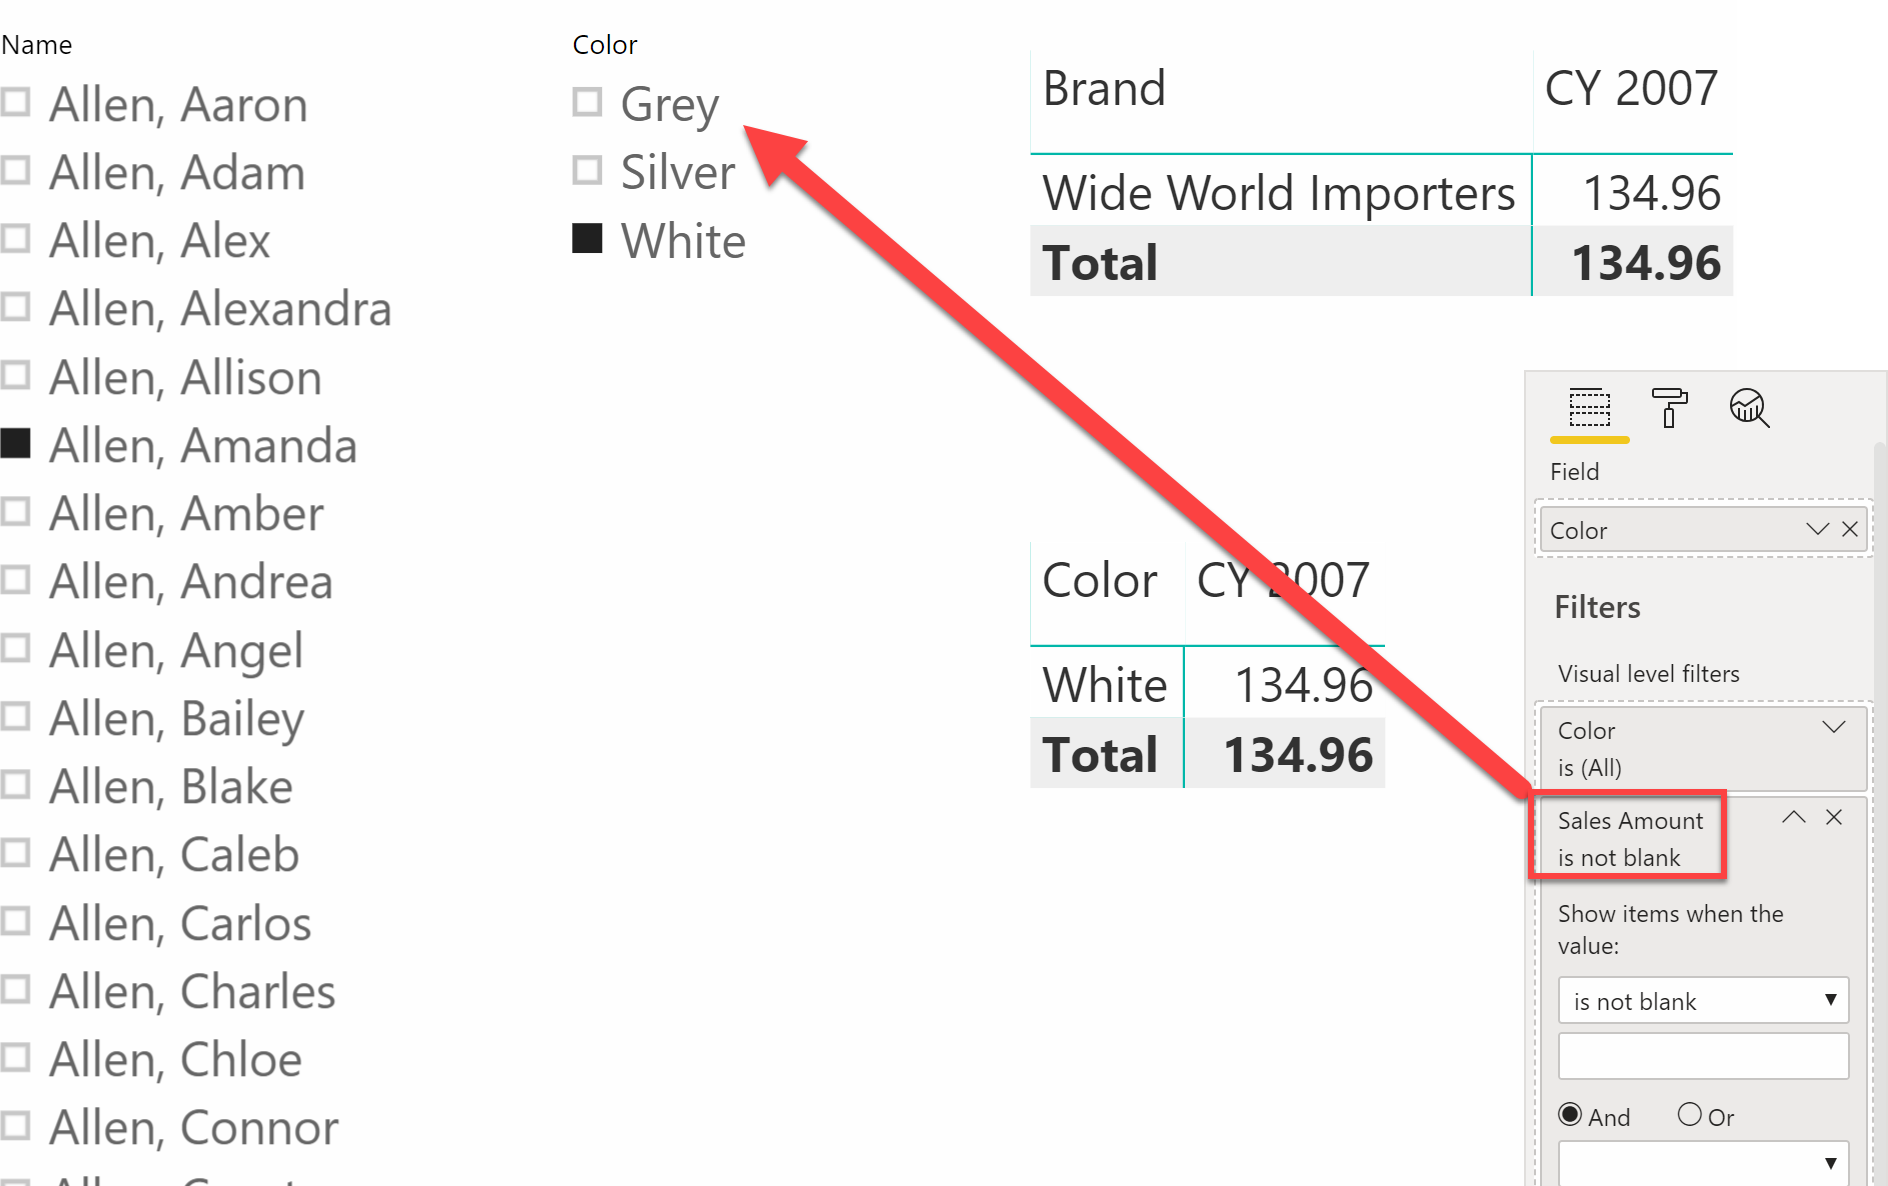
By adding the visual filter that requires Sales Amount not to be blank, all the colors resulting in no sales disappear from the slicer. The result is very neat.
As we said, the feature by itself is not so exciting. It is useful, but not that powerful. What makes it a huge step forward in the quality of reporting is that users no longer need to enable bidirectional cross-filtering to achieve the same goal. If you want the slicers to be synced, just rely on a visual-level filter, thus not messing up the model with a bidirectional cross-filter.
Here is the first call-to-action for you: if you have any bidirectional filter in your models just for the purpose of syncing slicers, stop reading; open one of your models and make the slicer sync by using this feature, disabling bidirectional cross-filters. Once you have seen how easy it is to get rid of bidirectional cross-filtering from your models, you can come back here, where we move forward with some examples of how to use visual filters in slicers to produce even more interesting reports.
One interesting question before moving forward, is whether choosing the Sales Amount measure to hide the colors was a smart choice or not. The answer is simple: no. There is no need to compute Sales Amount for each color in the slicer if the only goal of the measure is to hide colors with no sales. The best choice is to use a simpler NOT ISEMPTY expression instead, which is faster than Sales Amount.
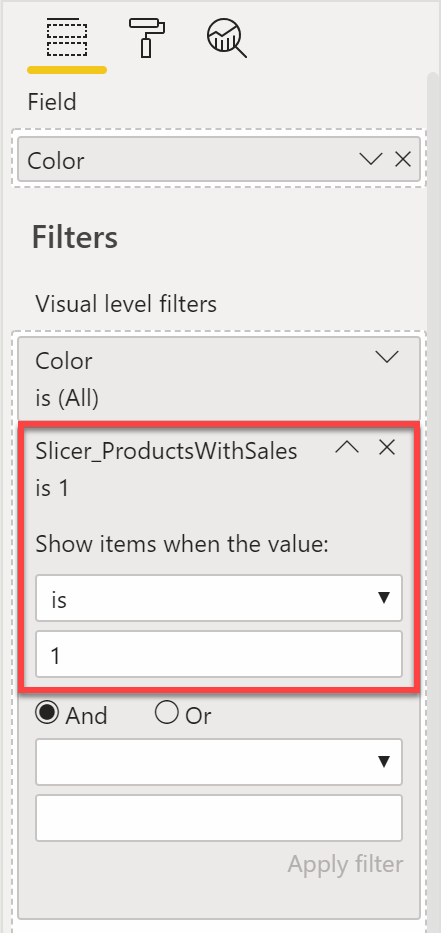
The following measure fits better as a slicer filter:
Slicer_ProductsWithSales = INT ( NOT ISEMPTY ( Sales ) )
The result of this measure is either 0 or 1. The slicer should only show those items that return 1 to this measure, hiding the ones returning 0. The conversion to an integer is required to enable the comparison logic in the visual filter, which would not work for a Boolean value (True/False).
Because a complex model likely contains several of these tool measures created just to filter slicers, prefixing them with Slicer or any other name that makes them easily recognizable is a good practice. Another option would be creating a Slicers table (hidden if the model is not published for other reports) to host all these measures, which helps avoid having to expose these measures in other tables.
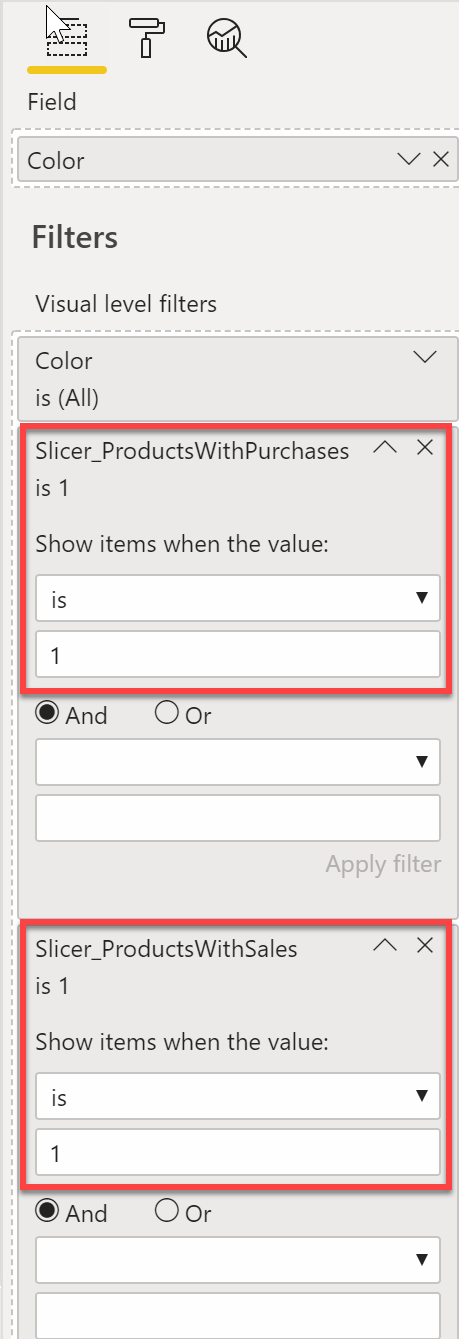
What happens if the slicer should only show the colors for which there are both sales and purchases? Sales Amount and Purchases Amount are measures being computed in two different tables. The first option is using two measures:
Slicer_ProductsWithSales = INT ( NOT ISEMPTY ( Sales ) )
Slicer_ProductsWithPurchases = INT ( NOT ISEMPTY ( Purchases ) )
Both measures should be conditions in the visual filter of the slicer. Multiple filters in the same visual are put in a logical AND, so users will only be able to select colors of products that are present in both the Sales and Purchases tables.
This technique works fine if you need to put two different conditions in a logical AND. If you want the slicer to show all the colors that are present in either Sales OR Purchases, then you need a dedicated measure to apply the filter:
Slicer_ProductsWithPurchasesOrSales =
    INT (
        NOT ISEMPTY ( Sales )
        ||
        NOT ISEMPTY ( Purchases )
    )
Similar to the previous slicer measures, this measure also returns 1 if there are rows in either Sales or Purchases – so the corresponding item should be visible in the slicer – and 0 if the item should be hidden.
Using a single measure makes the overall report editing experience a bit better, and it gives you greater control in the slicer visualization – you can implement more complex logic if necessary.
The possibilities of visual filters with slicers are endless; the only limit is your imagination. For example, an interesting usage is a slicer that only shows the top 5 products in a selected time period.
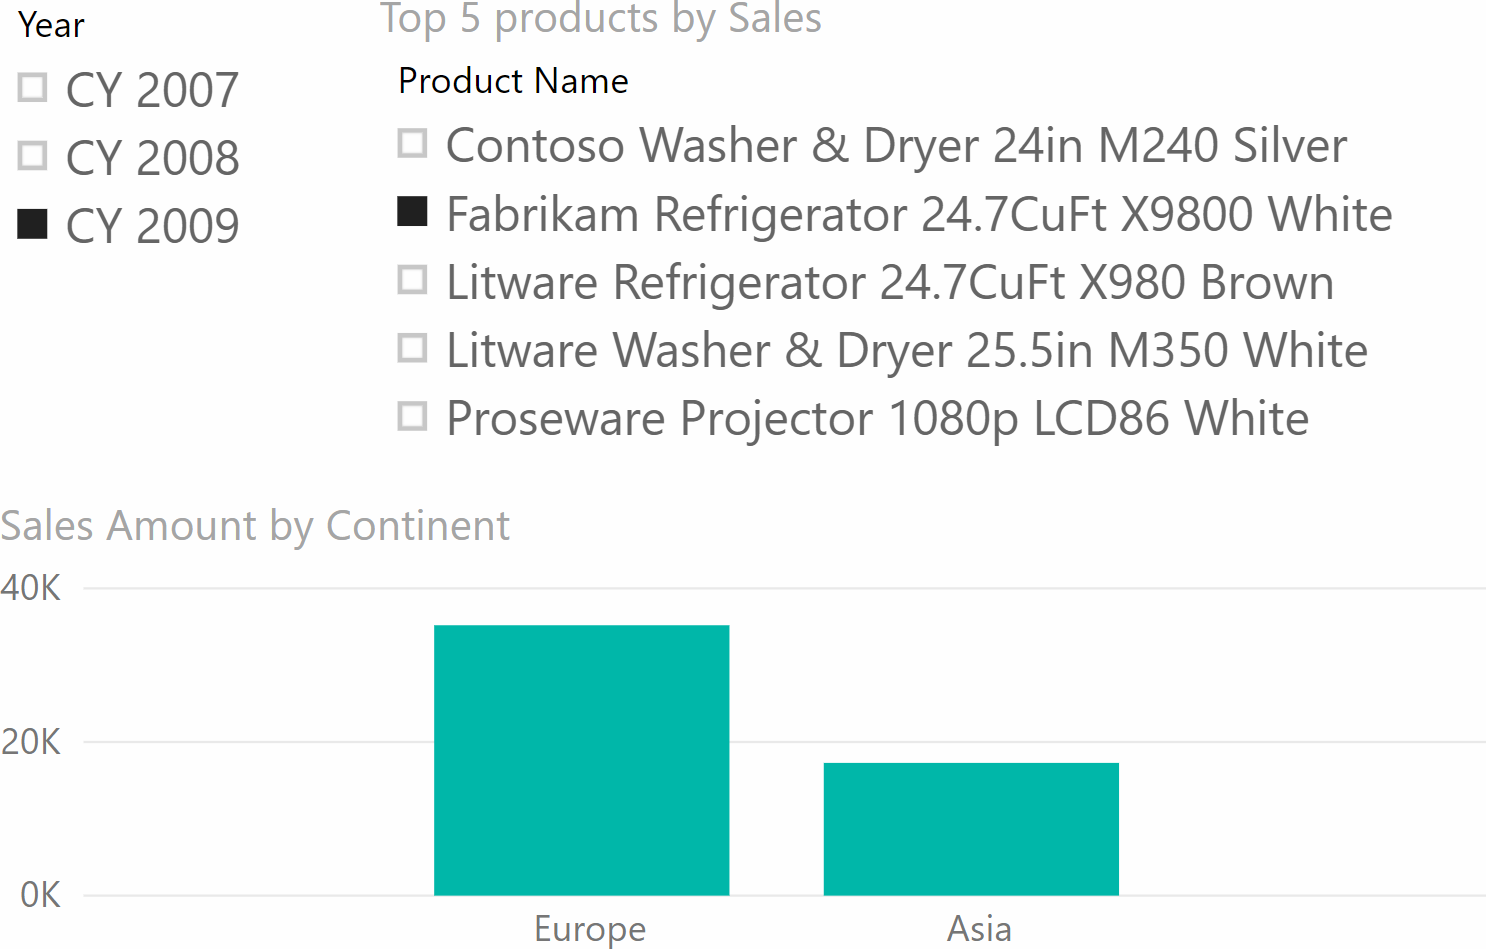
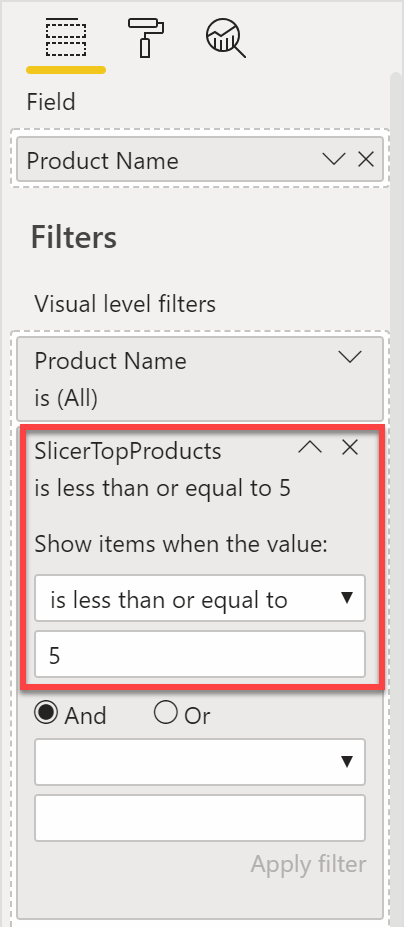
In this case, the measure that filters the slicer cannot be a simple NOT ISEMPTY . Instead, it uses RANKX to provide the ranking of the product against the selected ones:
SlicerTopProducts := RANKX ( ALLSELECTED ( 'Product' ), [Sales Amount] )
The visual filter then requires the measure to be less than or equal to five.
RANKX is an expensive function. Using it to filter slicers negatively affects dashboard performance. This is not to say that you should avoid it at all. It is an interesting feature that – when used with care – lets you create gorgeous dashboards and reports. If you use it without care, then the dashboard will be gorgeous, but also very slow.
Conclusions
Visual filters for slicers are an awesome addition to Power BI. We not only foresee the benefit of now being able to reduce the content of a slicer to only the useful values. To us, the greatest benefit is that users now have a solid option to keep the slicers in sync, without having to enable bidirectional cross-filtering in the data model.
That’s one small step for Power BI, one giant leap for the quality of your reports.
Returns true if the specified table or table-expression is Empty.
ISEMPTY ( <Table> )
Checks whether all arguments are TRUE, and returns TRUE if all arguments are TRUE.
AND ( <Logical1>, <Logical2> )
Returns TRUE if any of the arguments are TRUE, and returns FALSE if all arguments are FALSE.
OR ( <Logical1>, <Logical2> )
Returns the rank of an expression evaluated in the current context in the list of values for the expression evaluated for each row in the specified table.
RANKX ( <Table>, <Expression> [, <Value>] [, <Order>] [, <Ties>] )