Some time ago, I wrote a post about how to handle Parent/Child hierarchies in PowerPivot 1.0. It was pretty intricate, because P/C are not handled natively in PowerPivot. Now, with the advent of Denali, Microsoft gave us all the functions needed to handle P/C in a convenient way. Kasper has already wrote a nice post about P/C here. His post is very informative and I suggest you reading it to look at all the P/C functions. In this post, I will need to repeat something he has already said but, hopefully, I will add some more insights into the DAX language solving a small issue that still exists with Parent/Child hierarchies, at least in CTP3.
Let us start with the data model. We have this data model (wow, take a look at how wonderful is the the new graphical view of tables in PowerPivot… great job guys!):

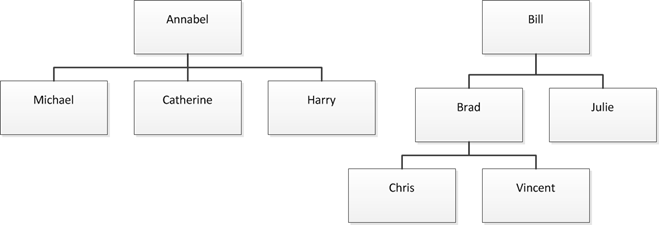
where the Hierarchy table contains this unbalanced P/C hierarchy, using the classical ParentID data model:
In order to show this P/C data structure in a PivotTable, we need to understand how DAX implements P/C handling. It is based on some very powerful functions, the most important of which are:
- PATH: computes the full path of a node following the ParentID column, starting from the root
- PATHITEM: extracts an item from a path, as returned by PATH
- LOOKUPVALUE: searches for a value inside a table, following a relationship that is valid only inside the formula
Thus, by means of defining some simple columns:
- HierarchyPath = PATH([NodeId], [ParentNodeID])
- Level1= LOOKUPVALUE ([Node], [NodeId], PATHITEM ([HierarchyPath], 1))
You get this result, which is self-explaining:

In order to have the Parent/Child hierarchy work, we still need to create a user define hierarchy putting the various Levels, from 1 to 3, inside a single hierarchy:
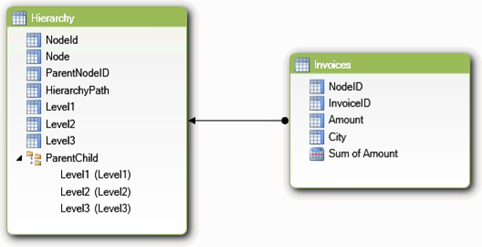
Et voilà, the work is done. We can put this hierarchy in a PivotTable, expand all the levels and we get this result:
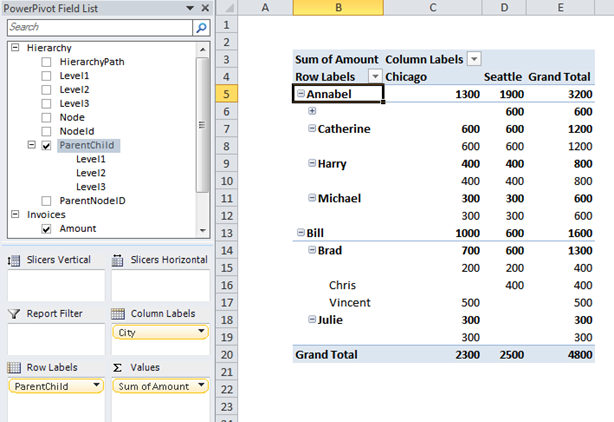
There are both good and bad news here.
- The good news is that all the levels, once put into a hierarchy, behave exactly like a Multidimensional P/C.
- The bad news is that if the hierarchy is a ragged one, as it is often the case with P/C, Denali CTP3 still makes a load of empty nodes visible.
SSAS handles this scenario with the usage of the HideMemberIf property of hierarchies, which hides useless nodes from the final result shown by the PivotTable. In CTP3, there seem not to be a way to set the HideMemberIf property for hierarchies, leading to this unwanted behavior. Hopefully, in the final release of Tabular the HideMemberIf will be available (if you are interested in having it, please vote this connect item, to make Microsoft guys aware of how useful this feature would be). If the item will be solved, then the next part of this post will be useless and life much easier. Thus, you might want to follow that item to check for its solution.
Nevertheless, if we want to mimic the HideMemberIf feature in CTP3, we still need to make some work with DAX. So, let us roll up our sleeves and start thinking at a viable solution.
The key to hide the unwanted rows is to note that:
- We can define, for each node, its depth. Annabel and Bill have a depth of one, being root nodes. Catherine, being a child of Annabel, has a depth of two. Vincent, being a nephew of Bill, has a depth of three. The depth can be defined at the row level of the Hierarchy table.
- We can define, for each cell, a Browse depth which is the depth up to which the P/C hierarchy has been unfolded, to make that cell visible.
With these definitions in mind, our PivotTable can be seen in this way:
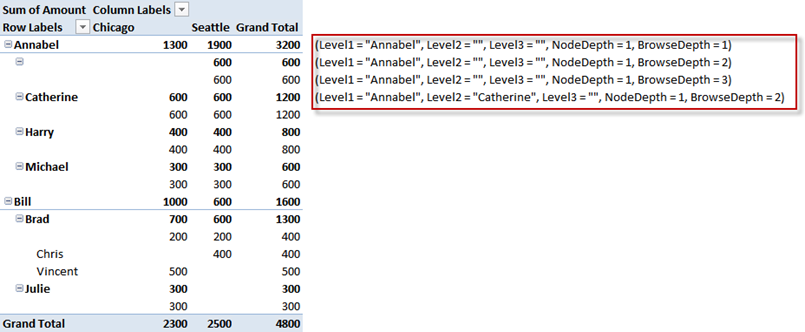
If we hide, from this PivotTable, all the rows where NodeDepth is greater than BrowseDepth, we will reach the desired result. In PowerPivot 1.0 this was a big pain in the neck, as can be seen in my previous post. In Denali CTP3, the solution is much easier and elegant, because there is a very interesting function available in DAX: ISFILTERED.
ISFILTERED gets a column reference and returns a Boolean value indicating whether the column is filtered in the current filter context or not. Now, it is easy to note that a cell with BrowseDepth of 1 has a filter on the column Level1 and no filter for Level2 and Level3. A cell with BrowseDepth of 2, will have a filter on Level1 and a filter on Level2, with no filter for Level3.
Thus, we can define the BrowseDepth measure with this formula:
BrowseDepth :=
IF (
    ISFILTERED ( 'Hierarchy'[Level3] ),
    3,
    IF (
        ISFILTERED ( 'Hierarchy'[Level2] ),
        2,
        IF ( ISFILTERED ( 'Hierarchy'[Level1] ), 1 )
    )
)
This measure will compute, for each cell, the browse depth. We are still missing the node depth of each row. Another useful DAX function will help us: PATHLENGTH, which computes the length of a path column. We can add a calculated column NodeDepth=PATHLENGTH([HierarchyPath]) and get this:

Clearly, the NodeDepth cannot be aggregated using SUM, we need to use MIN. Thus, we define a new measure MinNodeDepth which simply aggregates the NodeDepth column using MIN. The final result, with all these measures in a PivotTable, can be seen here:
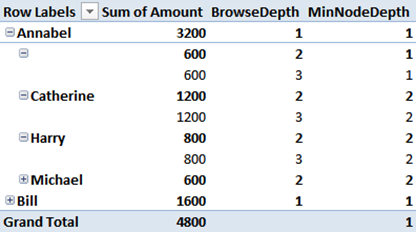
The final touch is to make the Amount measure BLANK whenever BrowseDepth is greater than MinNodeDepth, with this definition:
SumOfAmount :=
IF ( [BrowseDepth] > [MinNodeDepth], BLANK (), SUM ( Invoices[Amount] ) )
All the measures in a PivotTable:
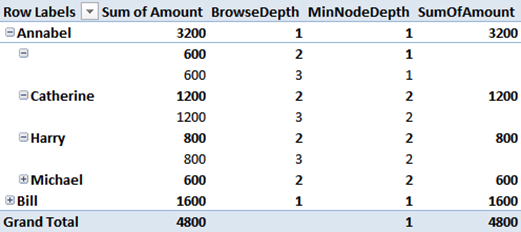
And, after removing all the technical measures, we get the final result, which is nice as we wanted it to be:
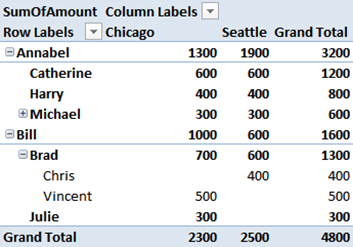
Pretty easy, elegant and super fast, all of the requirements of DAX are met.
I am confident that the SSAS team will take the time to let us use Parent/Child hierarchies with the HideMemberIf option. In the meantime this is a viable solution and a good exercise to start getting acquainted with the new DAX functions.
Last, but not least, in Tabular P/C hierarchies are standard user hierarchies. Thus, you can have as many P/C for a single table as you want. I know of many customers who will be happy to have more than one P/C hierarchy on the same dimension, without having the need to define separate dimensions as it was the case with Multidimensional in SSAS.
Returns a string which contains a delimited list of IDs, starting with the top/root of a hierarchy and ending with the specified ID.
PATH ( <ID_ColumnName>, <Parent_ColumnName> )
Returns the nth item in the delimited list produced by the Path function.
PATHITEM ( <Path>, <Position> [, <Type>] )
Retrieves a value from a table.
LOOKUPVALUE ( <Result_ColumnName>, <Search_ColumnName>, <Search_Value> [, <Search_ColumnName>, <Search_Value> [, … ] ] [, <Alternate_Result>] )
Returns true when there are direct filters on the specified column.
ISFILTERED ( <TableNameOrColumnName> )
Returns returns the number of items in a particular path string. This function returns 1 for the path generated for an ID at the top/root of a hierarchy.
PATHLENGTH ( <Path> )
Adds all the numbers in a column.
SUM ( <ColumnName> )
Returns the smallest value in a column, or the smaller value between two scalar expressions. Ignores logical values. Strings are compared according to alphabetical order.
MIN ( <ColumnNameOrScalar1> [, <Scalar2>] )
Returns a blank.
BLANK ( )