If you have already read this post from Marco Russo and have understood everything, then this new post of mine will be useless. But if you are like me, i.e. you have read it and have broken your head trying to understand the final (really smart!) formula, then this new post might help you to understand it better. Thus, this post does not contain anything new, it only shows graphically how to make many to many relationships work fast with PowerPivot.
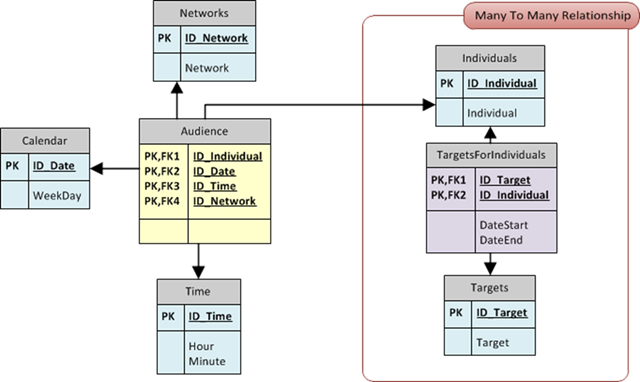
I am going to use as an example a database structure that I am currently working with, i.e. a database used to perform analysis of audience for a TV broadcasting company. The database structure is shown in the next figure:

The fact table says that an individual is watching a network in specific point in time of a single date. The red box contains the many to many relationship (the evil, from the performance point of view). An individual belongs to many categories (she is a woman, she has less than 30 years and so on, each characteristic of the individual makes it belong to a category) and the user wants to browse the data using targets. A target is nothing but a boolean expression of categories (a target might be “women with less than 30 years”, thus being an AND of categories). So, the bridge table links individuals to targets through a many to many relationship.
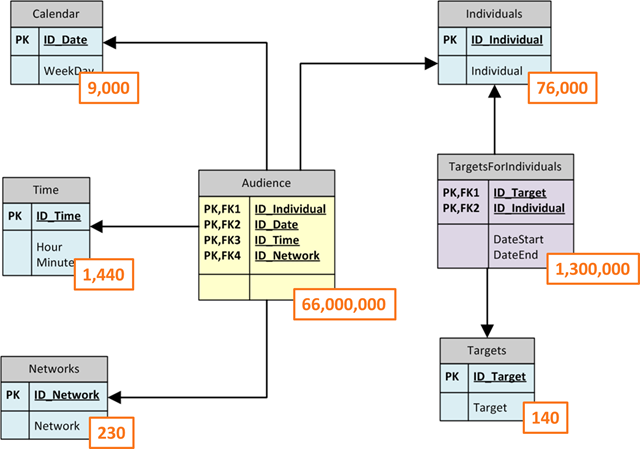
Now, let us see the same figure with an indication of the number of rows expected for a (very small, indeed) period of time:

The fact table contains a lot of rows but it is in the range that PowerPivot can handle without any problem. After all, aggregating several millions of rows is not a problem for a great engine like PowerPivot is. The problem is that the user will make a filter on the Targets table and we need to propagate that filter to the Audience one, which is something that does not happen magically.
In fact, the relationship between the bridge and the targets table indicates that, when a filter is imposed on the targets table, the bridge is filtered to show only the values that are in relationship with the targets. The other relationships are not affected by the filter, so the execution context sees all the individuals and all the audience rows. We need to write a DAX formula to make PowerPivot follow the relationships.
My first trial, with this structure, was the naïf one: using SUMX I iterate over the bridge table and then, for each row, I use CALCULATE to consolidate the row context in the bridge to a filter context that propagates over relationships. Thus, the first formula looks like this:
SUMX (
    TargetForIndividuals,
    CALCULATE (…)
)
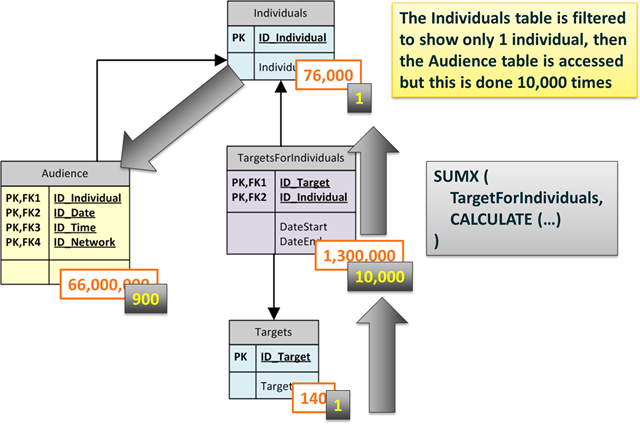
Now, this formula will work but it is not fast. Indeed, it is incredibly slow. The reason is that if we filter only one target, SUMX will iterate over (more or less) 1/140 of the bridge table, thus it will perform an iteration over 10,000 rows. For each row it will open a new row context that CALCULATE will consolidate in a filter one. Since each row in the bridge corresponds to only one row in the Individuals table, the relationship, along with the filter context, will make only one individual visible. Now, if we compute a formula over the Audience table it will be computed for that individual only. By simple math, we know that, on average, each individual has +/- 900 rows in the Audience table. Thus, the computation for each individual is very fast, but there will be 10,000 of those computation, making the full process very slow. The following figure is a graphical representation of the algorithm:

In order to make this formula work fast we need to reduce the number of iterations over the bridge table. The idea is that if we are able to filter all the individuals belonging to a target in a single step, then we can use that filter to reduce the size of the individuals table which, in turn, will filter the audience table. Said in other words, we want to do a single step where we filter the Individuals table using the TargetForIndividuals as a sort of bitmap mask.
With this algorithm in mind, it is now easy to read this formula (yep, I understand that writing it is harder, but reading it is at least affordable):
CALCULATE (
    …,
    FILTER (
        VALUES (Individuals),
        CALCULATE (
            COUNTROWS (
                TargetsForIndividuals
            ) > 0
     …
    )
)
Let us read it. We use CALCULATE, the ellipsis contain the formula, which is not interesting for this post, the only thing to note is that the formula will work on the Audience table, performing some kind of calculation.
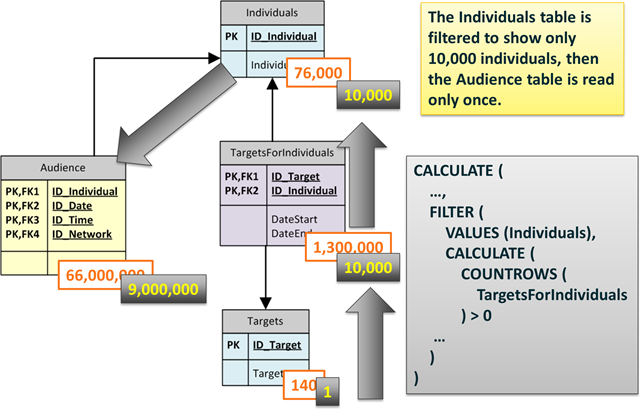
CALCULATE will create a new filter context where we impose a filter over Individuals, using FILTER. The individuals table is unconstrained, before the filter context created by CALCULATE so VALUES(Individuals) inside FILTER will return all the individuals. But then, the FILTER call returns only the individuals where COUNTROWS (TargetForIndividuals) is greater than 0. At this point, we need to remember that the bridge table (TargetsForIndividuals) shows only the rows (10,000) for individuals who belong to a specific target, due to the filter present on the Targets table. Thus, the FILTER call will return only the individuals who belong to a target, again 10,000 rows.
CALCULATE will then create a filter context where the Individuals table shows only those 10,000 rows and, due to the presence of the relationship, the Audience table gets filtered too, showing only the rows who belong to individuals who, in turn, belong to the specified target. Let us see this in the next figure:

Now the situation is completely different. The formula does not perform any iteration, it will do a one-step filter of the Individuals table and then a single pass of the Audience table, looking for nine millions rows at once. Needless to say, this formula runs at a blazing speed.
If you are interested in this kind of games, this is one of the topics of my incoming PASS Summit session and, needless to say, of the great PowerPivot workshop that SQLBI will bring to the Netherlands in December 1 and 2. I really hope to see you at both events! ![]()
Checks whether all arguments are TRUE, and returns TRUE if all arguments are TRUE.
AND ( <Logical1>, <Logical2> )
Returns the sum of an expression evaluated for each row in a table.
SUMX ( <Table>, <Expression> )
Evaluates an expression in a context modified by filters.
CALCULATE ( <Expression> [, <Filter> [, <Filter> [, … ] ] ] )
Returns a table that has been filtered.
FILTER ( <Table>, <FilterExpression> )
When a column name is given, returns a single-column table of unique values. When a table name is given, returns a table with the same columns and all the rows of the table (including duplicates) with the additional blank row caused by an invalid relationship if present.
VALUES ( <TableNameOrColumnName> )
Counts the number of rows in a table.
COUNTROWS ( [<Table>] )