-
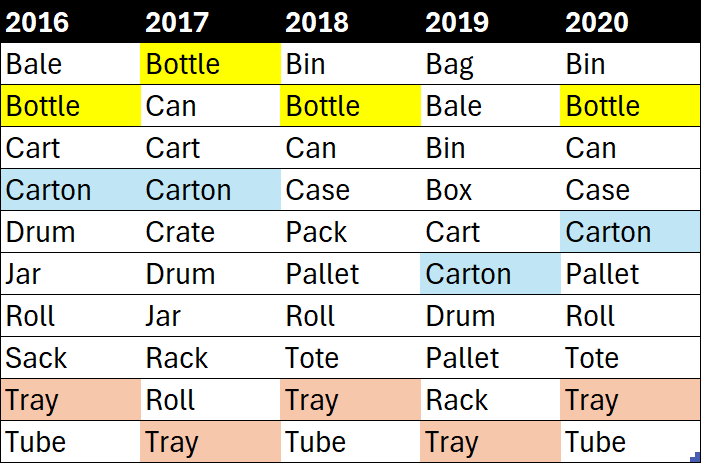
This article outlines the process of creating a measure to identify the top 10 products by sales each year. Read more
-
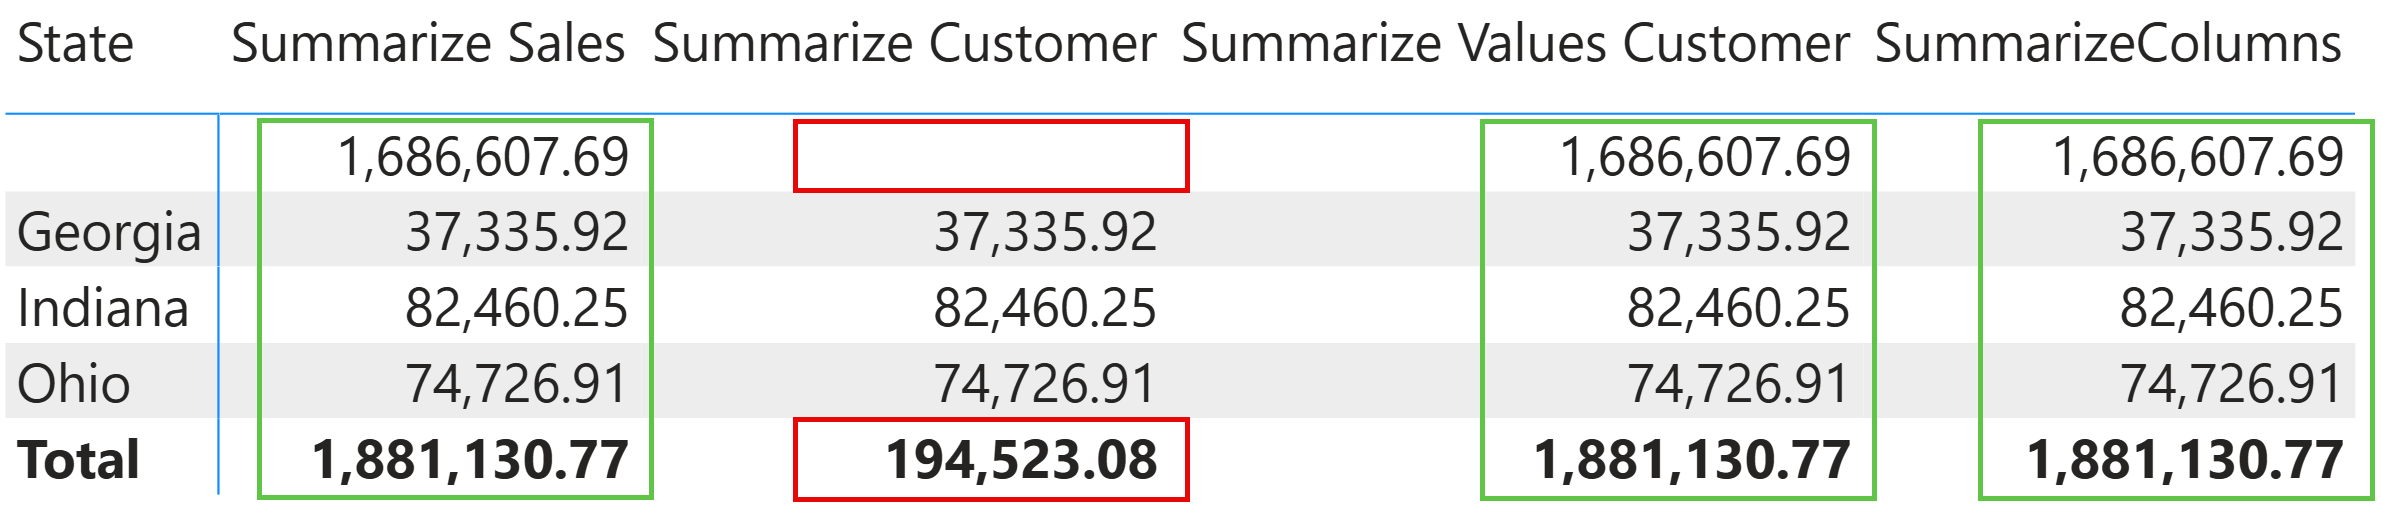
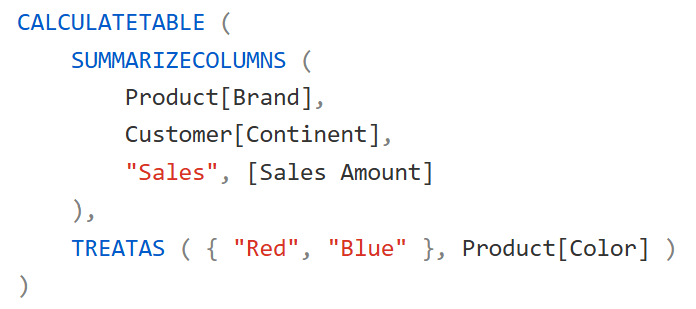
This article describes when to use VALUES in a table grouped by SUMMARIZE, then goes on to explain why you cannot however use VALUES with SUMMARIZECOLUMNS. Read more
-
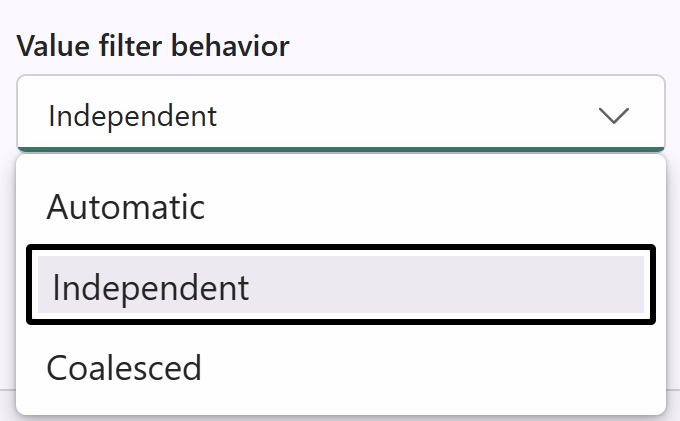
Value filter behavior is a setting in Power BI semantic models that controls how filters are combined in SUMMARIZECOLUMNS. This article explains how it works and suggests its best configuration. Read more
-

User-defined functions are a new and exciting feature in DAX. In this article, we outline the key concepts to understand before using them in Power BI projects. Read more
-
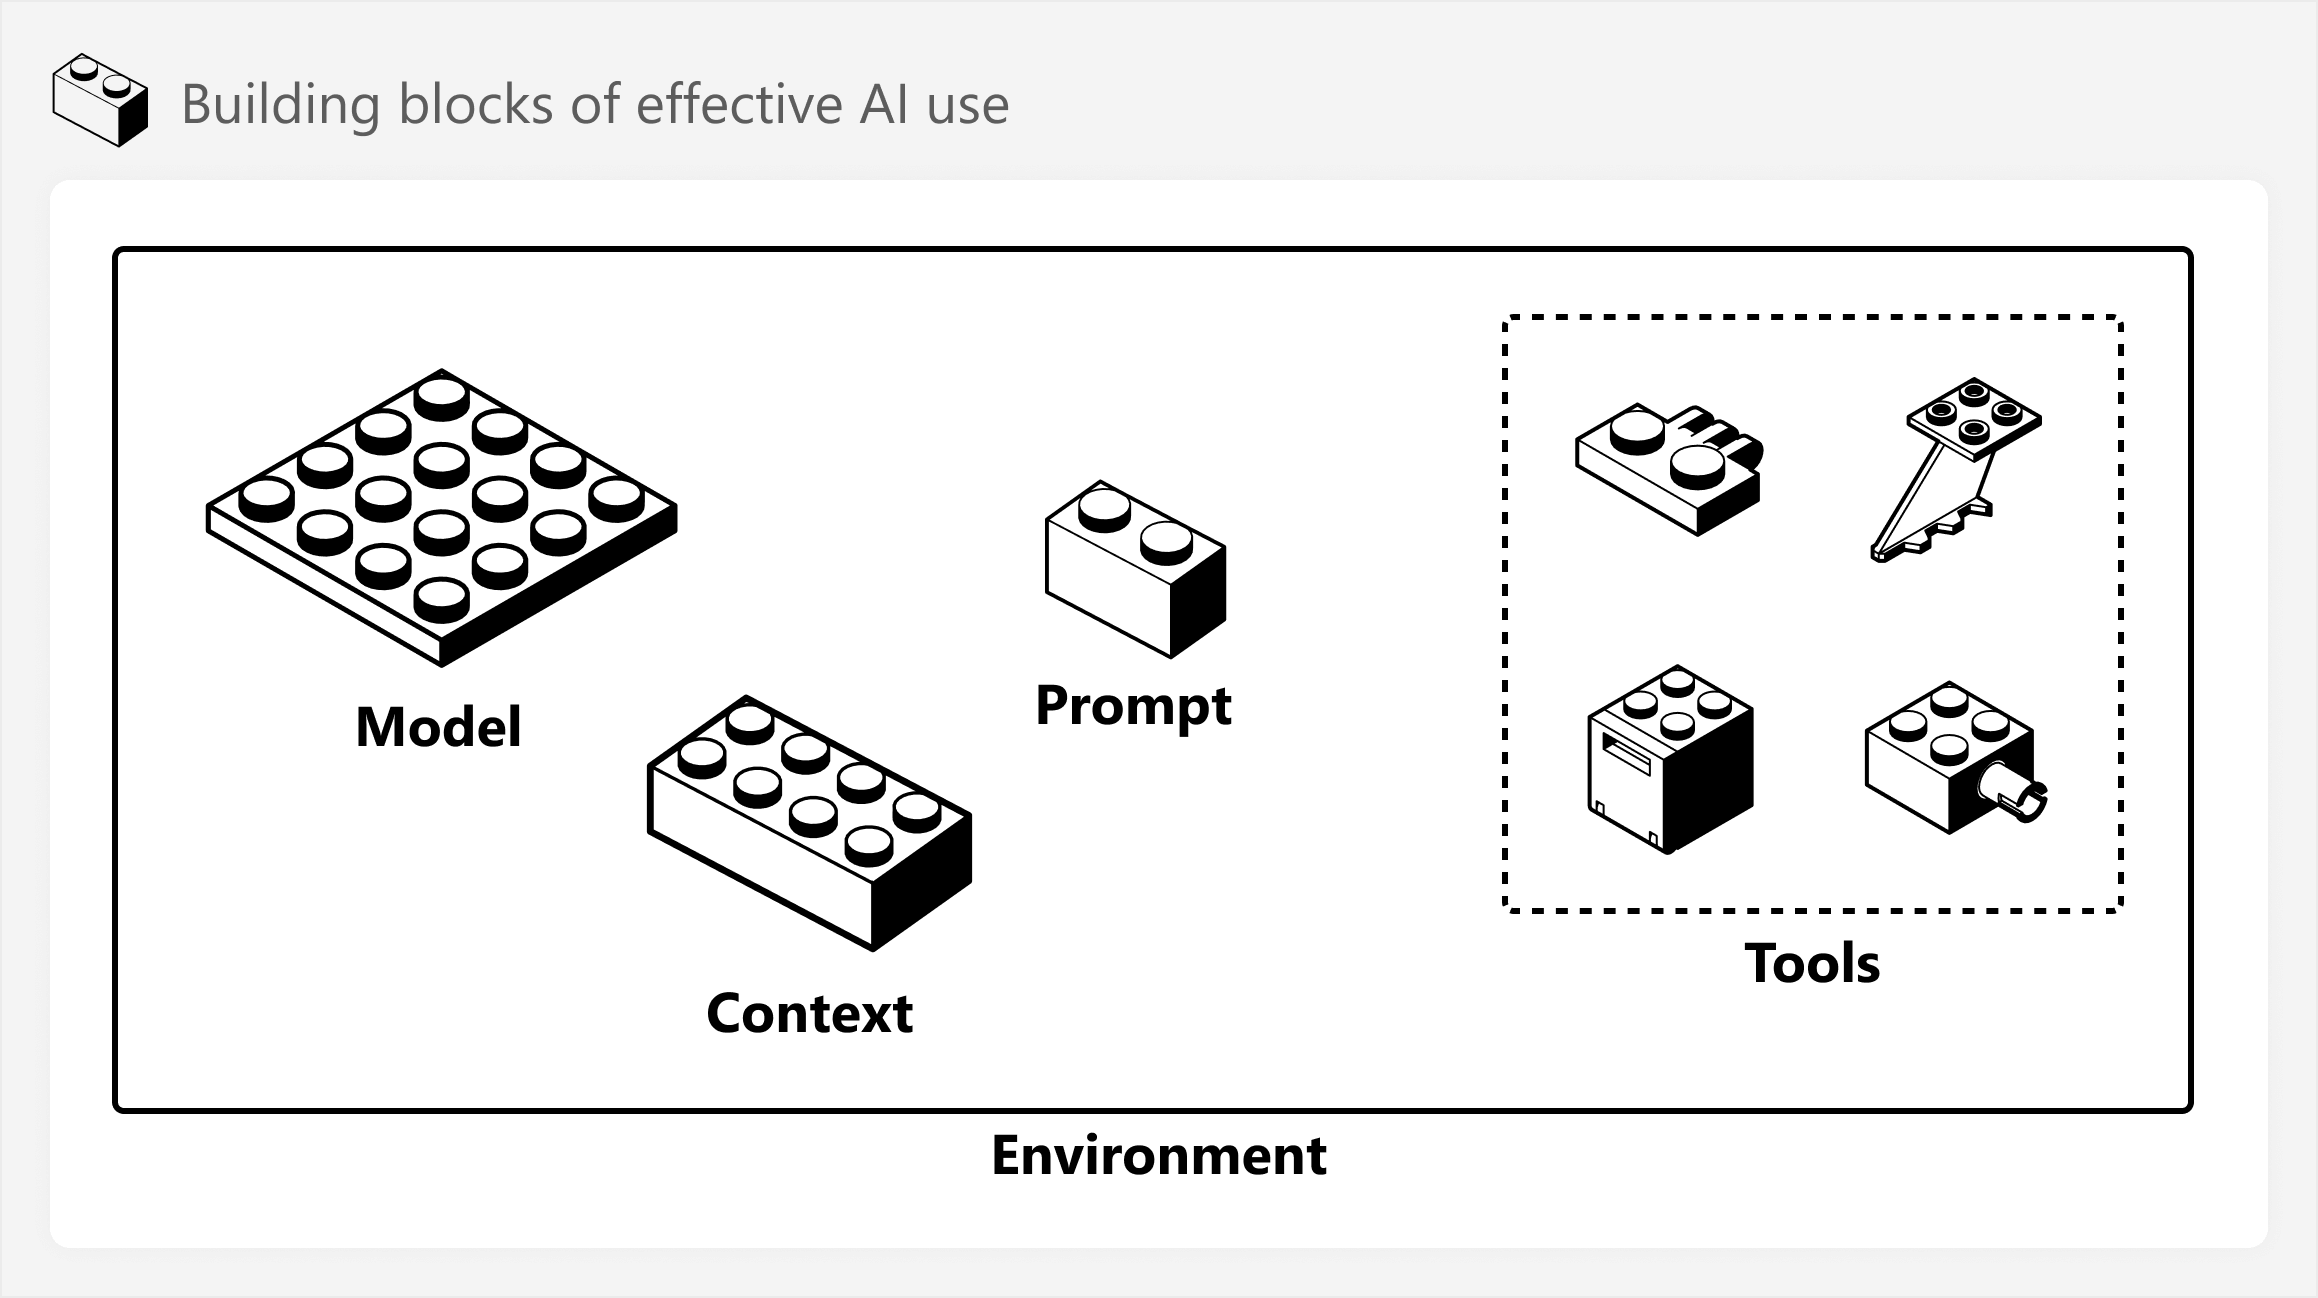
This article is about useful concepts and scenarios for integrating AI and AI agents in BI development, with specific examples for Power BI. Read more
-
Why and when you should use VALUES while iterating a table reference in DAX. Read more
-
This article describes the sideways recursion triggered by invoking a calculation item from another calculation item, explaining why it should be avoided to steer clear of unexpected results. Read more
-
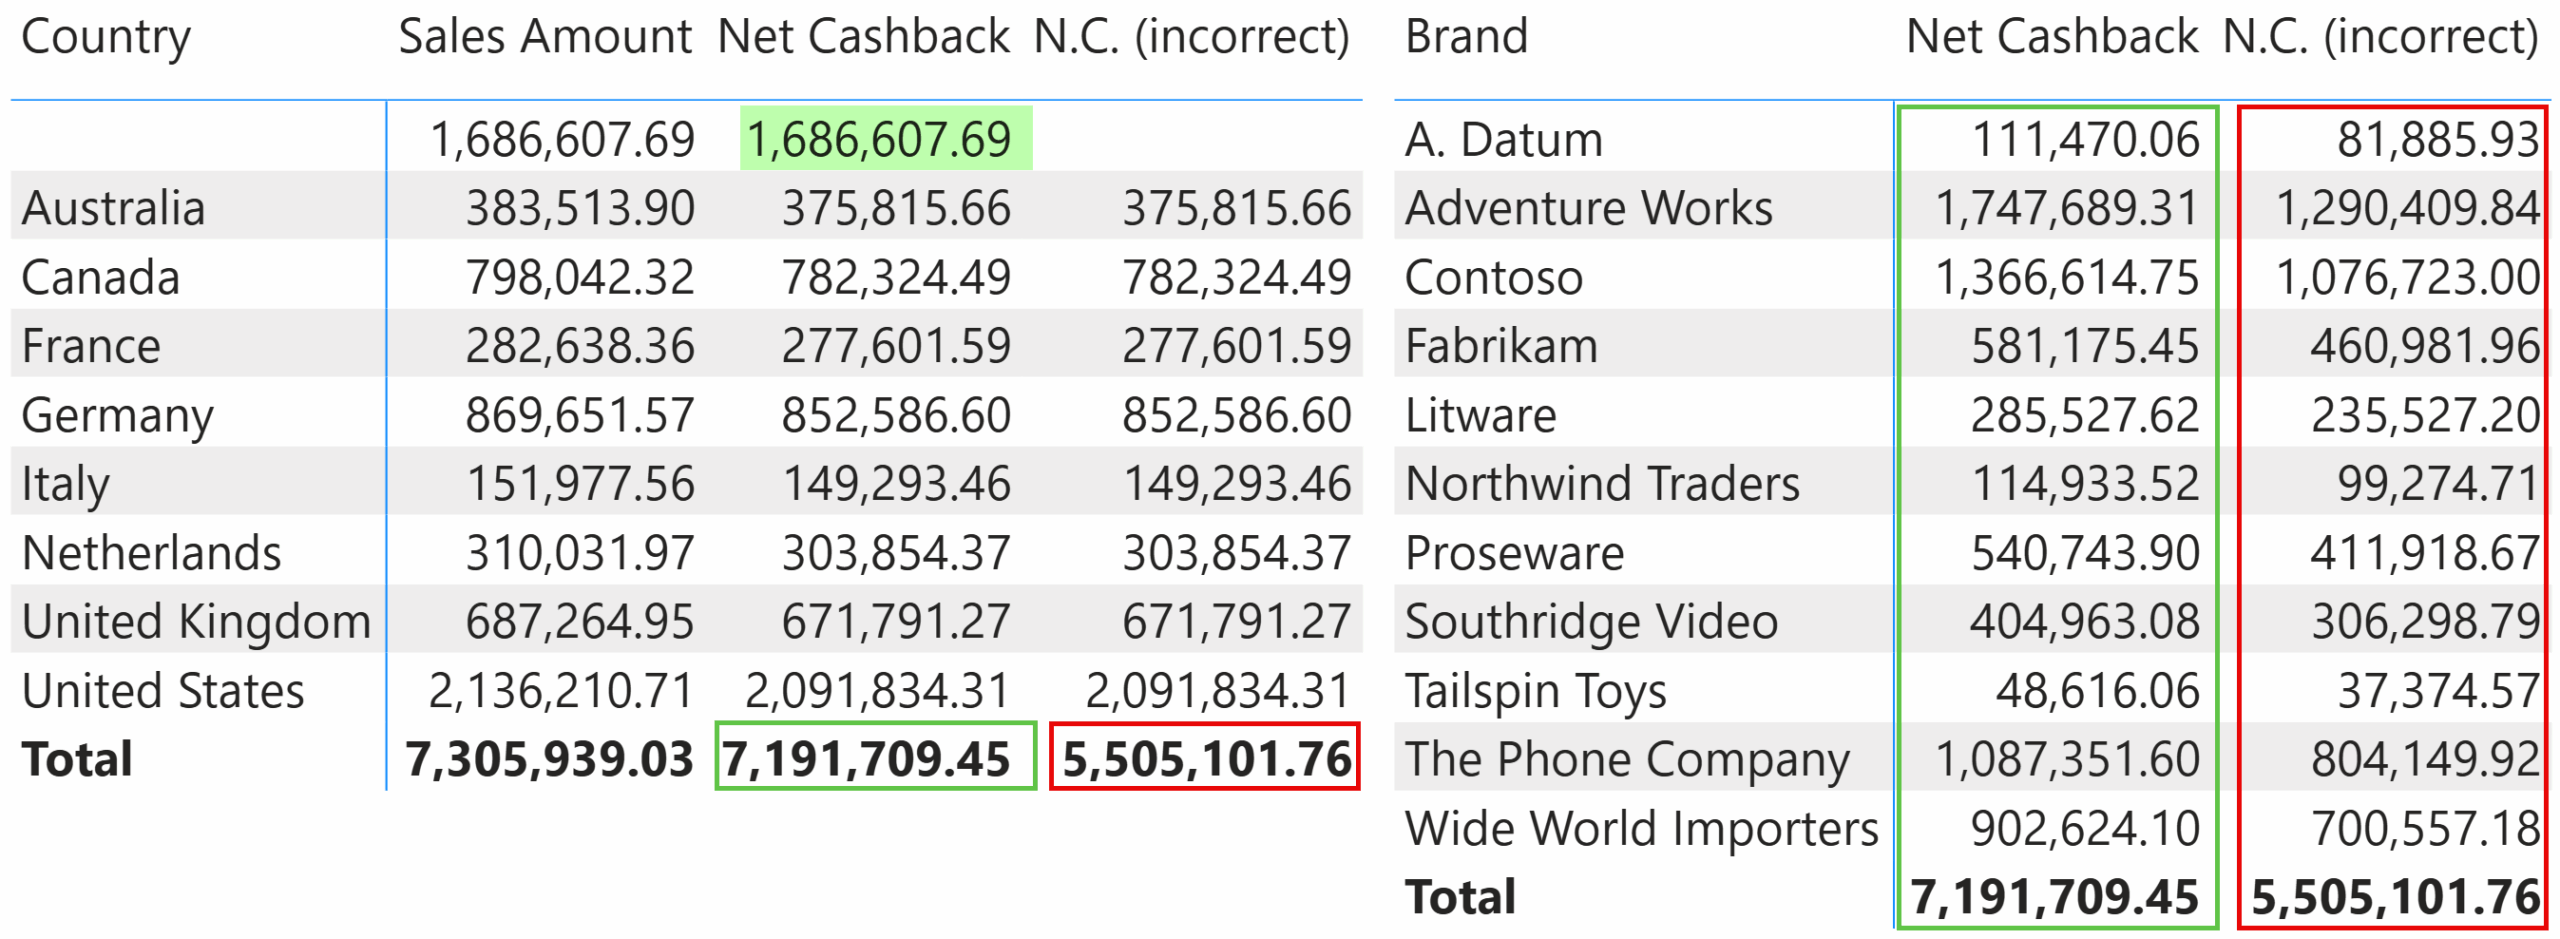
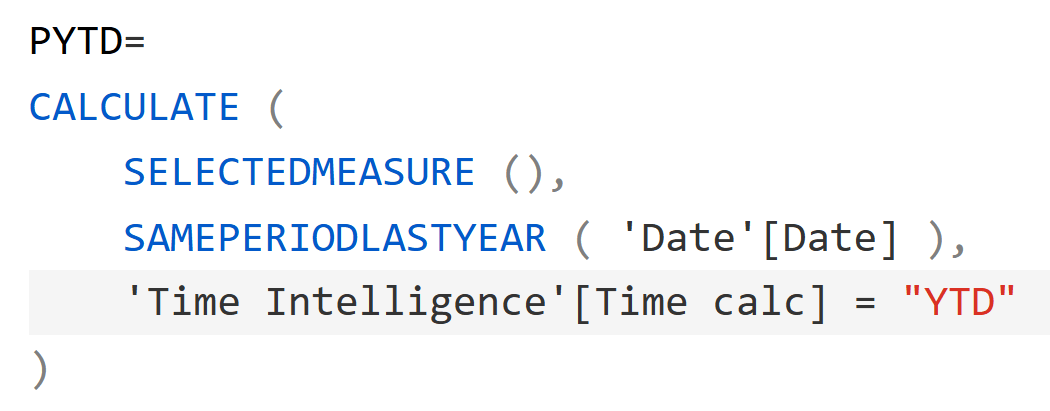
SUMMARIZECOLUMNS is a powerful and complex function in DAX that in 2025 can be used in measures. This article outlines the best practices when using this function to avoid incorrect results. Read more
-
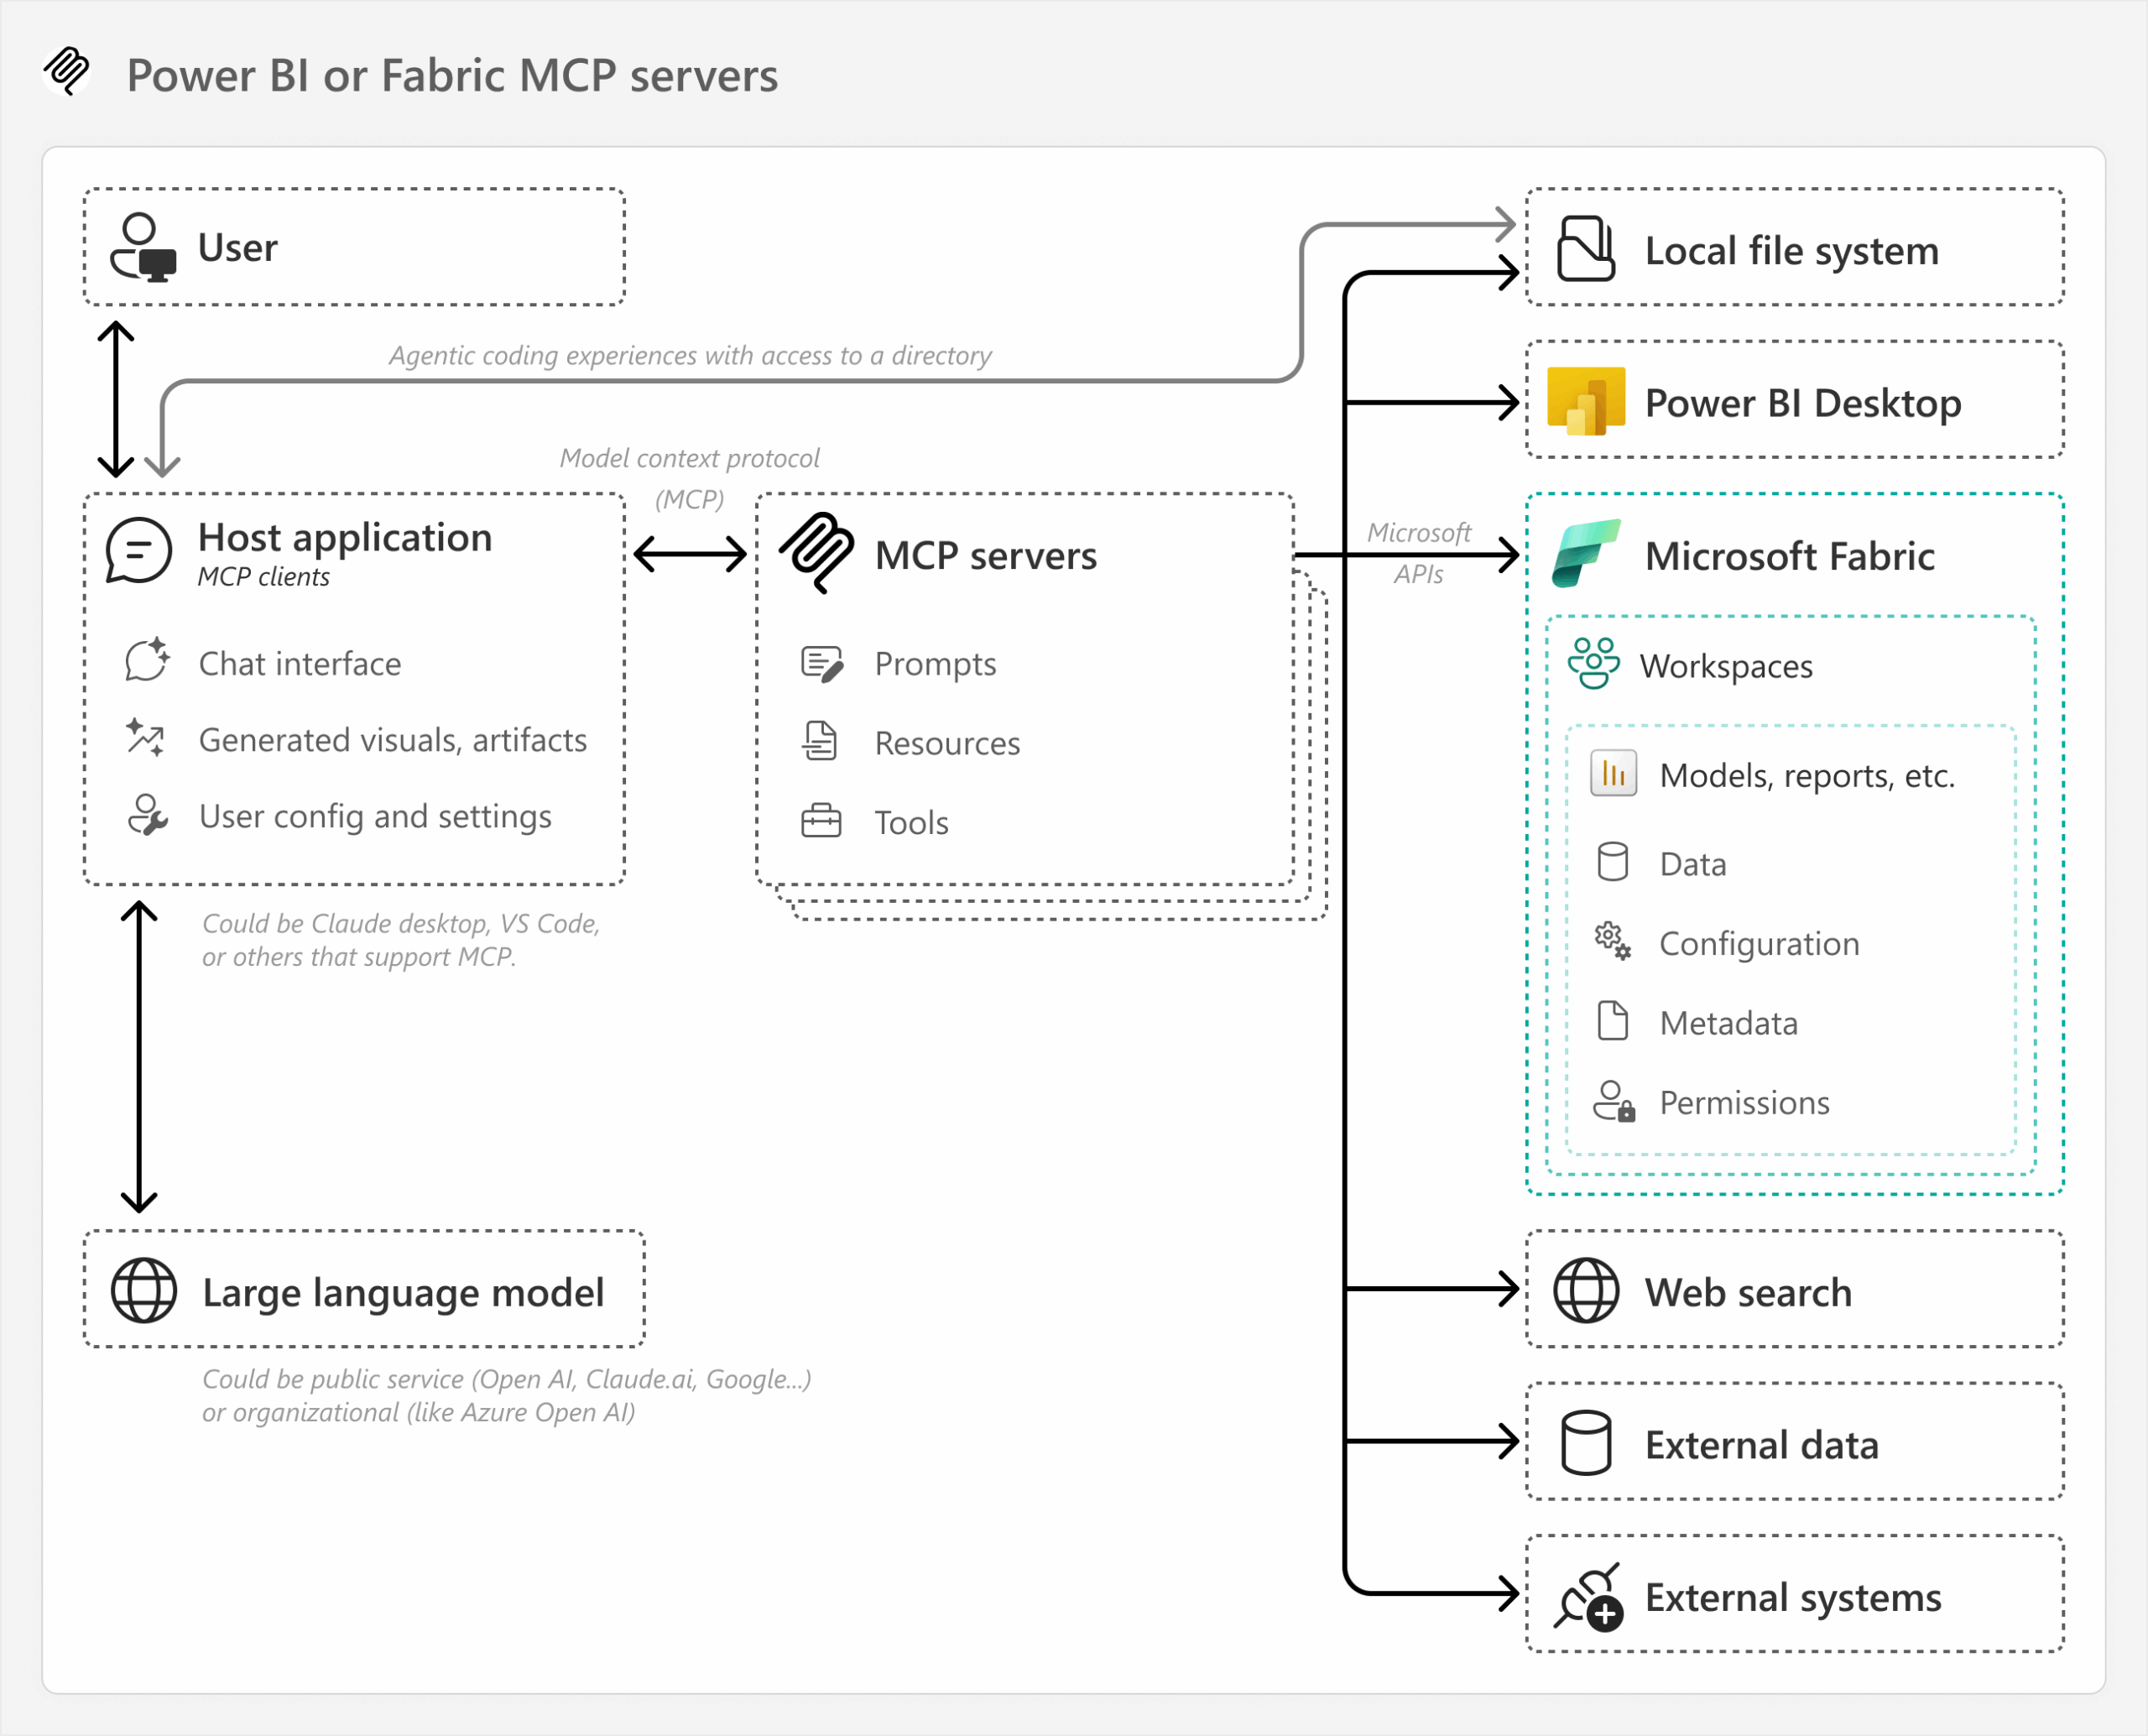
This article is about the state of AI tools with Power BI, and how to use the model context protocol (or MCP) to interact with and control Power BI or Fabric with a large language model (or LLM). Read more
-
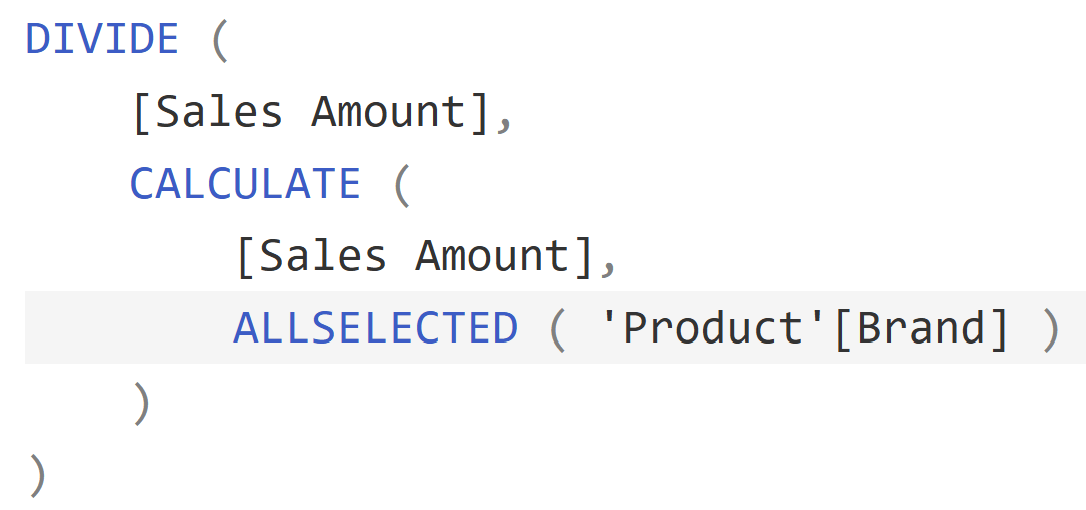
ALLSELECTED is a powerful, yet dangerous function. This article describes the best practices to follow to avoid falling into the pitfalls involved with ALLSELECTED. Read more