-
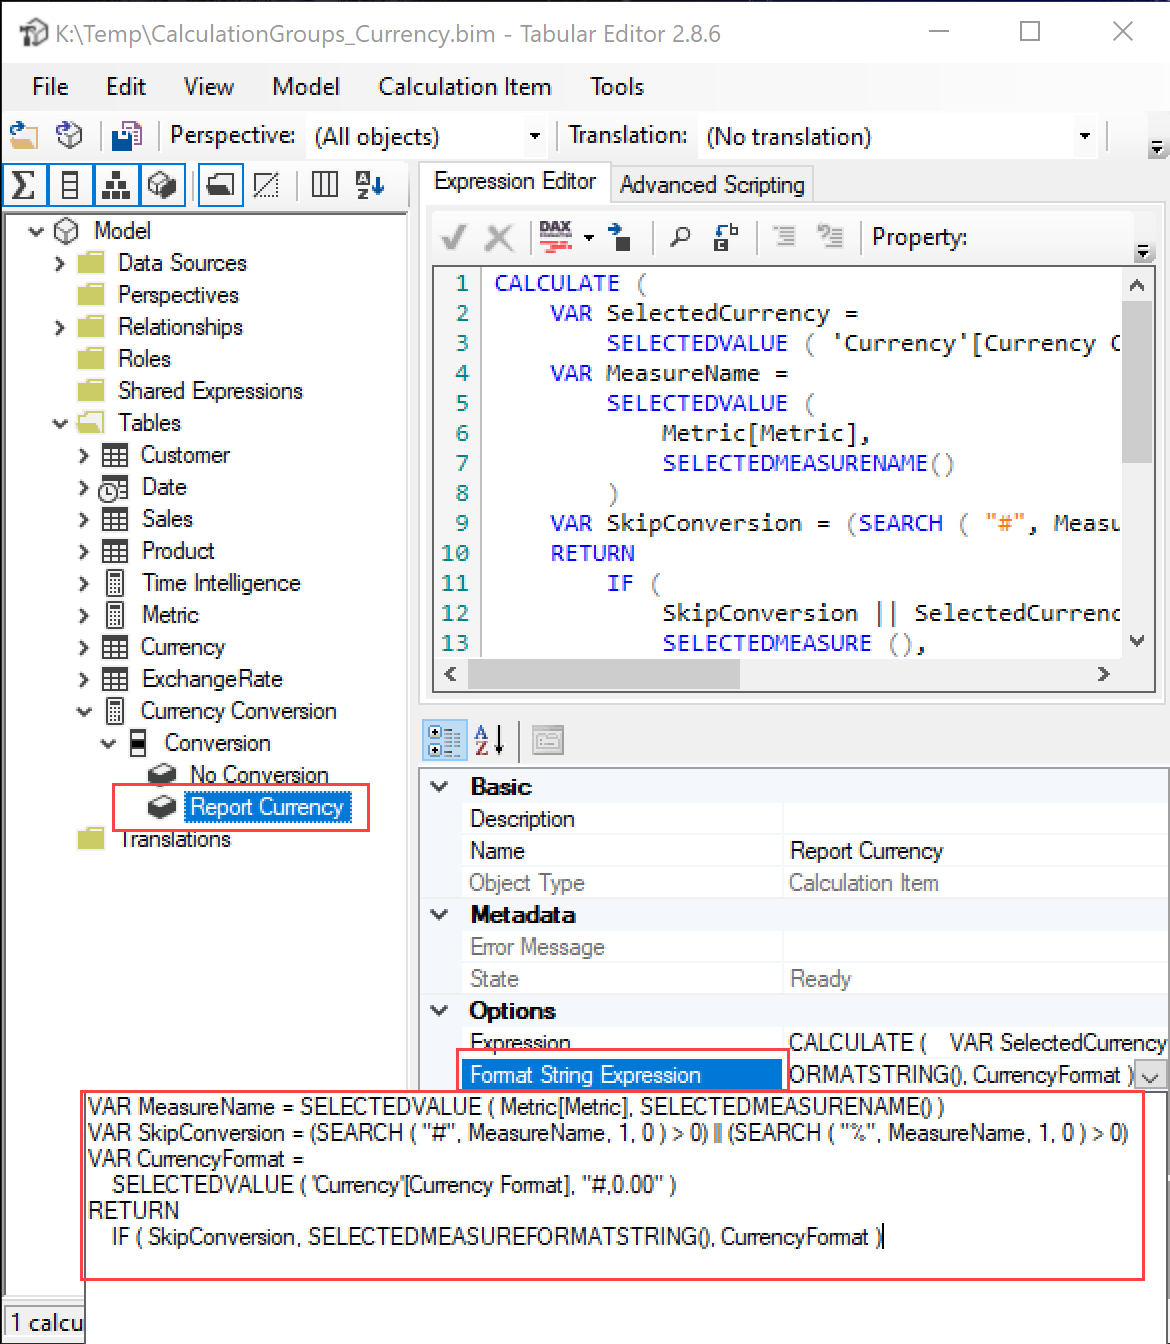
This article describes how to control format strings in calculation groups. Before starting, we suggest you read the previous articles in this series. Read more
-
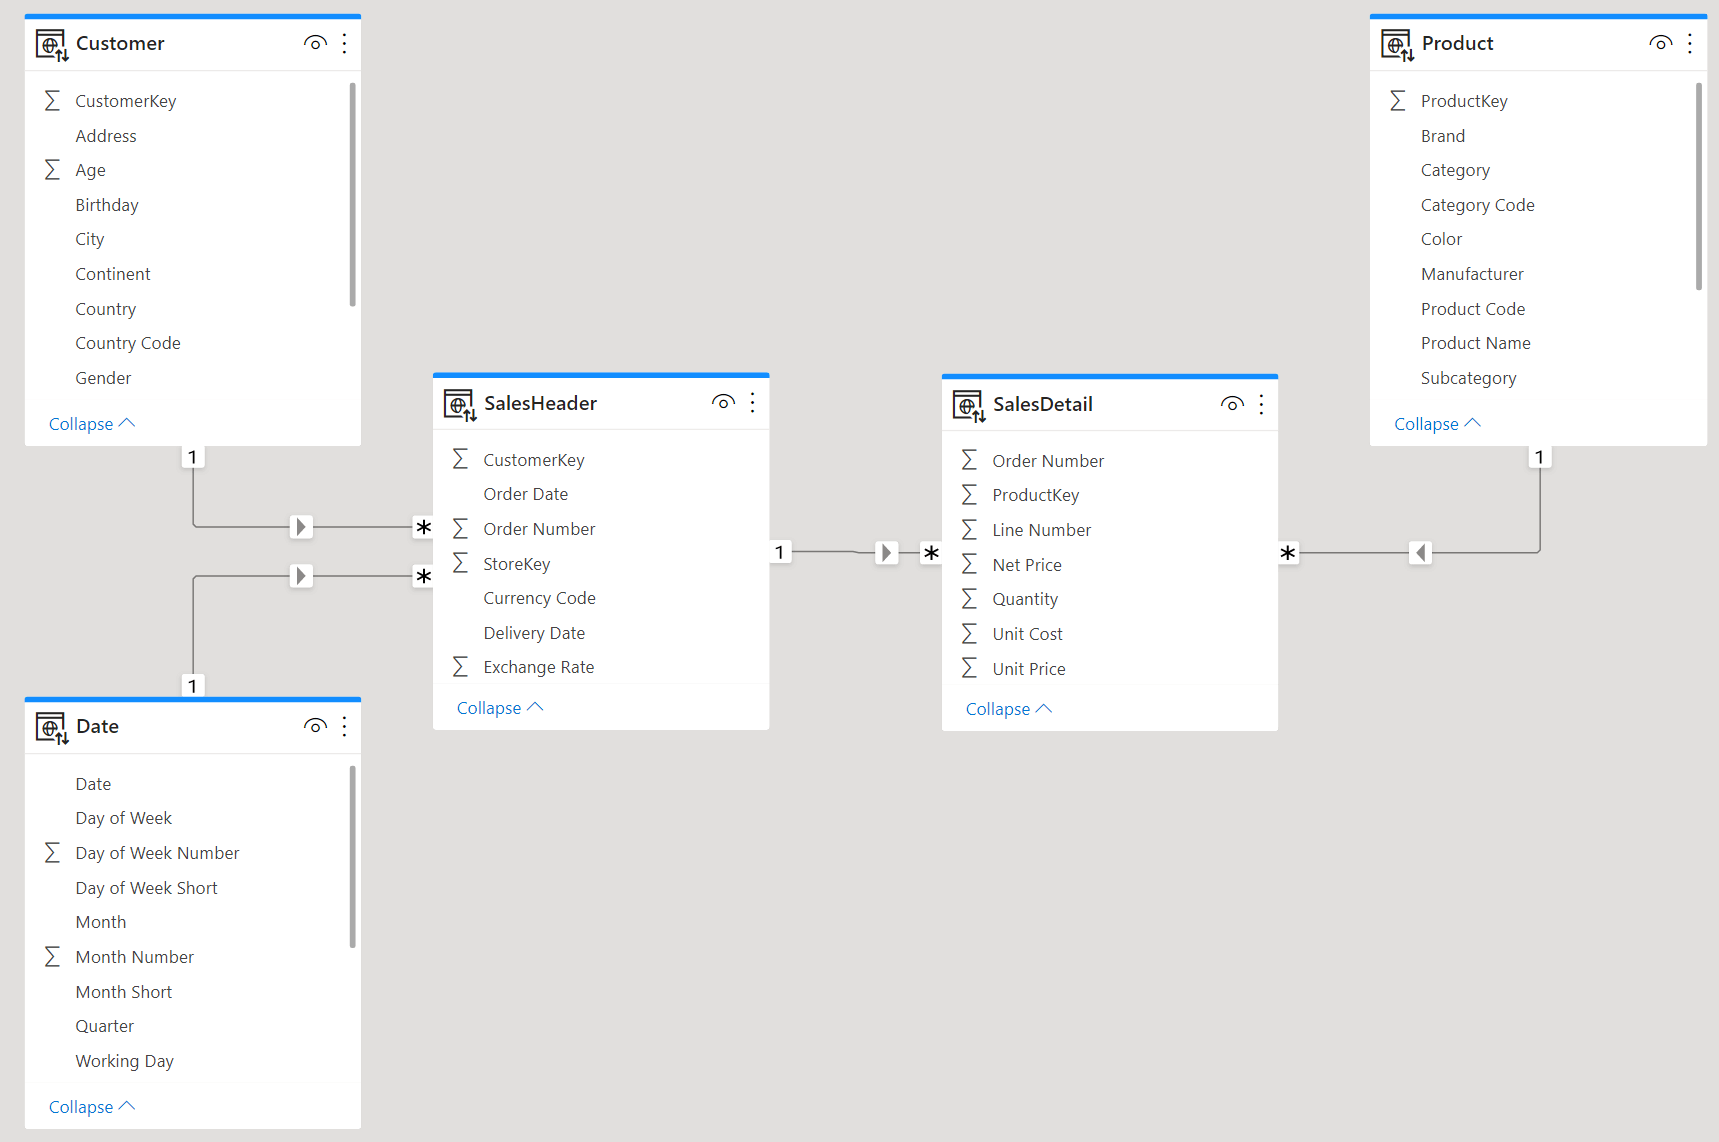
In this article we perform a performance comparison between header/detail models and star schemas. Building a star schema might require a few ETL steps and some coding. Nonetheless, it is always the best modeling option. Read more
-
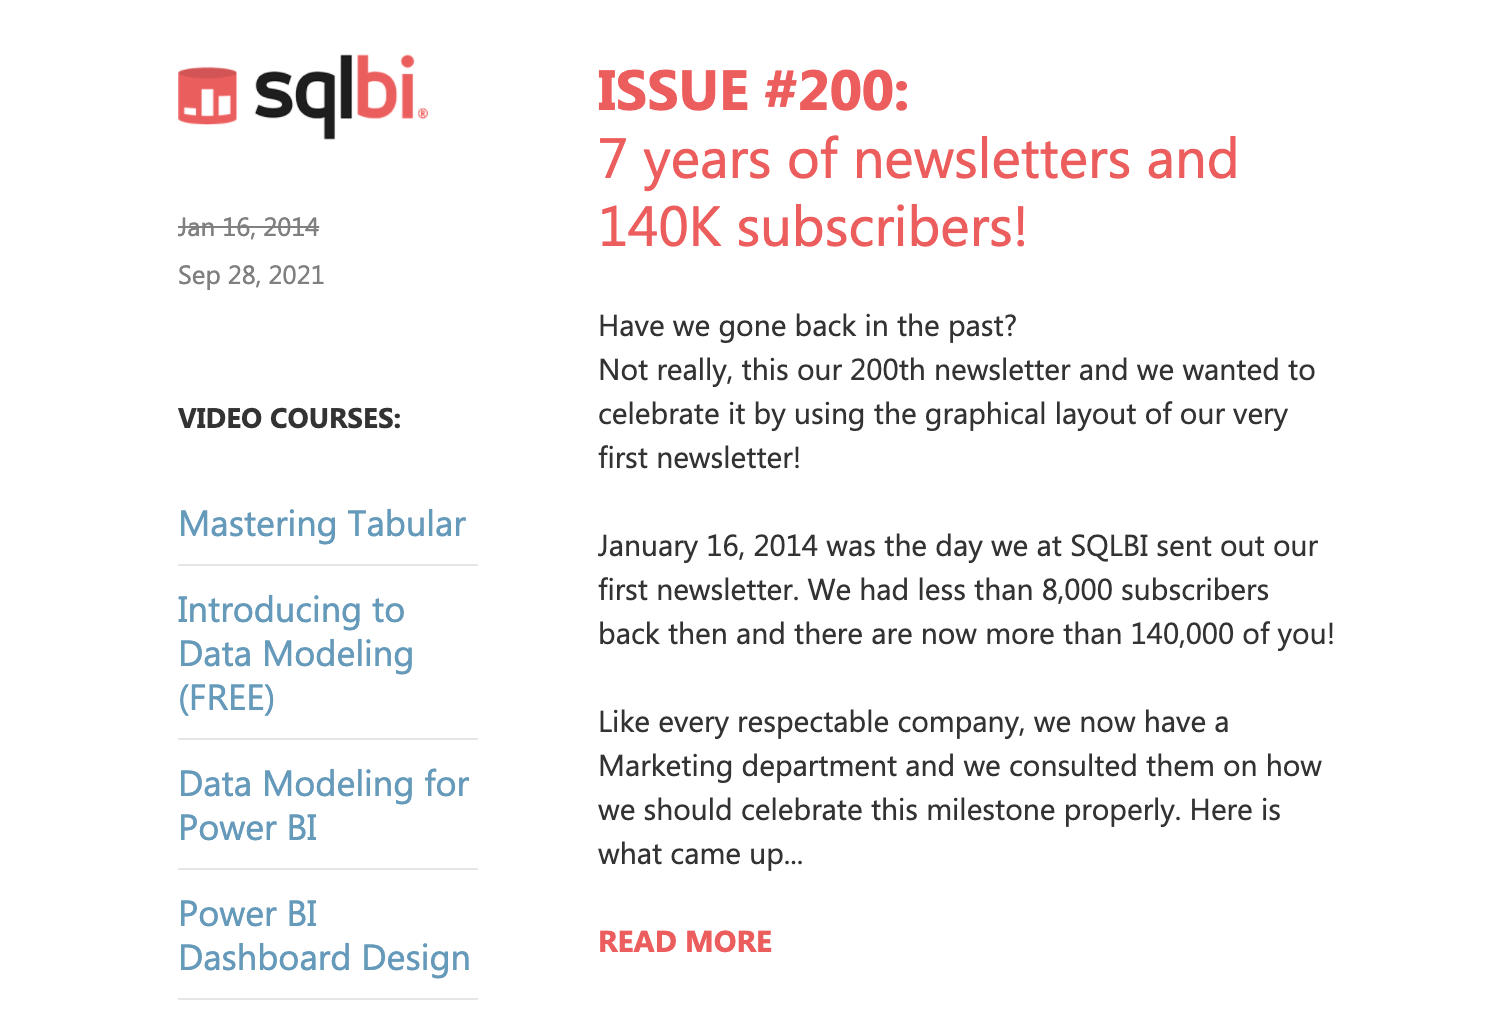
January 16, 2014 was the day we at SQLBI sent out our first newsletter. We had less than 8,000 subscribers back then. We went on to send newsletters out every other week for more than seven years, always trying to… Read more
-
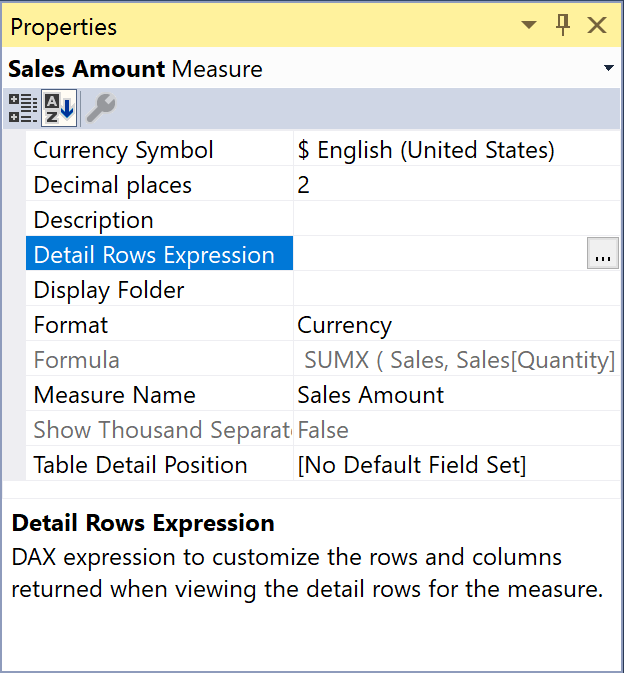
The Detail Rows Expression in a Tabular model provides the user with control over the drillthrough results obtained by showing details of a measure. This article describes typical DAX expressions you can use in this property. Read more
-
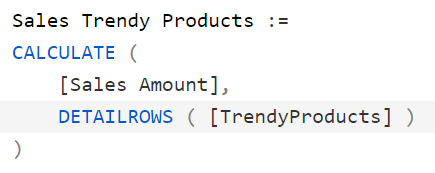
This article describes how to use the detail rows expression of a measure to obtain the equivalent of creating table functions in DAX. This allows the reusing of a table expression in multiple CALCULATE filters. Read more
-
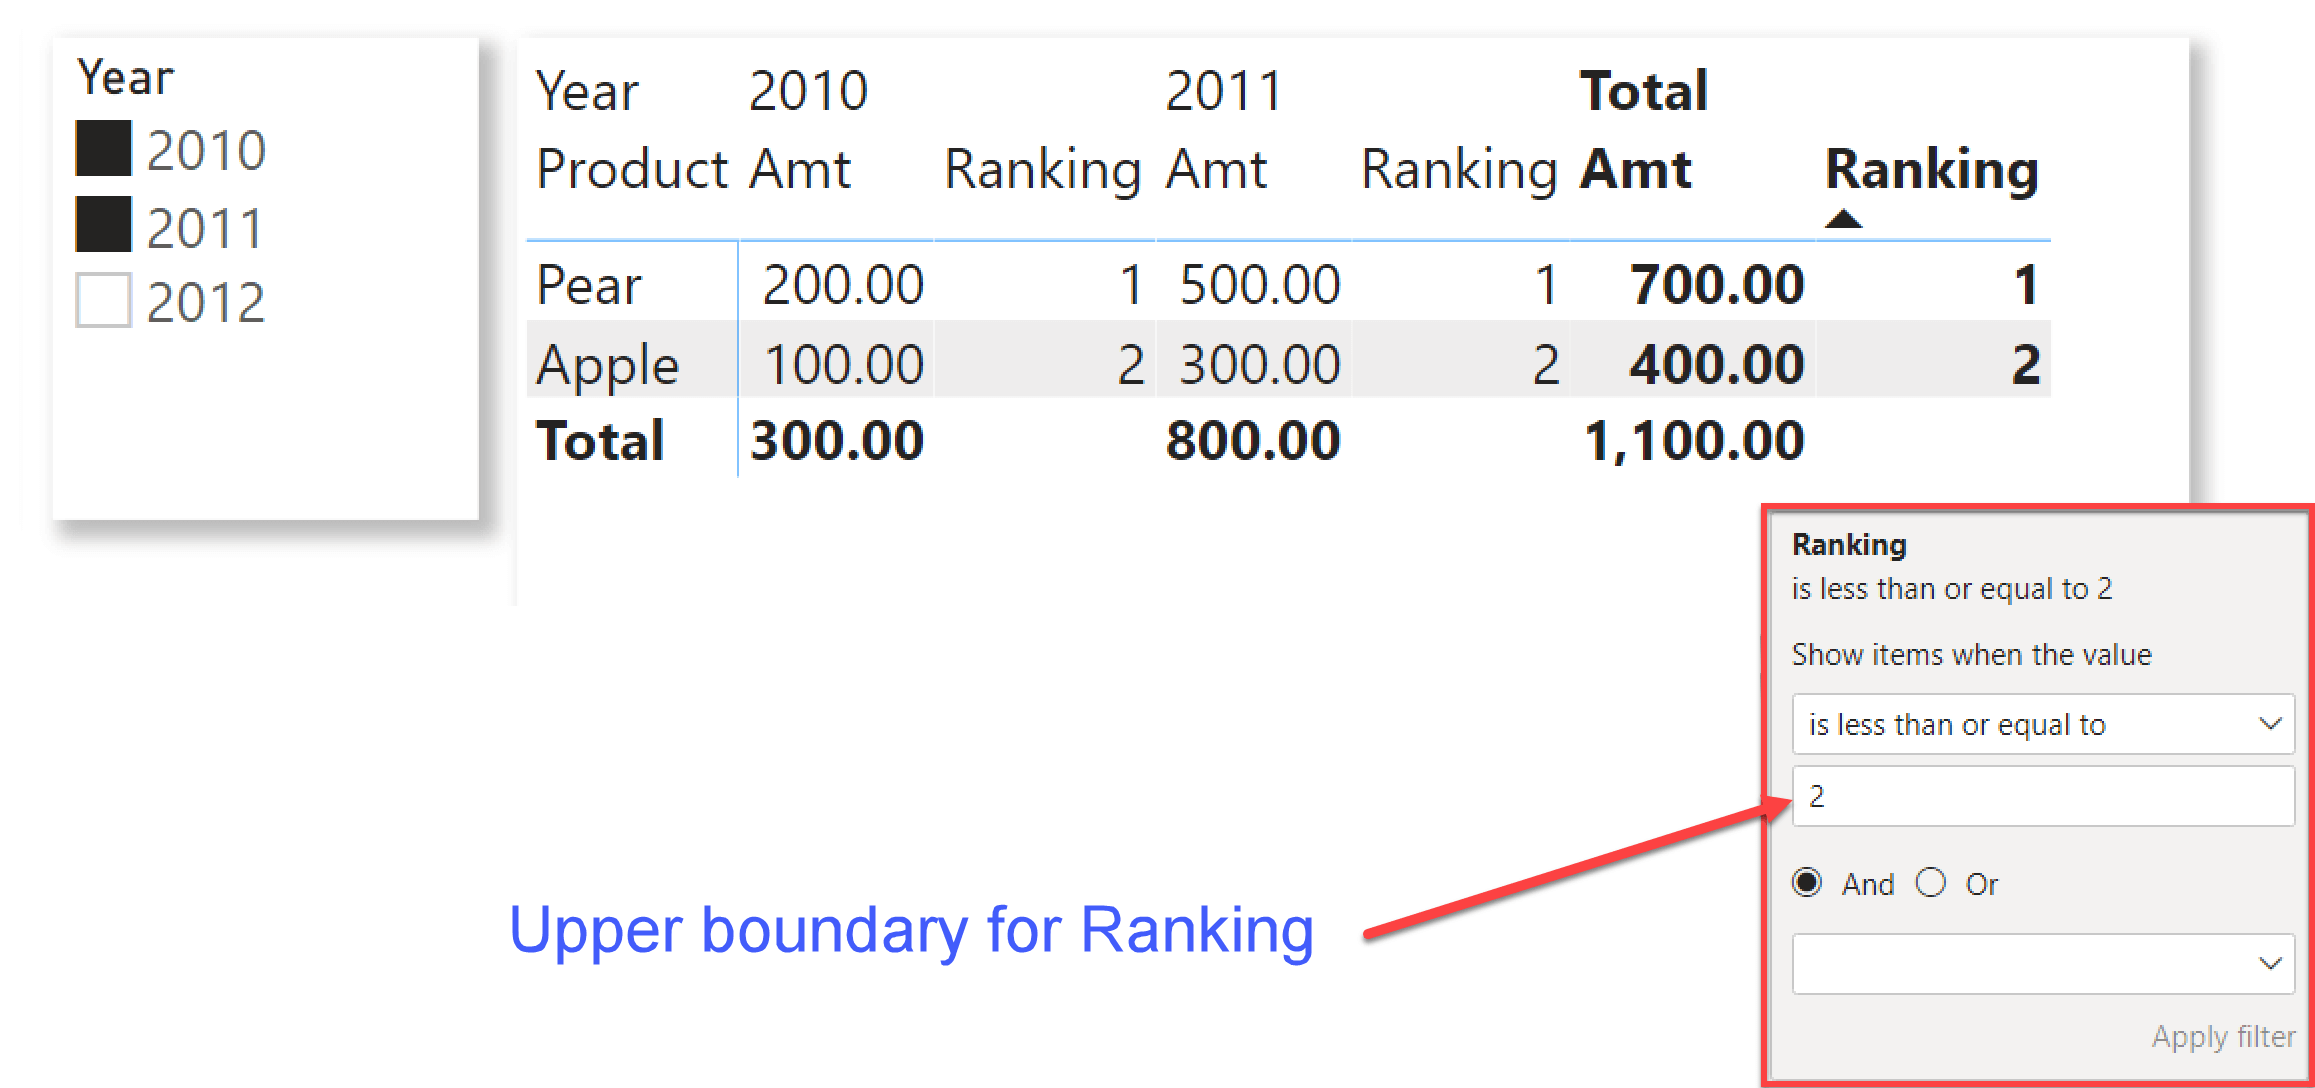
When you use a measure as a filter in a Power BI visual, the DAX code generated might display different behaviors depending on whether the measure is part of the values shown in the visual or not. In this article,… Read more
-
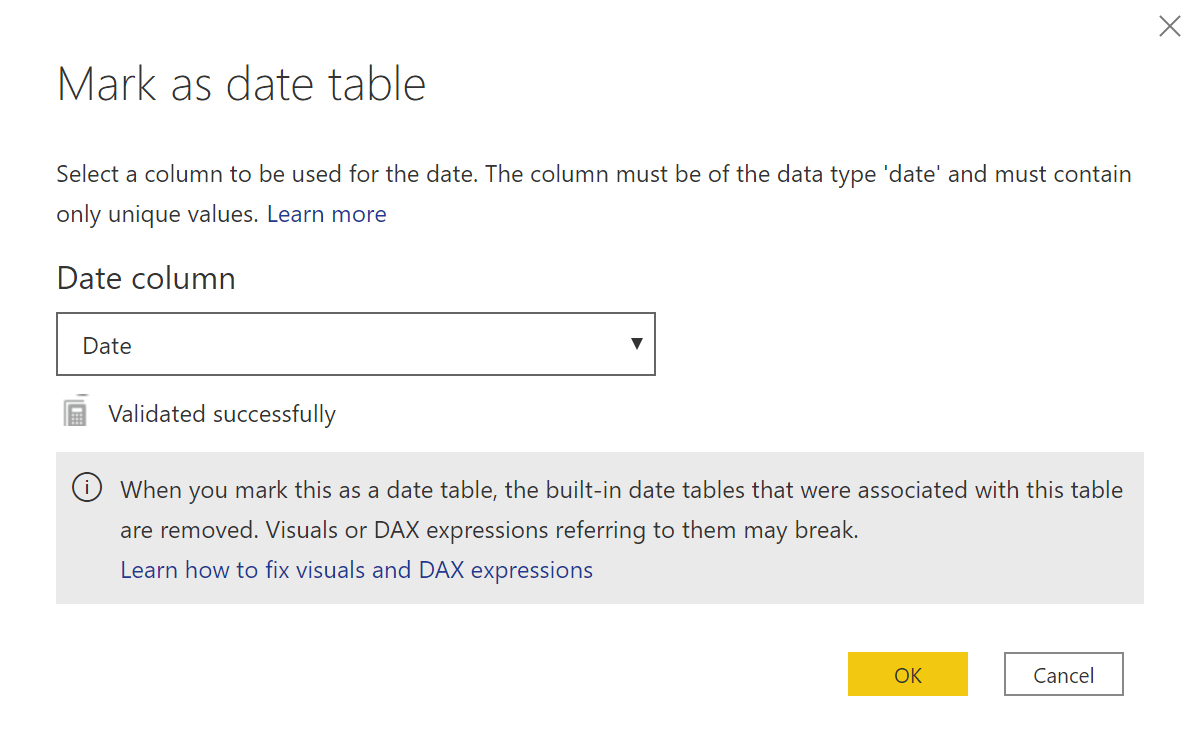
Tabular models (including Power BI) require marking the Date table as a date table to get appropriate results with time intelligence calculations. This article explains why this setting is required. Read more
-
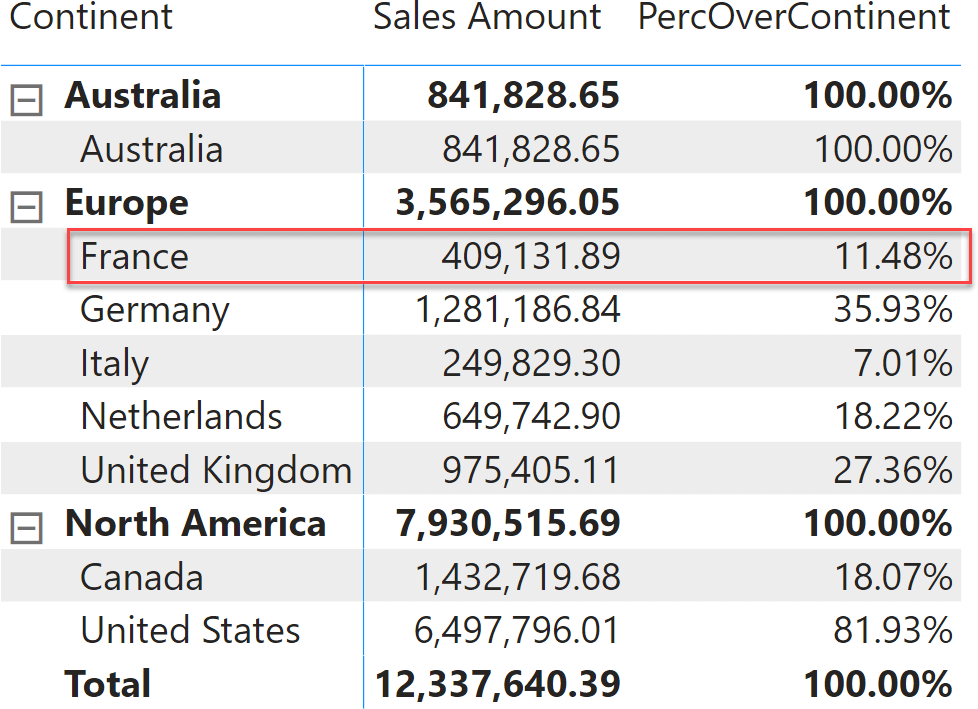
ALLEXCEPT is a handy DAX function to retrieve all the columns of a table except for some. When used as a CALCULATE modifier, its behavior is less intuitive and might result in inaccurate measures. In this article, we elaborate on… Read more
-
This article describes the semantic difference between ALLEXCEPT and the joint use of ALL and VALUES, showing practical examples of the different results in Power BI and SSAS 2016. Read more
-

The new video course to create enterprise-level solutions with Power BI and Analysis Services is available! Read more