-
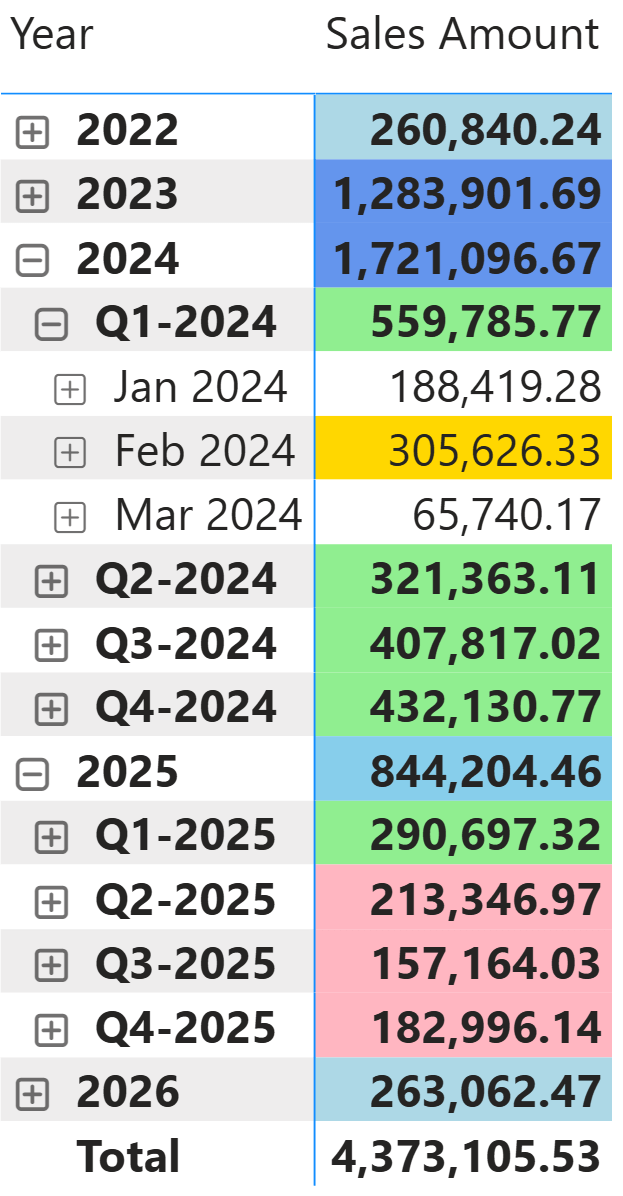
This article describes how to apply different formatting rules at each level of a hierarchy (one rule at the year level, another at the quarter level, another at the month level) using ISINSCOPE in a measure or ISATLEVEL in a… Read more
-

What is the right choice between Direct Lake and Import mode in Power BI? Read more
-

3 years ago, we wrote our “Generative AI guidelines at SQLBI”. We think it’s time to update them. Over the past 3 years, the world has changed: it is simply no longer possible to avoid using generative AI services for… Read more
-
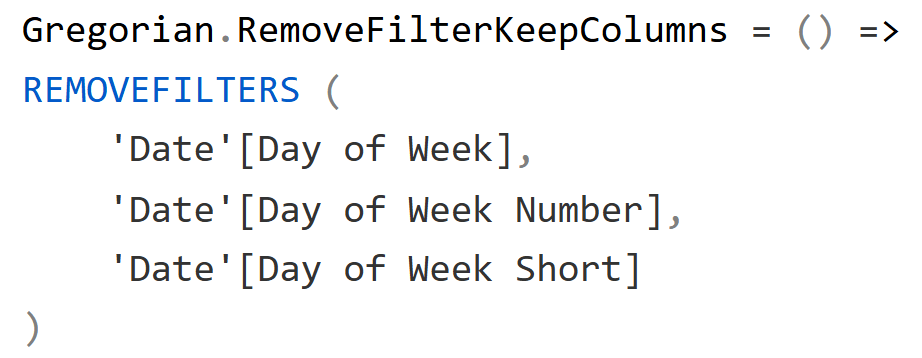
In this article, we implement a function that removes filter-keep column filters from a calendar, using REMOVEFILTERS as the return value of the function. Read more
-
In its first two months, DAX Formatter served 3,500 requests and I see the daily trend slowly raising. If you have observed carefully the first articles published on DAX Patterns, you might have seen that you can click the link”Code beautified with DAX Read more
-
Applying security roles to a Power BI model or to an SSAS Tabular database might impact query performance. This article describes existing issues and possible workarounds. This is an advanced article; a good knowledge of the storage engine and formula… Read more
-
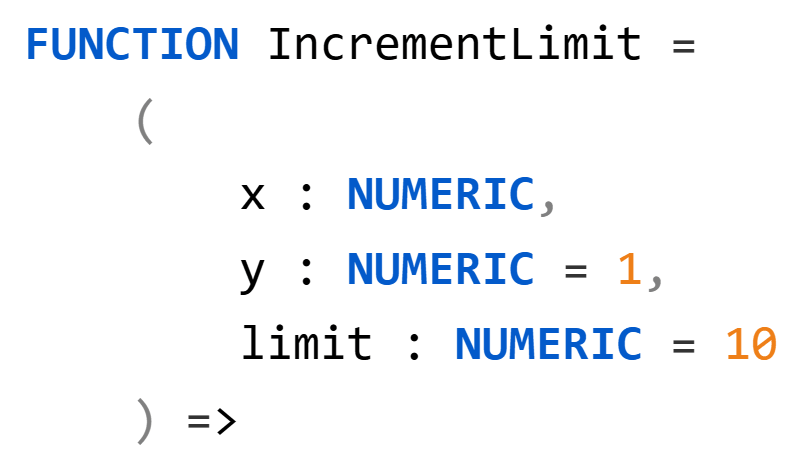
This article describes how to define optional parameters in DAX user-defined functions and set default values for parameters not specified by the caller. Read more
-
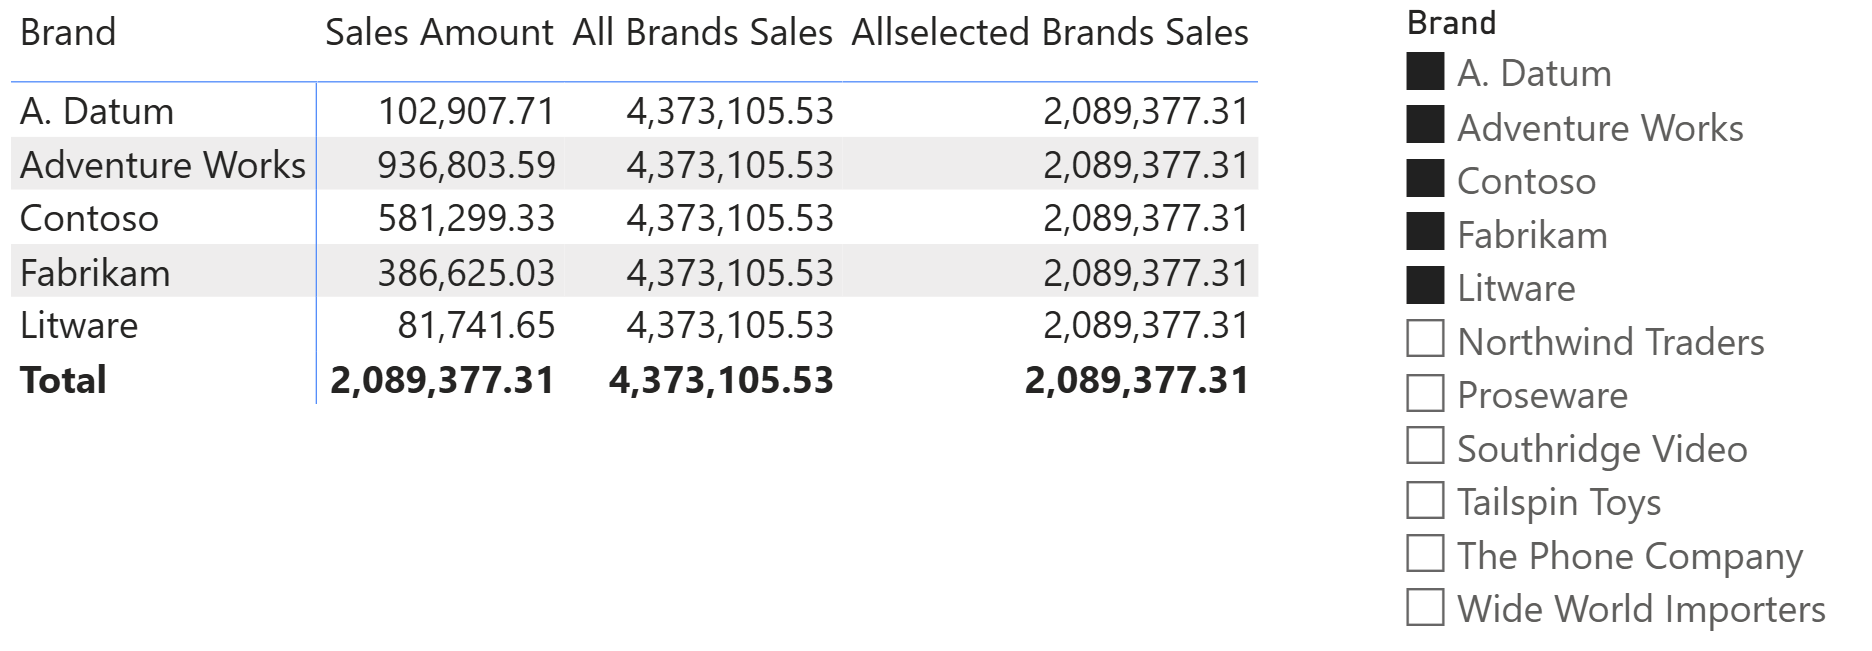
DAX offers many functions to remove filters from the filter context. In this article, we analyze the differences among the most commonly-used functions. Read more
-
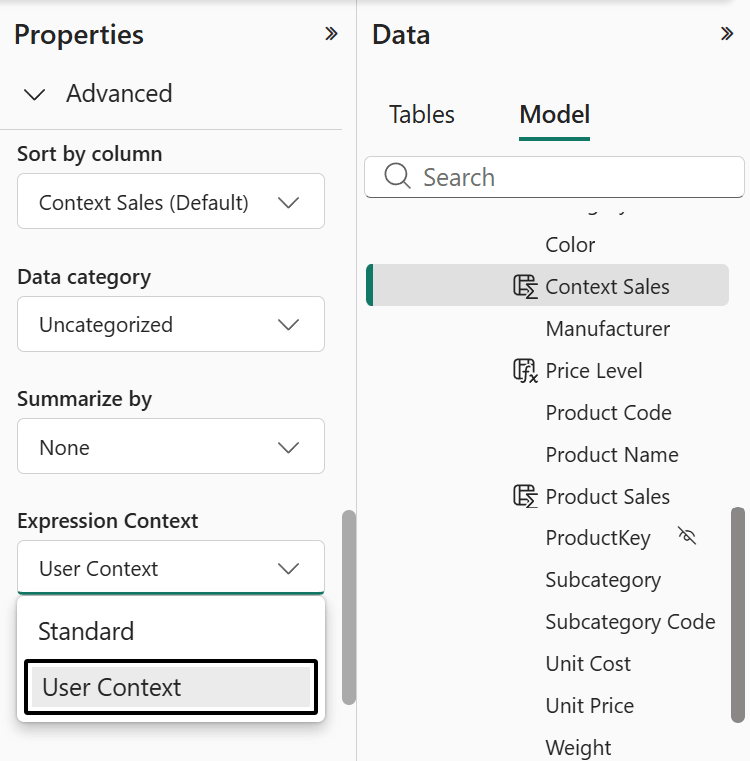
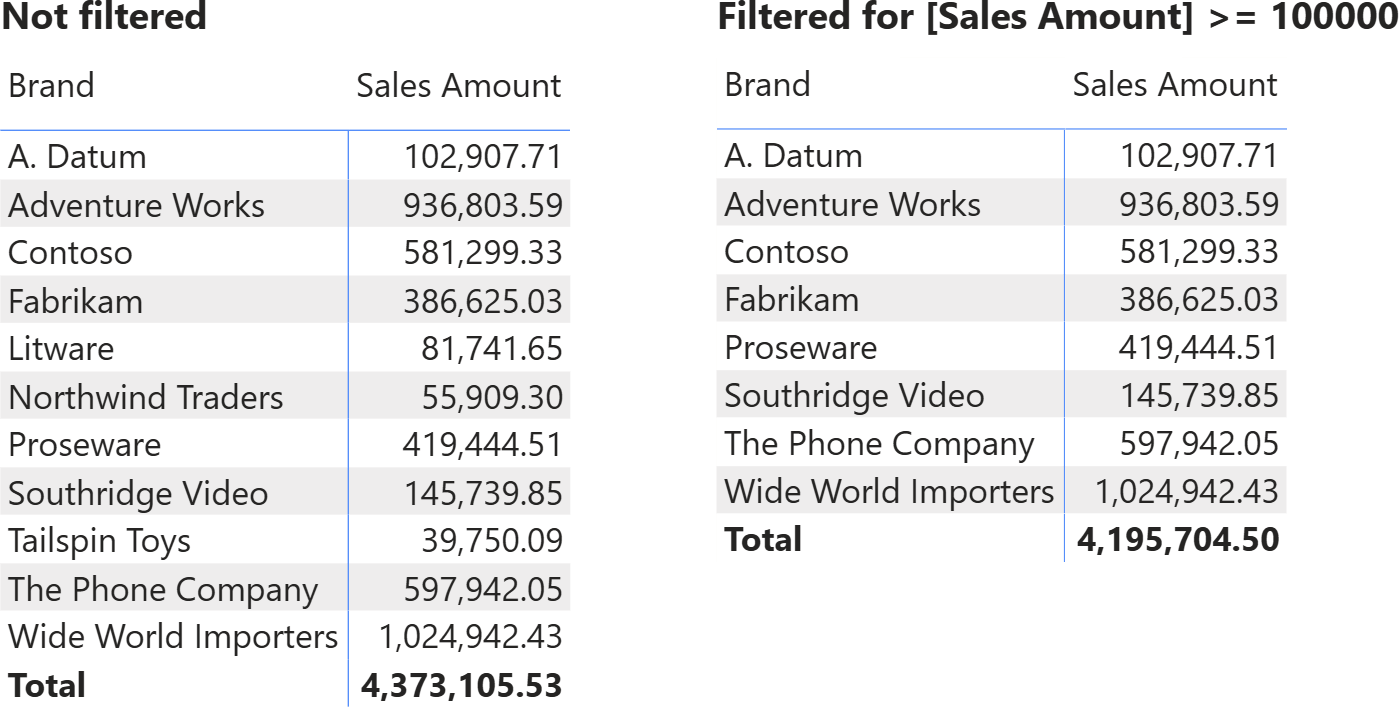
This article describes the new Expression Context property of calculated columns in Power BI, explaining how user-aware calculated columns work, why they are not materialized, and how to use them as virtual calculated columns for localization and custom security scenarios. Read more
-
A slicer cannot filter a measure. In this article, we analyze this common request by explaining how to use a slicer to filter a measure, after discussing the real meaning of using a measure with a slicer. Read more