In my last post about Parent/Child hierarchies, there is a question, in the comments, that I found interesting. Nevertheless, the formula is a complex one and cannot be written in a simple comment. Thus, I am making a follow-up to that post. I am not repeating all the stuff of the previous post so, please, read that before reading this one, to have the necessary background.
The question looks a simple one: “If you needed a measure (SumOfLeafAmount) that only shows children values, what would it be like?”
I was about to answer that “I have a formula that is too large to fit in the margin” but… Fermat did it some years ago and caused a real mess. I don’t want to be responsible for such a complication. Thus, I am providing the answer in this new blog post. And… hey, no, I don’t consider myself anyhow similar to that genius, I’m just joking!
There two interesting points in this simple question:
- There are two interpretation of the formula: one is “sum only the leaves”, the other ones is “sum only the children”. Both are valid and interesting formulas, but they will lead to completely different implementations, and I am going to show both.
- During the development of the “sum of the children” we are going to hit the CALCULATE wall with our head and… yes, it hurts.
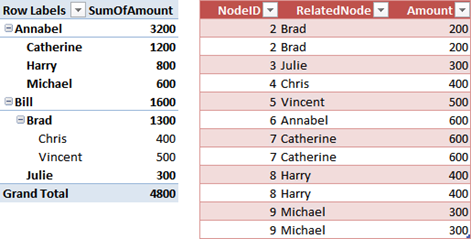
Let us start with the set of data we are going to work on. The first figure is the hierarchy:

And, in the second one, I have put in the same figure a PivotTable containing the P/C structure with the SumOfAmount measure and the content of the Invoices table, which is the source of the Amount column.
Now, what are the desired results?
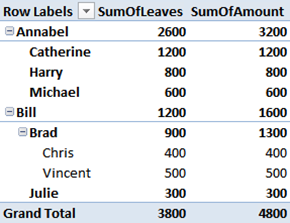
- SumOfChildren, for Bill, is 1600, because his amount is coming from children only, i.e. Brad, Chris, Vincent, Julie. Bill himself is not producing any sale. SumOfChildren for Brad, on the other hand, is 900, because he sold 400 by himself with two invoices.
- SumOfLeaves, for Bill, is 1200 because the value produced by Brad is not on a leaf. Brad has children, thus he is not a leaf and his value should not be aggregated. Among its children, only Brad has a SumOfLeaves greater than zero, because he has children, while all others (Chris, Vincent and Julie) are leaves.
In the case of Annabel, both formulas will return the same value because all of Annabel’s children are leaves.
Let us start with SumOfLeaves, which is pretty easy. Any row in the hierarchy can be a leaf or not. It is a leaf if it has no children, otherwise it is the parent of somebody, thus it is not a leaf. In other words, it is a leaf it there aren’t any rows in the hierarchy where the ParentNodeId has the value of the NodeId.
We can define a new calculated column, called IsLeaf, with this formula:
=
COUNTROWS (
    FILTER ( 'Hierarchy', 'Hierarchy'[ParentNodeID] = EARLIER ( [NodeId] ) )
) = 0
Or, if you are a real fan of Denali and of the new Parent/Child functions, this one works too (and, these days, it makes you look cooler):
=
COUNTROWS (
    FILTER (
        'Hierarchy',
        PATHCONTAINS ( 'Hierarchy'[HierarchyPath], EARLIER ( [NodeId] ) )
    )
) = 1
Now, the hierarchy has a new column:

And the formula for the measure SumOfLeaves becomes straightforward, just a simple usage of CALCULATE:
SumOfLeaves =
IF (
    [BrowseDepth] > [MinNodeDepth],
    BLANK (),
    CALCULATE ( SUM ( Invoices[Amount] ), 'Hierarchy'[IsLeaf] = TRUE )
)
The result, compared with SumOfAmount, is very clear:
The reason for which SumOfLeaves is easy is because each row in the hierarchy is either a leaf or not, its behavior is easy to define. In the case of SumOfChildren, this is no longer true. Each row can be aggregated to the total or not, depending on the level we are browsing.
Take, for example, the value of Brad. When we are summarizing Brad’s amount, his value should not be computed, because he is not a child of himself. Thus, SumOfLeaves(Brad)=900. But, when we summarize the value of Bill, Brad is a children of Bill and the complete amount of 1300 should be computed for Bill’s amount. Same row, different behaviors… things are becoming interesting.
If we want to compute the sum of all the children of a node in a P/C hierarchy, it is enough to create a filter context that isolates the current root of the tree. Once we have isolated that row, we can create a FILTER expression that computes all the nodes but that one. The problem is that a row can be the root at some point and a regular node at other points, the difference being the value of BrowseDepth.
In order to understand the incoming formula, we need to take some time to study our data set. I have created a new measure, to see the value of NodeDepth inside the PivotTable, which basically shows the value only when a single row of the hierarchy is selected:
[Node Depth] =
IF (
    COUNTROWS ( 'Hierarchy' ) = 1,
    VALUES ( 'Hierarchy'[NodeDepth] ),
    BLANK ()
)
With this new measure, and after having modified slightly the definition of the Level1..3 calculated columns to always show the value of a node (it was previously blank), I got this very interesting figure:
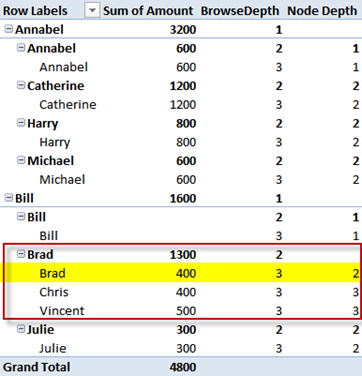
Up to now, we have used the difference between BrowseDepth and NodeDepth to hide rows. Now we will use the same values to compute the SumOfChildren. By carefully looking at the PivotTable, it is easy to verify that the SumOfChildren of Brad will need to avoid computing the highlighted row, where BrowseDepth > NodeDepth. Clearly, when computing the value for Brad, we will be interested in the rows in the red box, all others are of no interest.
When the same row (the highlighted one) will be computed for Bill’s total, the value of BrowseDepth will be 1, while NodeDepth will still be 2. In that case, the value of Brad will be used to compute the total for Bill.
Thus, by using this simple test, SumOfChildren will compute the sum of the values of all the children of a node, avoiding the node itself, which is the only one where the condition is false. With all this in mind, the formula is straightforward:
[SumOfChildrenWrong] =
IF (
    [BrowseDepth] > [MinNodeDepth],
    BLANK (),
    CALCULATE (
        SUM ( Invoices[Amount] ),
        FILTER ( 'Hierarchy', 'Hierarchy'[NodeDepth] > [BrowseDepth] )
    )
)
We use FILTER to remove the nodes whose NodeDepth is not higher than BrowseDepth. Add this measure to the PivotTale and this is the result:
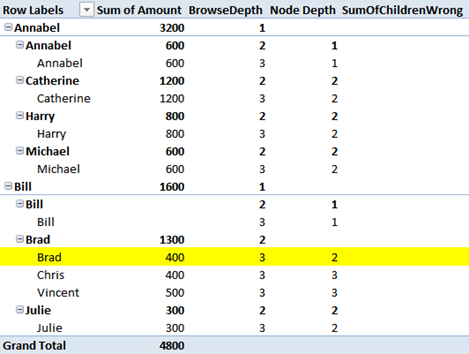
Et voilà, BLANK everywhere, not a single number shown. Something is wrong but… what? I strongly suggest you to check the formula by yourself at least twice before to continue reading because this is the CALCULATE wall and, hitting it, is always a pain.
Now, the solution. I already gave you the first hint: the problem has something to do with CALCULATE. Ok, how many CALCULATE do you see in the formula?
If you answered 1, which is the naïve answer, you are able to read a formula, but you hit the CALCULATE wall. If you answered zero, two or three, it means you need better glasses. But if you answered the only right answer, which is FOUR, then you have already touched the DAX karma: you already know what I am going to write.
Where are those four CALCULATE? We need to remember that whenever a MEASURE is used inside a formula, it is automatically surrounded by a hidden CALCULATE. And, in this formula, we have three measure calls:
- [BrowseDepth] in the first parameter of IF
- [MinNodeDepth] in the first parameter of IF
- [BrowseDepth] in the inner test of the FILTER
These three measures, plus the evident CALCULATE, make the total of four CALCULATE inside the formula.
Now, what happens for the [BrowseDepth] measure computed inside FILTER? We have a CALCULATE inside a loop, that means that the row context introduced by FILTER (yes, FILTER is an iterator, never forget it!) is converted into a filter context before evaluating the measure. Thus, the [BrowseDepth] is computed in a filter context where the only visible row of the Hierarchy table is the currently iterated row. Check it by yourself, the value of that [BrowseDepth] is always three, because only a single row of the hierarchy is visible. The original filter context is lost when that measure is computed.
The value of [BrowseDepth] inside the FILTER is NOT the value of [BrowseDepth] for the original filter context, it is the [BrowseDepth] in a new context introduced by the automatic CALCULATE added by the measure call.
If we want to compute our measure, we need to avoid that nasty CALCULATE created by the engine. The only way to do that is to remove the measure call and expand it to its measure definition (which you can find in my previous post):
[SumOfChildren] =
IF (
    [BrowseDepth] > [MinNodeDepth],
    BLANK (),
    CALCULATE (
        SUM ( Invoices[Amount] ),
        FILTER (
            'Hierarchy',
            'Hierarchy'[NodeDepth]
                > IF (
                    ISFILTERED ( 'Hierarchy'[Level3] ),
                    3,
                    IF (
                        ISFILTERED ( 'Hierarchy'[Level2] ),
                        2,
                        IF ( ISFILTERED ( 'Hierarchy'[Level1] ), 1 )
                    )
                )
        )
    )
)
The formula is identical to the previous one but, this time, we are not calling a measure, we are computing a formula. Thus, no automatic CALCULATE is added to the expression. Guess what? It now works as expected
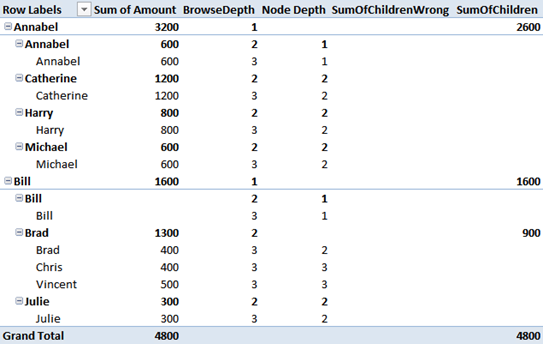
Now, you see that all the leaf level nodes do not have any value and this is expected, since their value is provide by themselves only, not by their non-existent children.
I personally don’t believe that this formula is really useful but it might mean something to a customer who give me some money to compute it. Thus, it would be useful at least for me. The interesting point of this post is that DAX is simple, but not easy. This is the best definition of DAX I have ever heard. Until you fully understand CALCULATE and all its implications… DAX will be a black art. Take your time to study it, and DAX will become your best friend.
Evaluates an expression in a context modified by filters.
CALCULATE ( <Expression> [, <Filter> [, <Filter> [, … ] ] ] )
Returns a table that has been filtered.
FILTER ( <Table>, <FilterExpression> )
Returns a blank.
BLANK ( )
Checks whether a condition is met, and returns one value if TRUE, and another value if FALSE.
IF ( <LogicalTest>, <ResultIfTrue> [, <ResultIfFalse>] )