-
We released a new course for SQLBI+ subscribers: Understanding Visual Calculations in DAX. This is not an introduction to visual calculations for users. The goal is to explain the details of implementing visual calculations for experienced DAX developers, including new… Read more
-
Visual calculations are a new feature in DAX that aims to simplify the use of DAX for users by introducing calculations at the visual level rather than at the model level. Read more
-
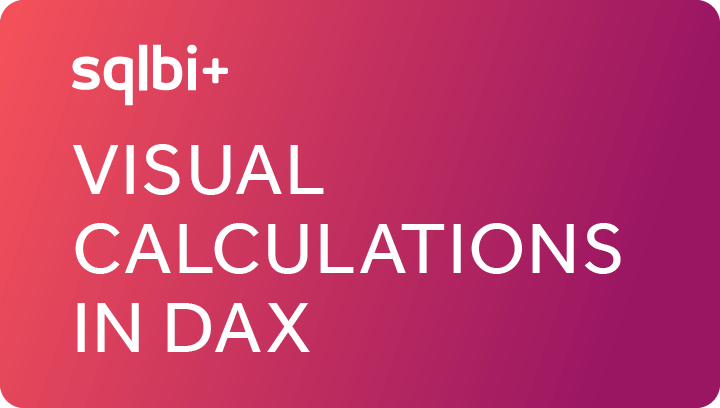
This article describes how to use the TOJSON and TOCSV functions to inspect the content of intermediate table variables when debugging a DAX measure. Read more
-
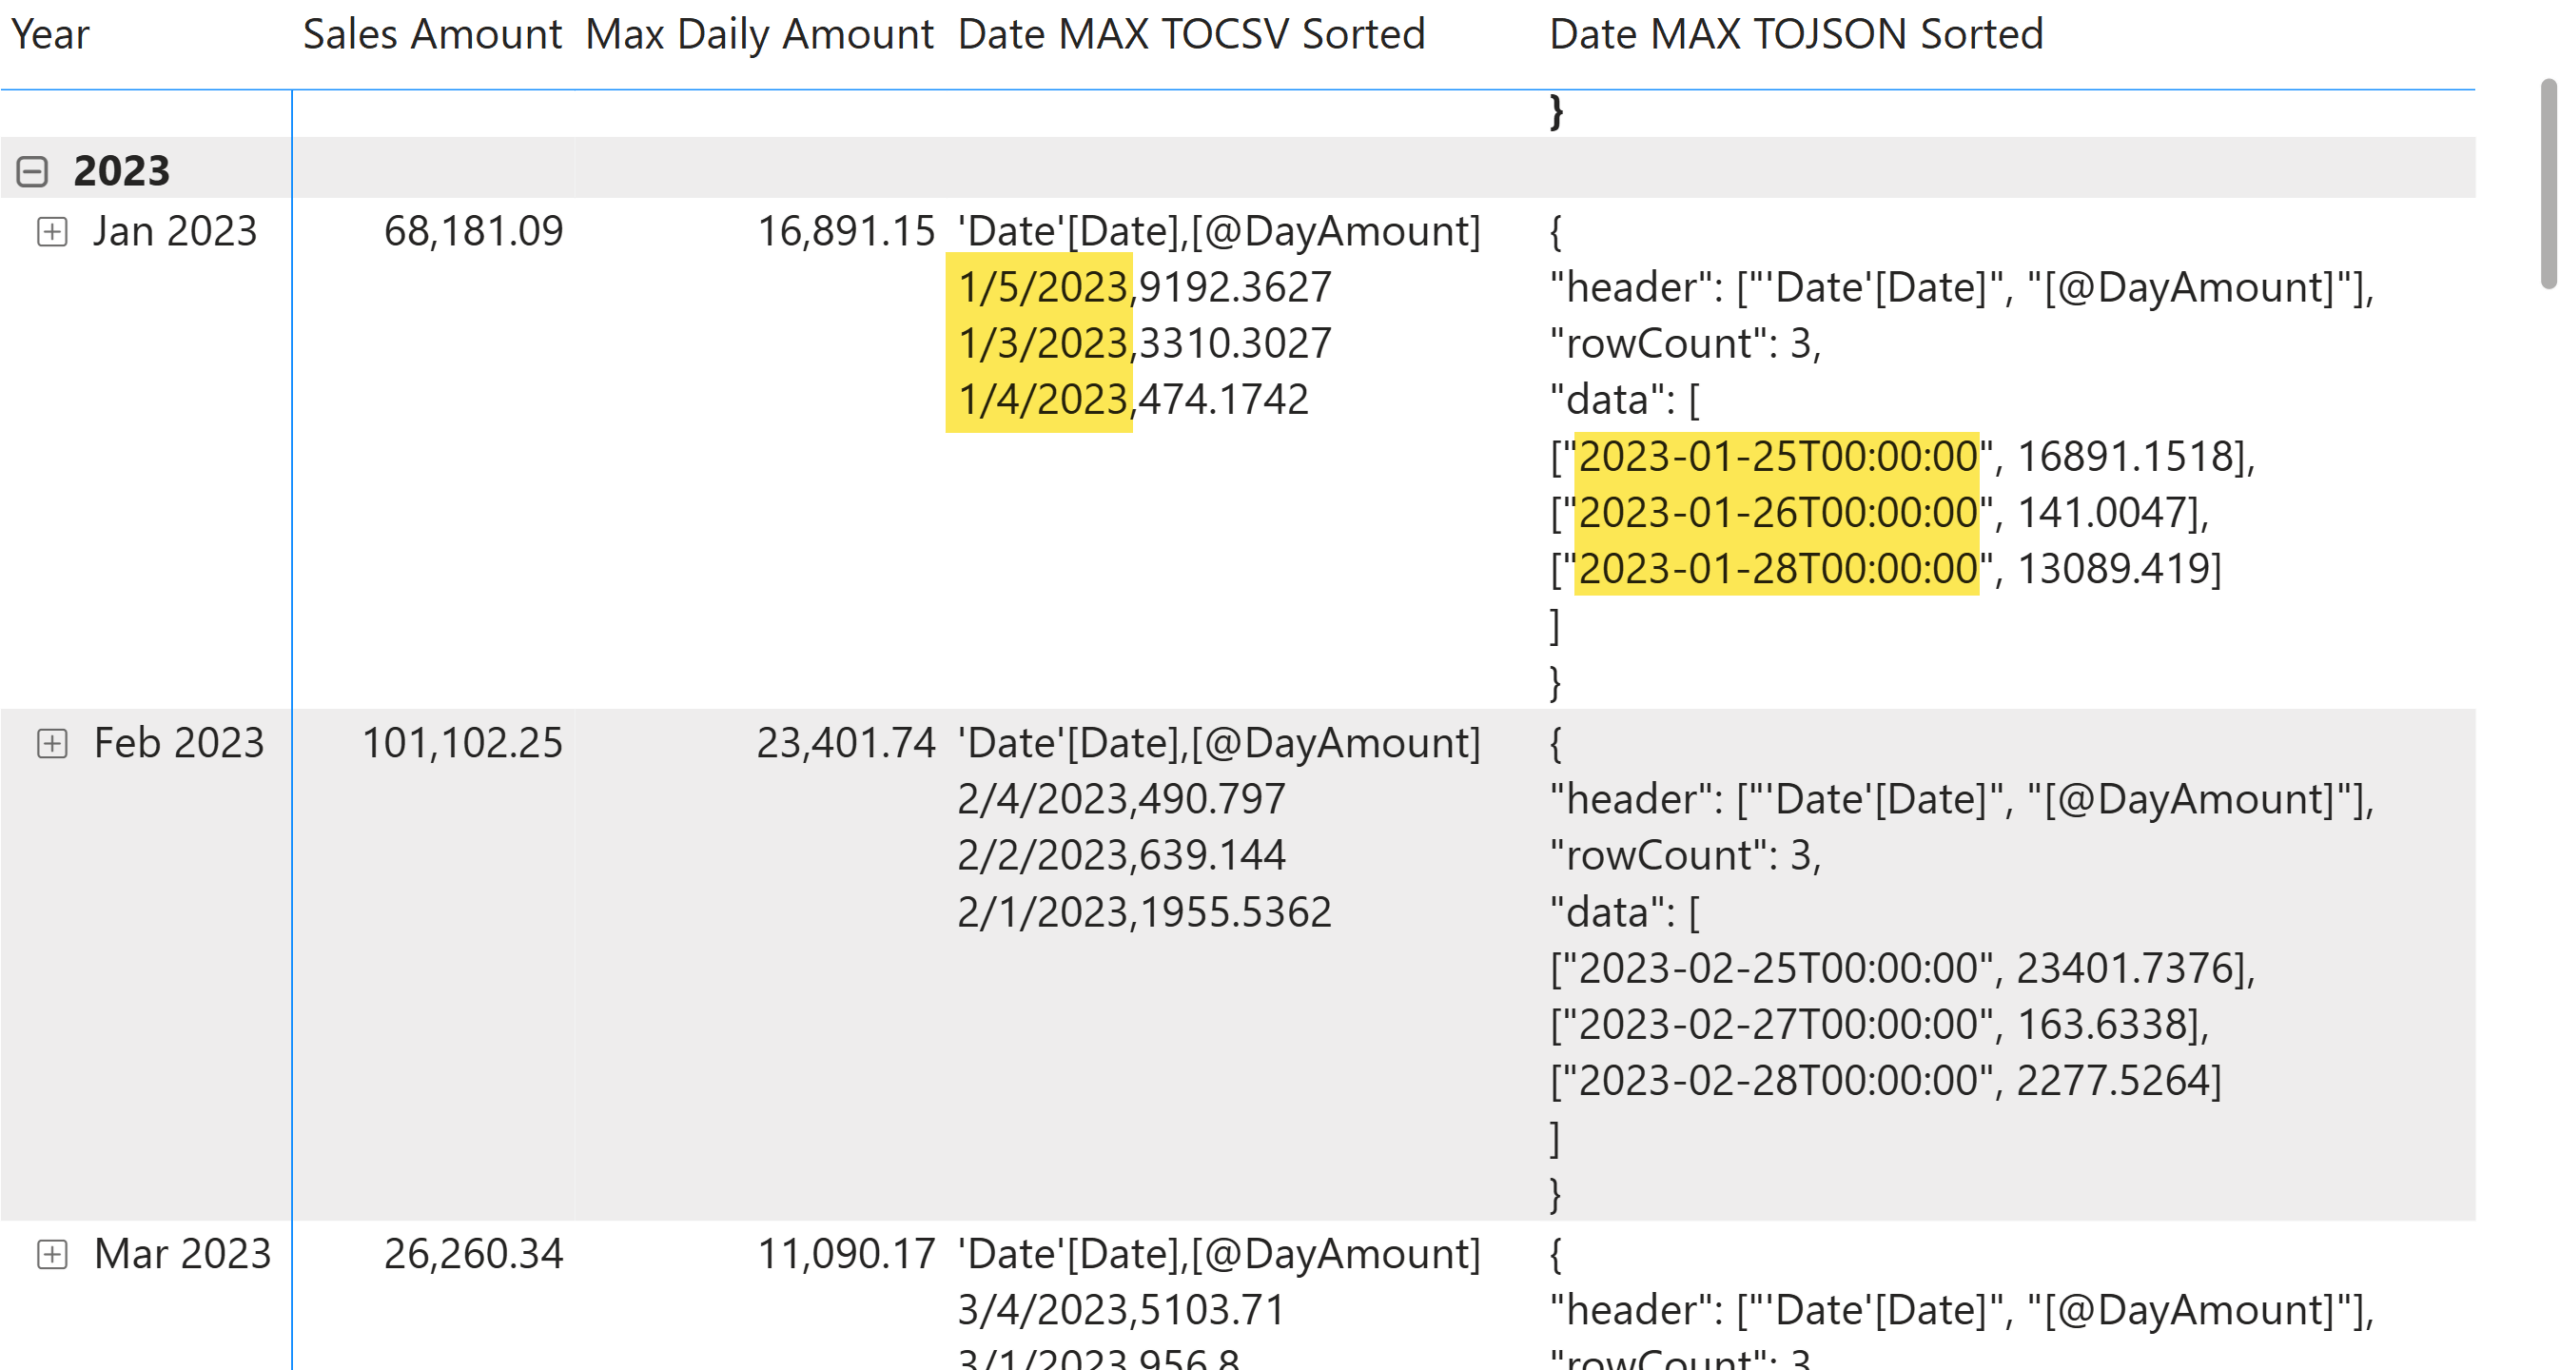
The new calendar-based time intelligence functions offer greater flexibility than the classic time intelligence functions. This article describes the DATEADD parameters for controlling different granularity shifts. Read more
-
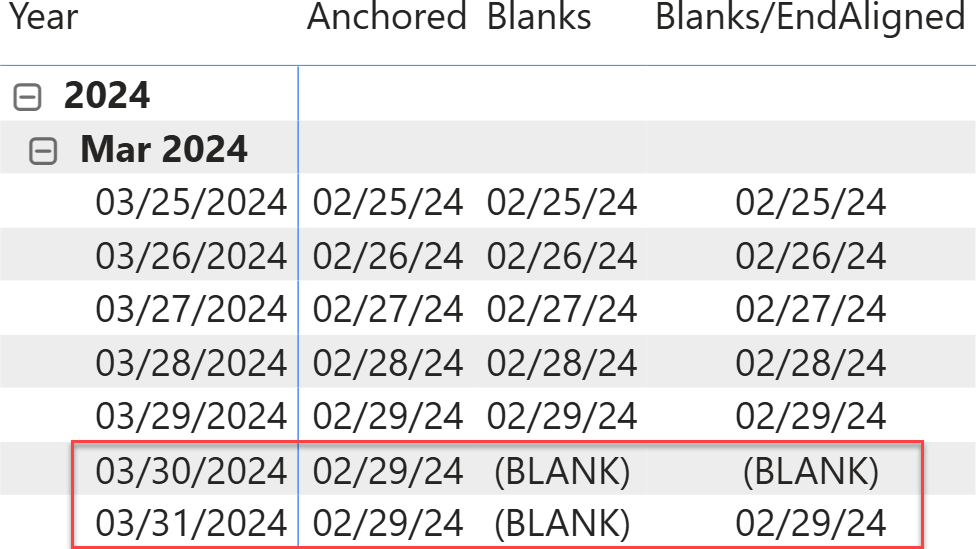
This article introduces the new calendar-based time intelligence functions in DAX, available in preview from the September 2025 release of Power BI. Read more
-
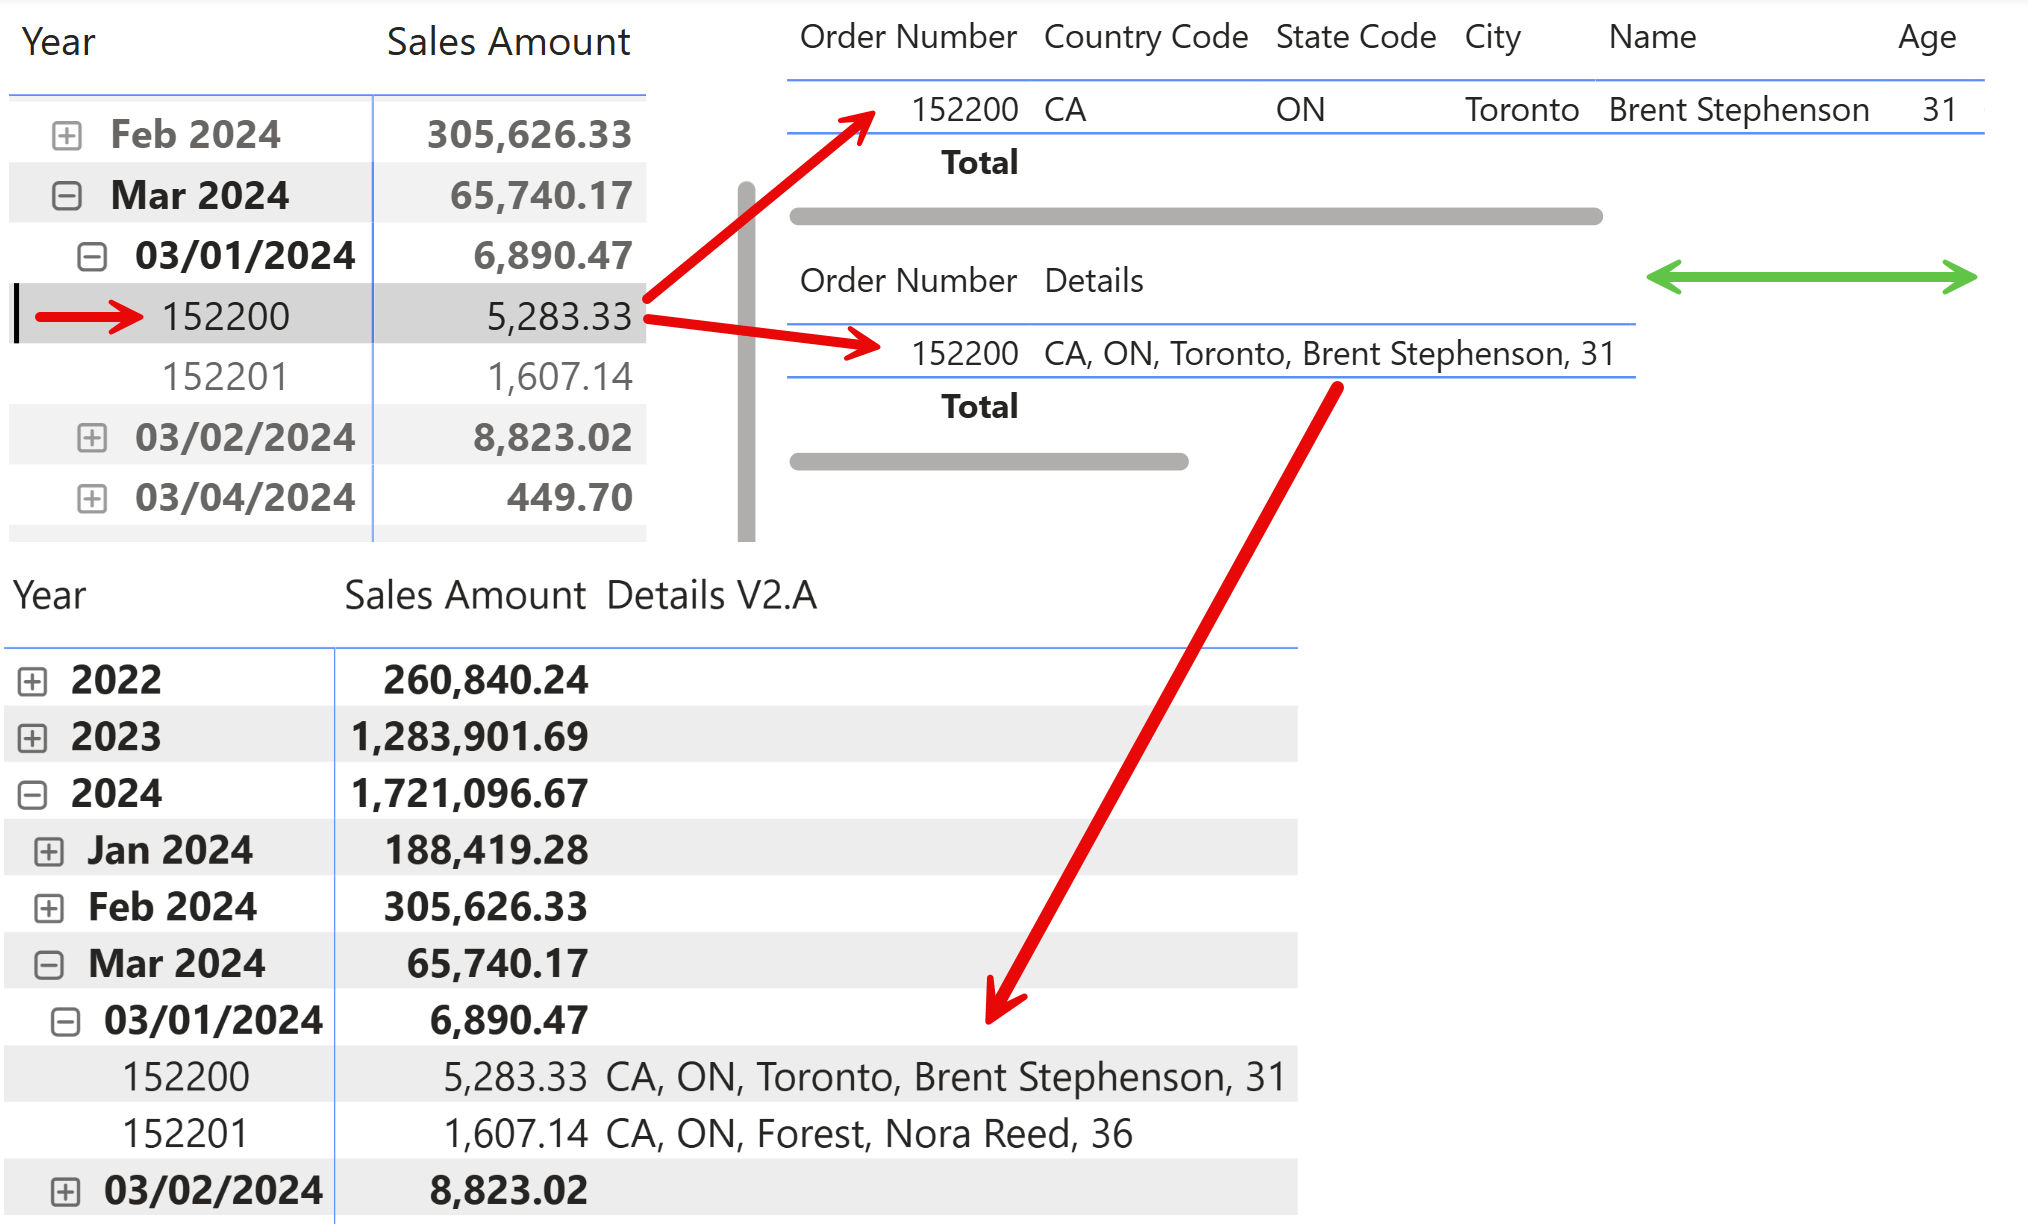
This article shows how to create a DAX measure that displays information from multiple columns in a business entity or transaction, into a single column of a matrix. Read more
-
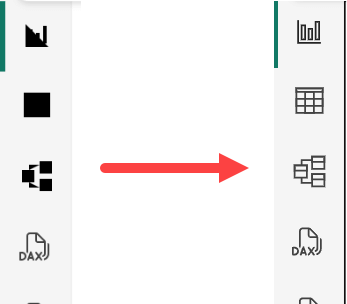
In mid-January 2026, many Power BI Desktop users began noticing a strange visual regression: several icons in the interface—including the Data, Model, and DAX icons—appeared as solid black shapes instead of their normal outlines. The issue appeared suddenly, even on… Read more
-

It is time for our annual review of what happened in the DAX and SQLBI worlds, and what we should expect in 2026! Read more
-
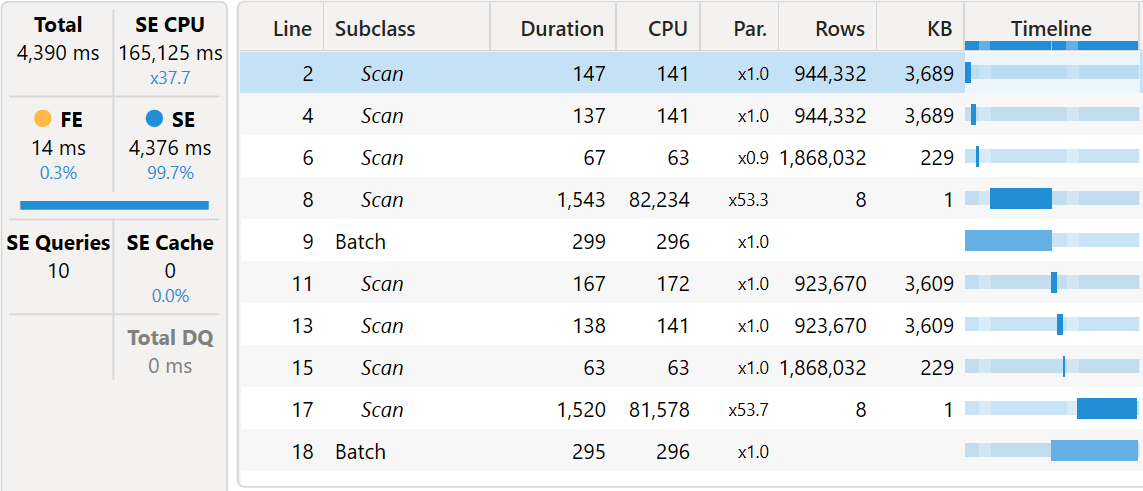
This article analyzes the performance of regular versus limited relationships in DAX to understand the implications of using limited relationships. Read more
-
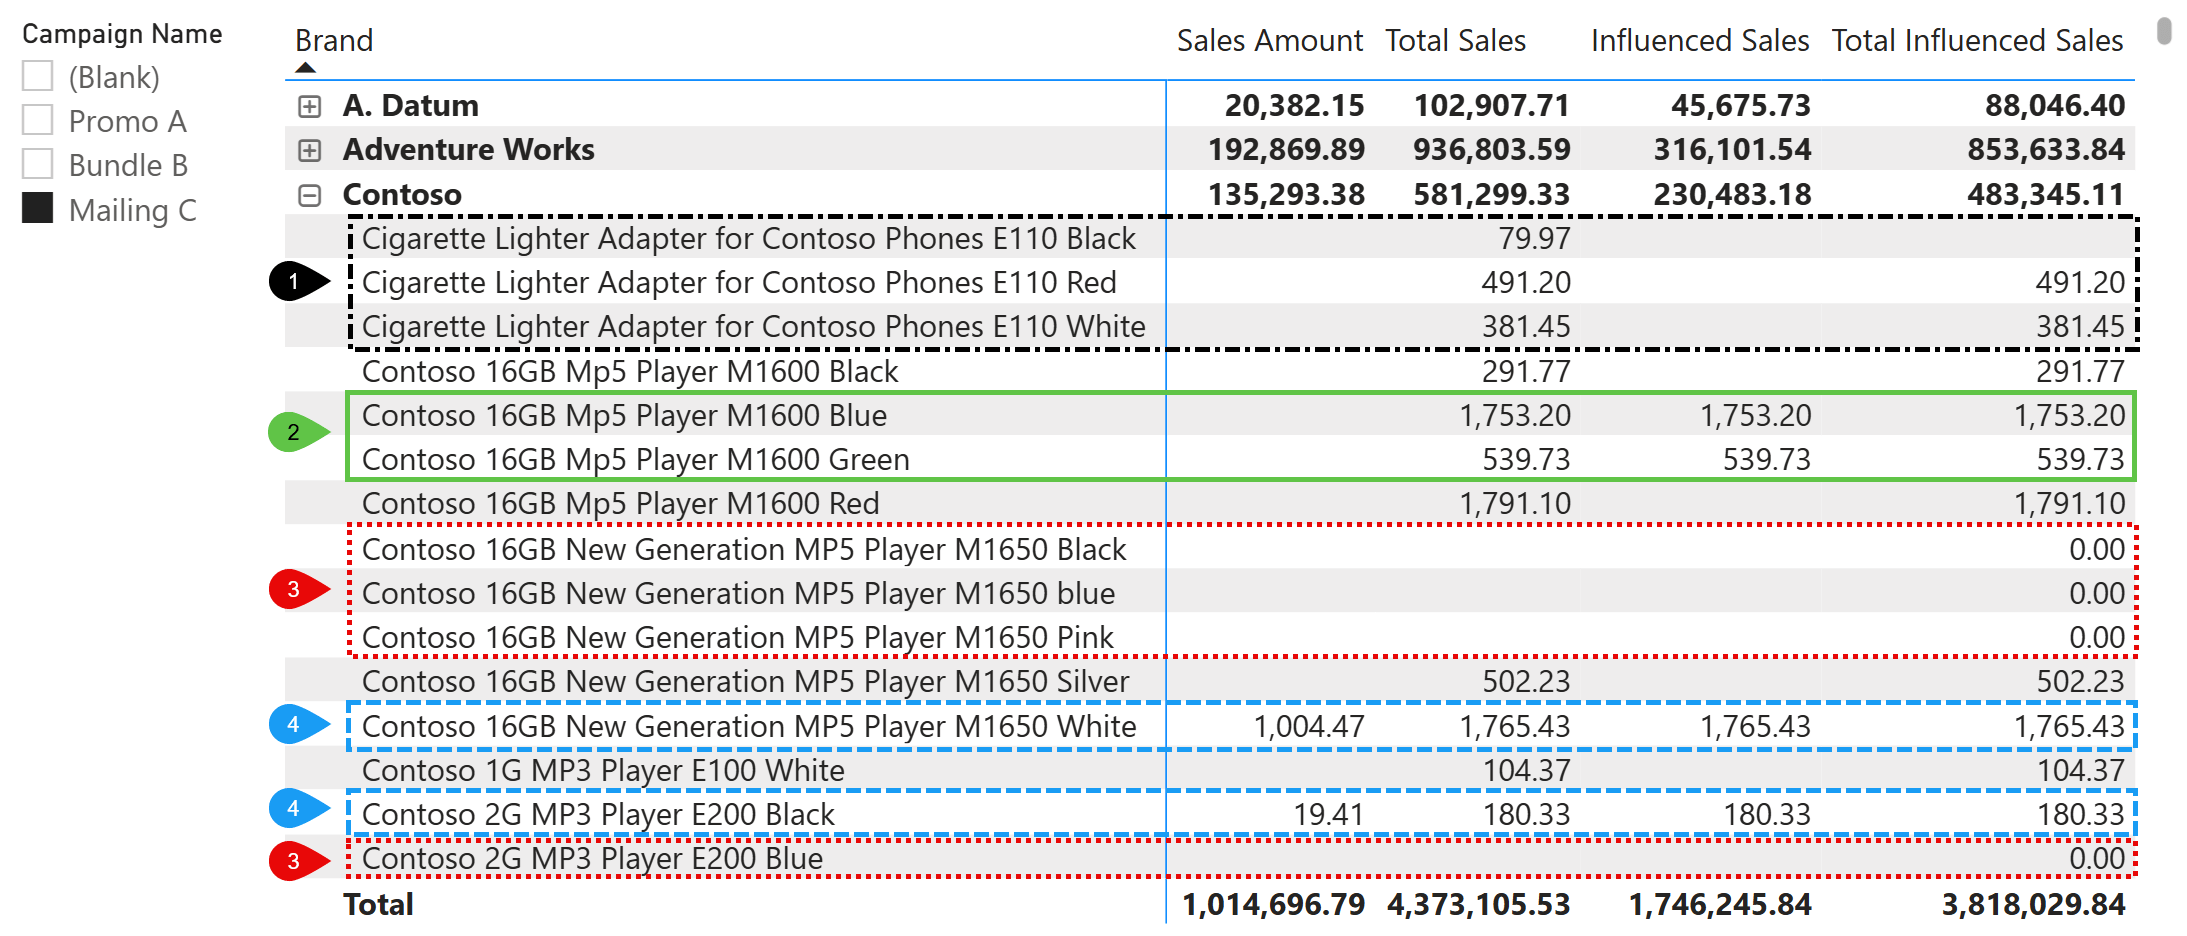
This article describes the data model and DAX measures to analyze the effectiveness of campaigns, by separating attributed sales (directly linked to a campaign) from influenced sales (all sales of products participating in campaigns, regardless of attribution). Read more