 Marco Russo & Alberto Ferrari
There are two ways to describe what ALLSELECTED performs and what its use cases are: a simple way and a complex way. In this article, we focus on a simple description of the function and its main use cases. We also provide details about when and how you can use ALLSELECTED without having to worry about the intricate details. If and when you want to go to the next level, invest the proper amount of time required to study this article: The definitive guide to ALLSELECTED. Be careful, the details are really complex and if you stick to the best practices, you can safely ignore said details. A real DAX guru should know all the details, but in this article we focus more on an introduction to ALLSELECTED.
Because of its inherent complexity, we describe ALLSELECTED by first focusing on a business case where ALLSELECTED is a good fit. We then provide an imperfect – yet useful – description of what ALLSELECTED is performing. And finally we provide the few best practices to follow when using ALLSELECTED. We will not provide the complete description of ALLSELECTED in terms of shadow filter context, not even as an introduction.
Let us start with the use case. Let us pretend you want to create the following report.
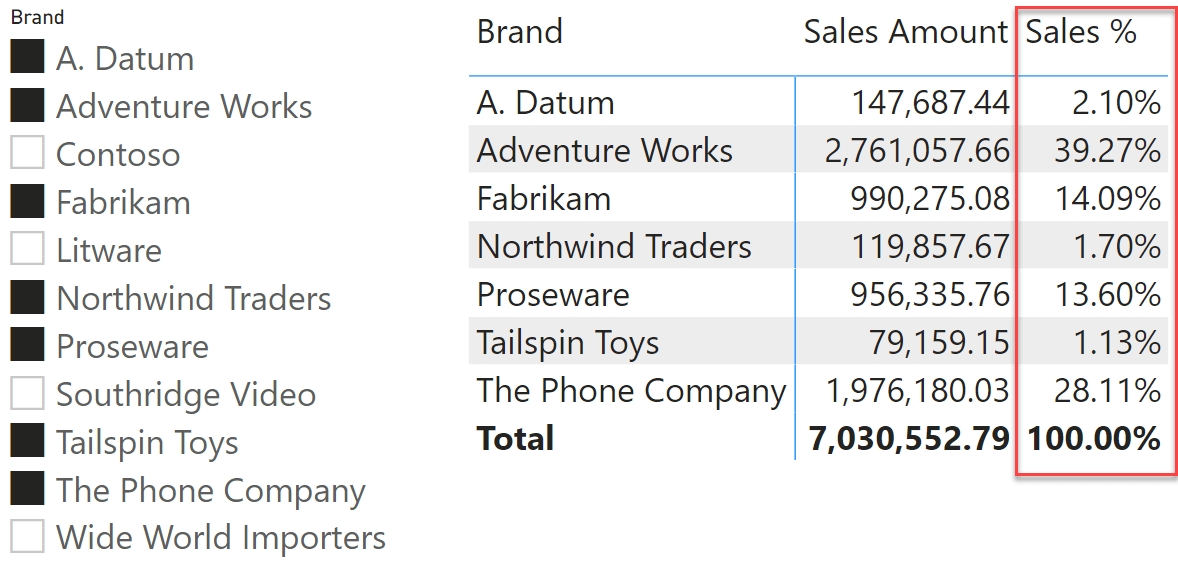
The matrix shows in Sales % the percentage of sales against the grand total. What makes this calculation non-trivial is that the percentage needs to be computed by dividing the value of Sales Amount in the current filter context by Sales Amount computed in a filter context where a filter on the Brand column is removed.
The usual function to remove filters from a column is ALL, in conjunction with CALCULATE, as shown in this first measure:
Sales % Wrong :=
DIVIDE (
    [Sales Amount],
    CALCULATE (
        [Sales Amount],
        ALL ('Product'[Brand] )
    )
)
Unfortunately, this basic technique does not work in our scenario because of the presence of the additional filter coming from the slicer. Indeed, we notice that the Sales % Wrong measure returns incorrect values.
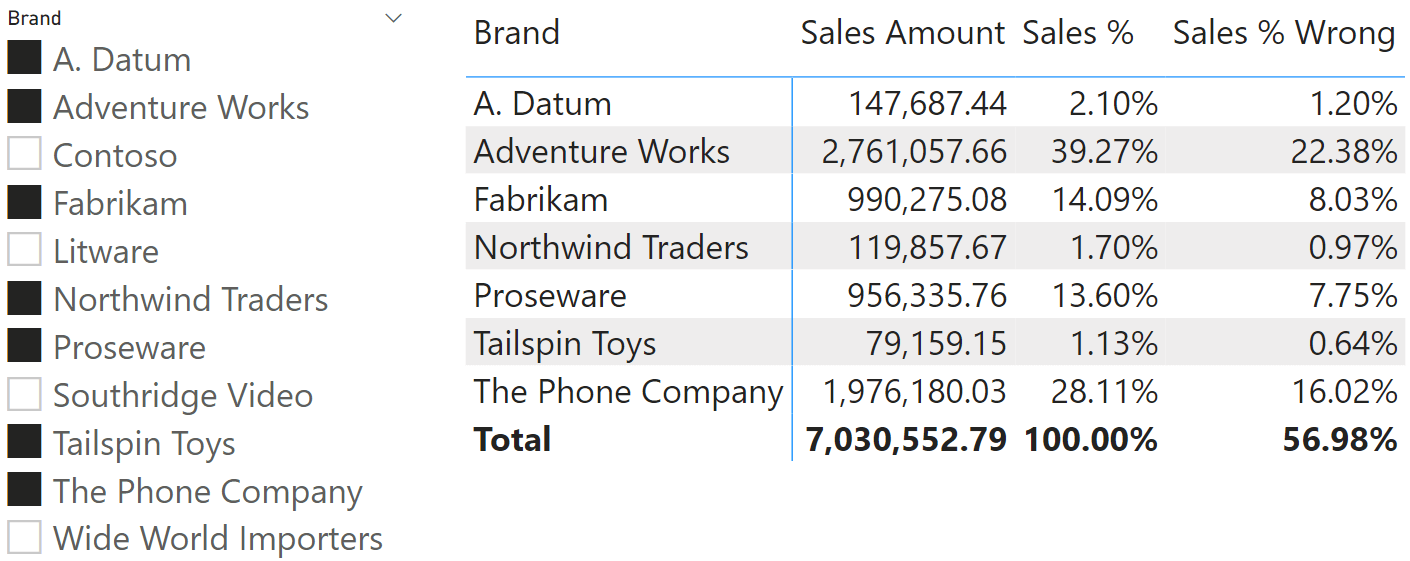
The reason Sales % Wrong does not compute an accurate percentage is because ALL removes any filter on Product[Brand] from the filter context. This includes both the filter in the current matrix and the filter introduced by the slicer. As a consequence, ALL restores a filter context with no filter whatsoever on Product[Brand], computing at the denominator the grand total of sales.
What we want to achieve is different. We want to divide by the number shown in the matrix as the grand total that includes the filter from the slicer. These kinds of calculations are known as Visual Totals, where we want to compute the total shown on the visual instead of the total in the database.
ALLSELECTED is specifically designed to achieve visual total calculations. ALLSELECTED removes the filter created by the current visual (the matrix) and it restores the previous filter context, that is the filter created by the slicer. Indeed, the correct way of computing Sales % is to use ALLSELECTED instead of ALL:
Sales % :=
DIVIDE (
    [Sales Amount],
    CALCULATE (
        [Sales Amount],
        ALLSELECTED ('Product'[Brand] )
    )
)
You can pass a column reference to ALLSELECTED, as we did in this example, or you can pass a full table. ALLSELECTED restores the outer filter context on either the individual column or all the columns of the table. You can also use ALLSELECTED without any arguments. In that case, the outer context is restored for all the tables in the model. Using different parameters, you obtain different behaviors. Therefore, as is always the case with DAX, you need to carefully evaluate your requirements to obtain the desired effect.
You can also use ALLSELECTED as a table function, to retrieve the rows that are selected outside of the current visual. We now show a slightly more complex DAX expression as an example. We want to categorize brands based on their margin performance among the selected brands, using three clusters: Low, Medium and Top. In order to obtain our goal, we want to compute the minimum and maximum margin percentages. We divide the range between min and max into three segments. We then check whether the current selection fits in the first, second, or third segment and we assign accordingly to classes.
The calculation is rather simple. The only complex part is computing the min and max of Margin % among the selected brands; we accomplish the task by iterating over all the selected brands:
Brand Class :=
IF (
    ISINSCOPE ( 'Product'[Brand] ),
    VAR MinMargin =
        MINX (
            ALLSELECTED ( 'Product'[Brand] ),
            [Margin %]
        )
    VAR MaxMargin =
        MAXX (
            ALLSELECTED ( 'Product'[Brand] ),
            [Margin %]
        )
    VAR Step = ( MaxMargin - MinMargin ) / 3
    VAR CurMargin = [Margin %]
    VAR Result =
        SWITCH (
            TRUE (),
            CurMargin <= MinMargin + Step * 1, "Low class",
            CurMargin <= MinMargin + Step * 2, "Medium class",
            "Top class"
        )
    RETURN
        Result
)
Here is the Brand Class measure used in a report:
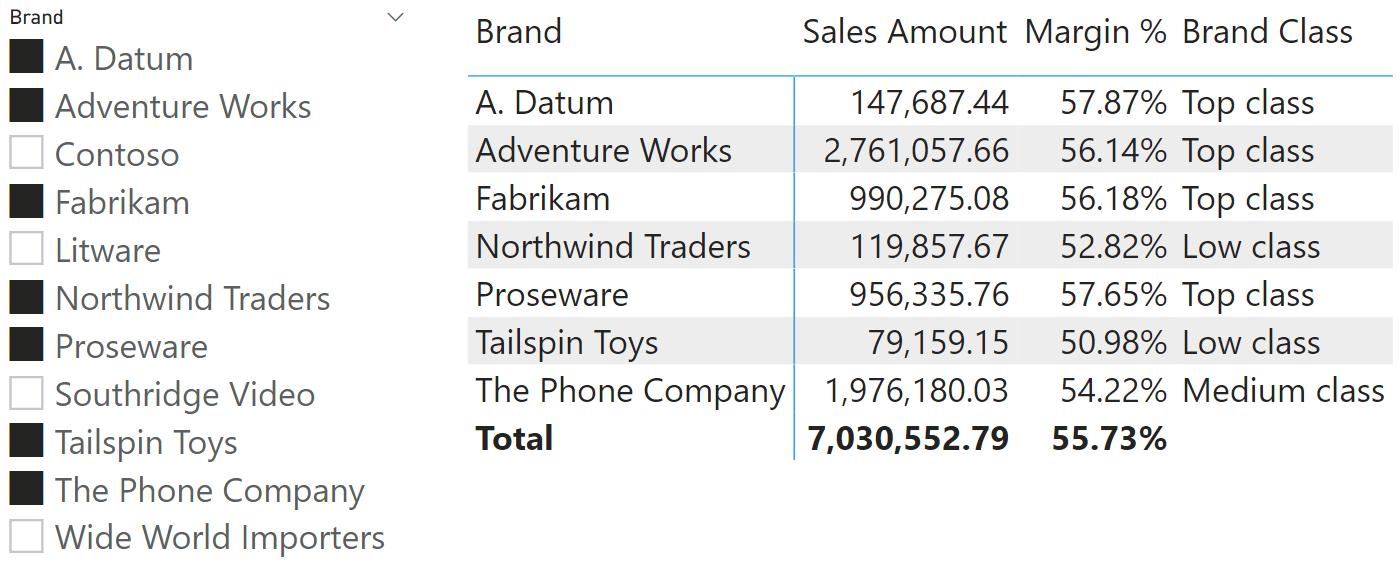
By using ALLSELECTED, the user experience is smooth. The clustering occurs by using values that are clearly visible in the report: the minimum and maximum margin percentages are shown in the matrix. Besides, changing the selection with the slicer changes the parameters in a very visual way.
Before moving on, we need to bring something to your attention: ALLSELECTED is much more complex than this short explanation could show. In order to accomplish its task, ALLSELECTED makes use of shadow filter contexts created by iterators, and it relies on the iterator created by the visual to be the only iteration active when the measure is being computed. You can find a full explanation of the topic in this article: The definitive guide to ALLSELECTED. For the sake of simplicity, we shorten that complex article into this best practice: never use ALLSELECTED inside an iteration.
For example, the following code is very dangerous, because ALLSELECTED is used inside an AVERAGEX which is an iterator:
AVERAGEX (
    ALL ( 'Product'[Brand] ),
    CALCULATE (
        [Margin %],
        ALLSELECTED ()
    )
)
It is not that ALLSELECTED would not work in this code snippet. The problem is that ALLSELECTED semantics are very complex, nearly beyond human comprehension. Therefore, you might obtain crazy numbers that are extremely complex to explain and most likely not the ones you were needing.
Whenever you need to perform visual calculations, ALLSELECTED is your best friend. You can safely leverage ALLSELECTED as long as you avoid using iterators before calling the function. Beware that this can also happen if you use an iterator and then call a measure that in turn uses ALLSELECTED. Finally, beware that ALLSELECTED might fail in restoring the correct filter if it is called by another measure. Generally speaking, the rule is quite simple if you want to stay on the safe side: you can use ALLSELECTED in a measure that is directly put in a report, but you should never call a measure that contains ALLSELECTED. If you obtain unexpected results when using ALLSELECTED, then it is time to refer to the more advanced article, where we go much deeper on the inner workings of ALLSELECTED.
Returns all the rows in a table, or all the values in a column, ignoring any filters that might have been applied inside the query, but keeping filters that come from outside.
ALLSELECTED ( [<TableNameOrColumnName>] [, <ColumnName> [, <ColumnName> [, … ] ] ] )
Returns all the rows in a table, or all the values in a column, ignoring any filters that might have been applied.
ALL ( [<TableNameOrColumnName>] [, <ColumnName> [, <ColumnName> [, … ] ] ] )
Evaluates an expression in a context modified by filters.
CALCULATE ( <Expression> [, <Filter> [, <Filter> [, … ] ] ] )
Calculates the average (arithmetic mean) of a set of expressions evaluated over a table.
AVERAGEX ( <Table>, <Expression> )
Articles in the DAX 101 series
- Computing running totals in DAX
- Counting working days in DAX
- Summing values for the total
- Year-to-date filtering weekdays in DAX
- Creating a simple date table in DAX
- Automatic time intelligence in Power BI
- Using CONCATENATEX in measures
- Previous year up to a certain date
- Sorting months in fiscal calendars
- Using USERELATIONSHIP in DAX
- Mark as Date table
- Row context in DAX
- Filter context in DAX
- Introducing CALCULATE in DAX
- Understanding context transition in DAX
- Using KEEPFILTERS in DAX
- Variables in DAX
- Using RELATED and RELATEDTABLE in DAX
- Introducing ALLSELECTED in DAX
- Introducing RANKX in DAX