 Marco Russo
UPDATE 2020-11-10: Power BI has now the “fusion” optimization described in the remaining part of this article. While Analyze in Excel can still have slower performance compared to a native Power BI report, the presence of multiple measures in a PivotTable is no longer an element that creates a performance bottleneck by itself. The article has been updated removing the suggestion to attenuate the lack of fusion optimization, which is now available. Azure Analysis Services has the same optimization. SQL Server Analysis Services (including SSAS 2019) does not have such optimization.
Power BI uses the Analysis Services Tabular engine to process queries coming from reports. When you create a Power BI report, the query sent to the engine uses the DAX language, which usually produces more optimized query plans. However, the Analysis Services engine is also able to understand MDX queries sent to a Tabular model. Excel is a client tool that can connect to an Analysis Services database sending queries in MDX.
Thanks to the bilingual feature (DAX/MDX) in Analysis Services, Microsoft quickly introduced a new server technology in the market: the Tabular model, based on DAX. This was done by leveraging tools that existed for another technology, the Multidimensional model based on MDX. Many optimizations were introduced for DAX queries over the last few years, in order to improve the Power BI user experience; however, sometimes there are no equivalent optimizations for MDX queries, resulting in Excel reports that run slower than equivalent Power BI reports. This article describes what is causing many of these differences; it also presents possible workarounds and highlights features that Microsoft might want to make a priority, in order to improve the experience for Excel users connected to Power BI datasets or Analysis Services Tabular databases.
Differences between an Excel PivotTable and a Power BI matrix
Power BI generates one or more DAX queries for a single matrix in a report. For example, the following matrix displays a few measures grouped by customer Country and sorted by Sales Amount.
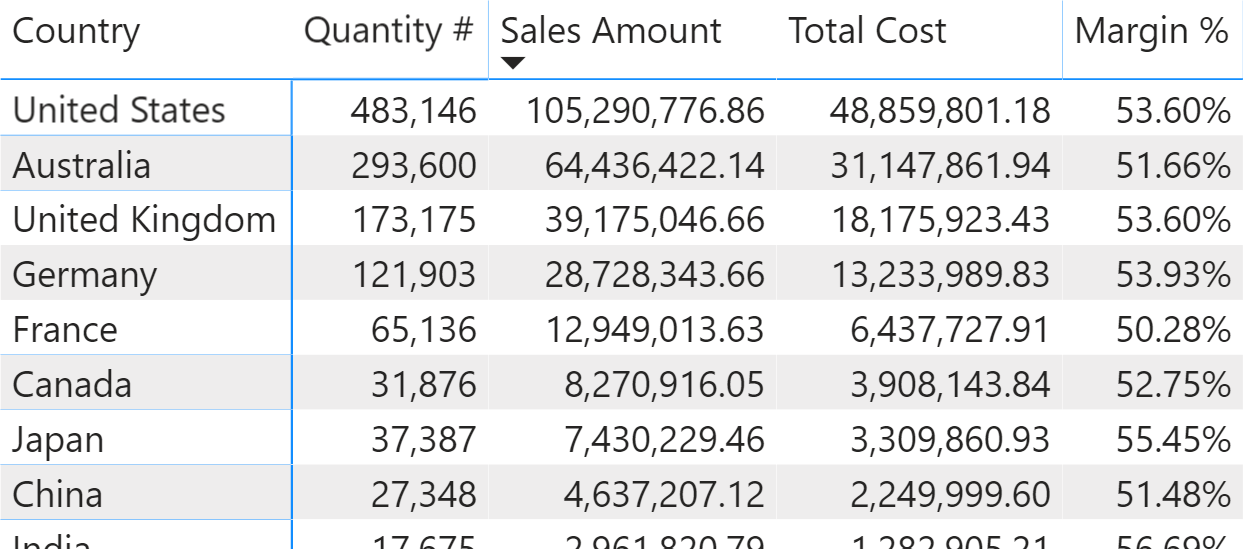
The measures used in this report are straightforward:
Quantity # :=
SUM ( Sales[Quantity] )

Sales Amount :=
SUMX ( Sales, Sales[Quantity] * Sales[Net Price] )

Total Cost :=
SUMX ( Sales, Sales[Quantity] * Sales[Unit Cost] )

Margin :=
[Sales Amount] - [Total Cost]

Margin % :=
DIVIDE ( [Margin], [Sales Amount] )
The single query generated by the matrix is the following one:
EVALUATE
TOPN (
    502,
    SUMMARIZECOLUMNS (
        ROLLUPADDISSUBTOTAL ( 'Customer'[Country],
        "IsGrandTotalRowTotal" ),
        "Sales_Amount", 'Sales'[Sales Amount],
        "Quantity__", 'Sales'[Quantity #],
        "Total_Cost", 'Sales'[Total Cost],
        "Margin__", 'Sales'[Margin %]
    ),
    [IsGrandTotalRowTotal], 0,
    [Sales_Amount], 0,
    'Customer'[Country], 1
)
ORDER BY
    [IsGrandTotalRowTotal] DESC,
    [Sales_Amount] DESC,
    'Customer'[Country]
The execution of that query in DAX Studio with a cold cache shows that the execution is fast and only requires one Storage Engine (SE) query.
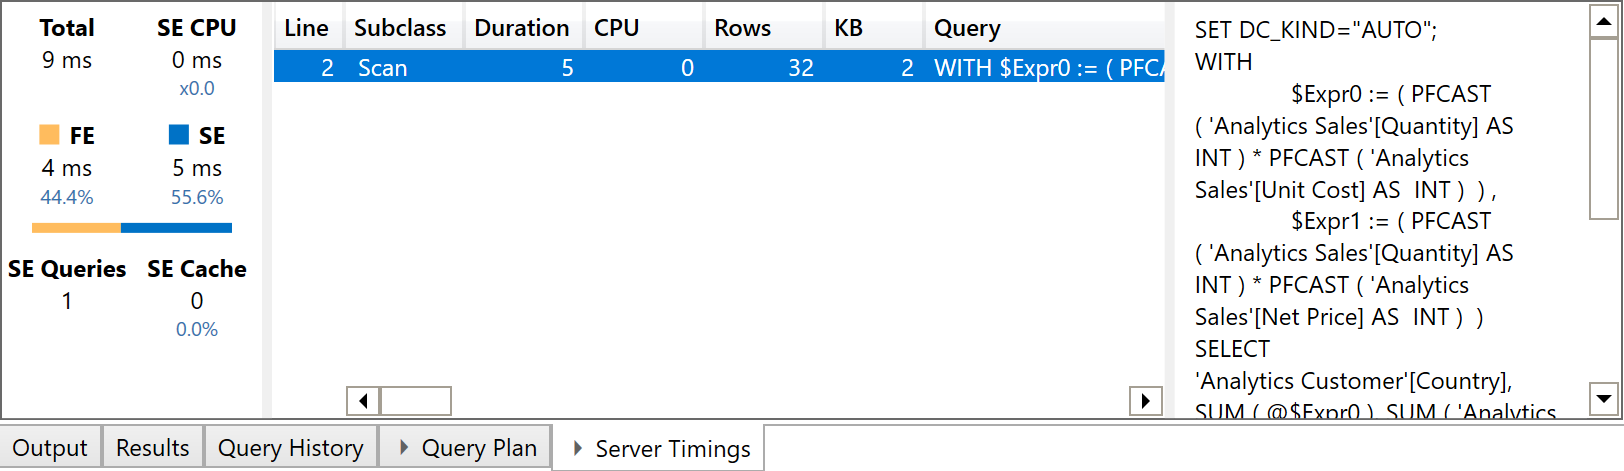
This is the performance expected of a report in Power BI, even though we are querying a model that has one million of rows in the Sales table. When we try to recreate the same report in Excel, we can see important differences in the way the query is executed. Typically, you publish the Power BI report and then you create an Excel report using the Analyze in Excel feature. However, this would make it impossible to investigate the query plans; we can thus simulate the same behavior by connecting Excel to Analysis Services using the diagnostic port provided by Power BI Desktop, which is shown by DAX Studio when it is connected to Power BI Desktop.
We create the following report using a PivotTable in Excel.
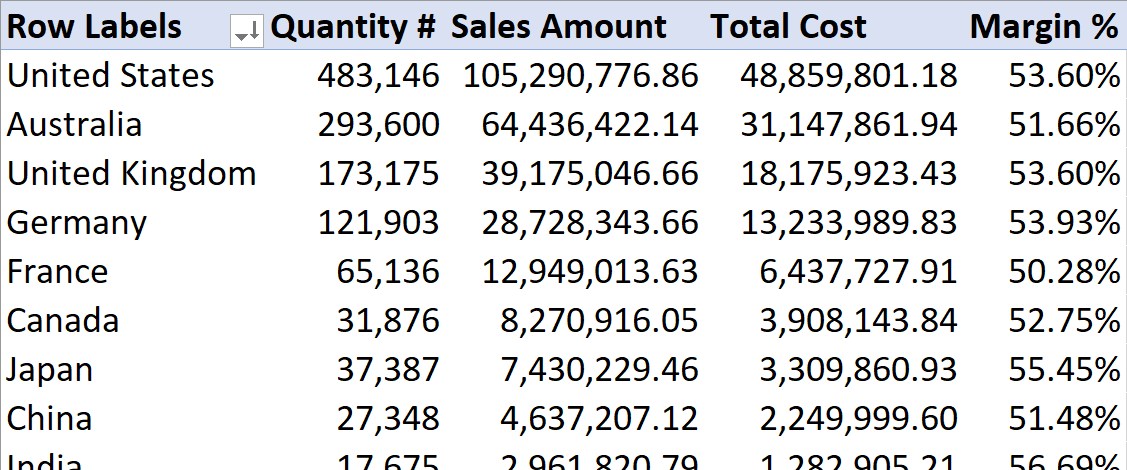
Excel generates a single MDX query to populate a PivotTable, no matter how complex. In this case, the MDX query is relatively simple – the sort order is not included in the query because Excel sorts the result it receives:
SELECT
    { [Measures].[Quantity #],
      [Measures].[Sales Amount],
      [Measures].[Total Cost],
      [Measures].[Margin %]
    }
DIMENSION PROPERTIES PARENT_UNIQUE_NAME,HIERARCHY_UNIQUE_NAME ON COLUMNS,
    NON EMPTY Hierarchize(
        { DrilldownLevel (
            { [Customer].[Country].[All] },,,
            INCLUDE_CALC_MEMBERS
          )
        }
    )
DIMENSION PROPERTIES PARENT_UNIQUE_NAME,HIERARCHY_UNIQUE_NAME ON ROWS
FROM [Model]
CELL PROPERTIES VALUE, FORMAT_STRING, LANGUAGE, BACK_COLOR, FORE_COLOR, FONT_FLAGS
UPDATE 2020-11-10: you can replicate the following issue only in SQL Server Analysis Services. Both Power BI and Azure Analysis Services now optimize the query plan as the DAX query does, using a single SE query.
The execution of this MDX query in DAX Studio with a cold cache shows that the execution is still fast, though slower than the previous DAX version. However, the most important difference is the increase in the number of SE queries – we now have 8 instead of 1.
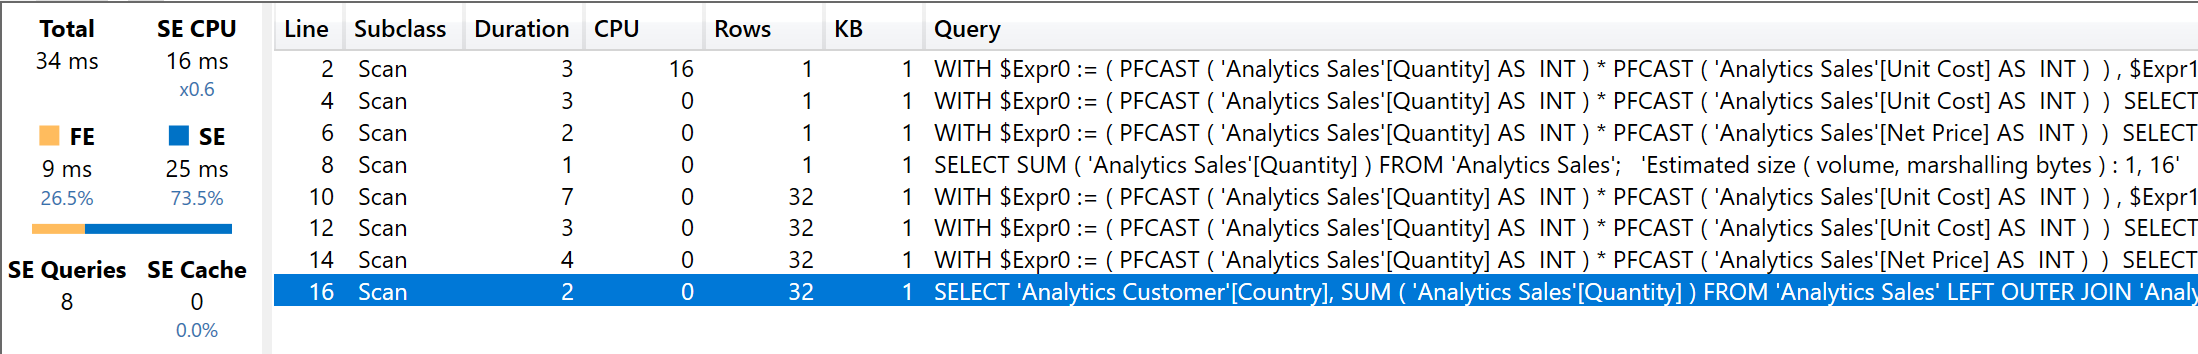
The reason why the MDX query requires a larger number of SE queries compared to the equivalent DAX query is that DAX benefits from one optimization called “fusion”; fusion includes multiple aggregations within the same storage engine query. The reports are identical and require the aggregations of the Quantity #, Sales Amount, and Total Cost measures. The following is the xmSQL code of the single SE query required by the DAX version:
WITH  $Expr0 := ( PFCAST ( 'Analytics Sales'[Quantity] AS  INT )
                  * PFCAST ( 'Analytics Sales'[Unit Cost] AS  INT )  ) ,
      $Expr1 := ( PFCAST ( 'Analytics Sales'[Quantity] AS  INT )
                  * PFCAST ( 'Analytics Sales'[Net Price] AS  INT )  )
SELECT
    'Analytics Customer'[Country],
    SUM ( @$Expr0 ),
    SUM ( 'Analytics Sales'[Quantity] ),
    SUM ( @$Expr1 )
FROM 'Analytics Sales'
    LEFT OUTER JOIN 'Analytics Customer'
    ON 'Analytics Sales'[CustomerKey]='Analytics Customer'[CustomerKey];
The query granularity is at the Country level, and the DAX engine computes the grand total by summing the value obtained for each country. Indeed, the measures used in the report display a purely additive behavior – they are just SUM / SUMX functions.
When the report runs in MDX, every measure requires its own SE query. This is the SE query generated for the Sales Amount measure:
WITH  $Expr0 := ( PFCAST ( 'Analytics Sales'[Quantity] AS  INT )
                  * PFCAST ( 'Analytics Sales'[Net Price] AS  INT )  )
SELECT
    SUM ( @$Expr0 )
FROM 'Analytics Sales';
This is the SE query generated for the Total Cost measure:
WITH  $Expr0 := ( PFCAST ( 'Analytics Sales'[Quantity] AS  INT )
                  * PFCAST ( 'Analytics Sales'[Unit Cost] AS  INT )  )
SELECT
    SUM ( @$Expr0 )
FROM 'Analytics Sales';
Although the Margin measure used by Margin % is just a difference between Sales Amount and Total Cost, there is a specific SE query to compute Margin:
WITH  $Expr0 := ( PFCAST ( 'Analytics Sales'[Quantity] AS  INT )
                  * PFCAST ( 'Analytics Sales'[Unit Cost] AS  INT )  ) ,
      $Expr1 := ( PFCAST ( 'Analytics Sales'[Quantity] AS  INT )
                  * PFCAST ( 'Analytics Sales'[Net Price] AS  INT )  )
SELECT
    SUM ( @$Expr0 ),
    SUM ( @$Expr1 )
FROM 'Analytics Sales';
Moreover, the SE queries are also duplicated because each SE query runs both at the Country granularity level and at the grand total level. For this reason, the queries in lines 10 to 16 of the last screenshot look like duplicated versions of the queries in lines 2 to 8. The difference is visible in the screenshot comparing line 8 with line 16: the former just sums Quantity grouped by Country.
The impact of the missing “fusion” optimization is not clearly visible in terms of perceived execution time when:
- The measures are trivial.
- There are only a few million rows in the fact table in the model.
- The report does not require more than a few dozen cells in the result.
When one or more of these conditions is no longer true, the difference in performance is much greater.
Consider for example this different, slower version of the measures, where Slow Amount applies a 5% discount on transactions with a Net Price greater than 100; The code is intentionally inefficient in order to highlight the problem caused by the absence of fusion in MDX queries:
Quantity # :=
SUM ( Sales[Quantity] )

Slow Amount :=
SUMX (
    Sales,
    Sales[Quantity] * IF (
        Sales[Net Price] > 100,
        Sales[Net Price] * 0.95,
        Sales[Net Price]
    )
)

Total Cost :=
SUMX ( Sales, Sales[Quantity] * Sales[Unit Cost] )

Slow Margin :=
[Slow Amount] - [Total Cost]

Slow Margin % :=
DIVIDE ( [Slow Margin], [Slow Amount] )
The layout of the reports and the structure of the DAX and MDX queries is the same we have seen before, but simply replacing the measures with their slower version. However, the query plans are different. The DAX request now generates two SE queries, because the measures are no longer guaranteed to be fully aggregatable. Therefore, there is one SE query at the Country granularity and another one for the grand total, even though each SE query still computes all the measures because of the fusion optimization. The two SE queries of the DAX measures are visible in the next screenshot.
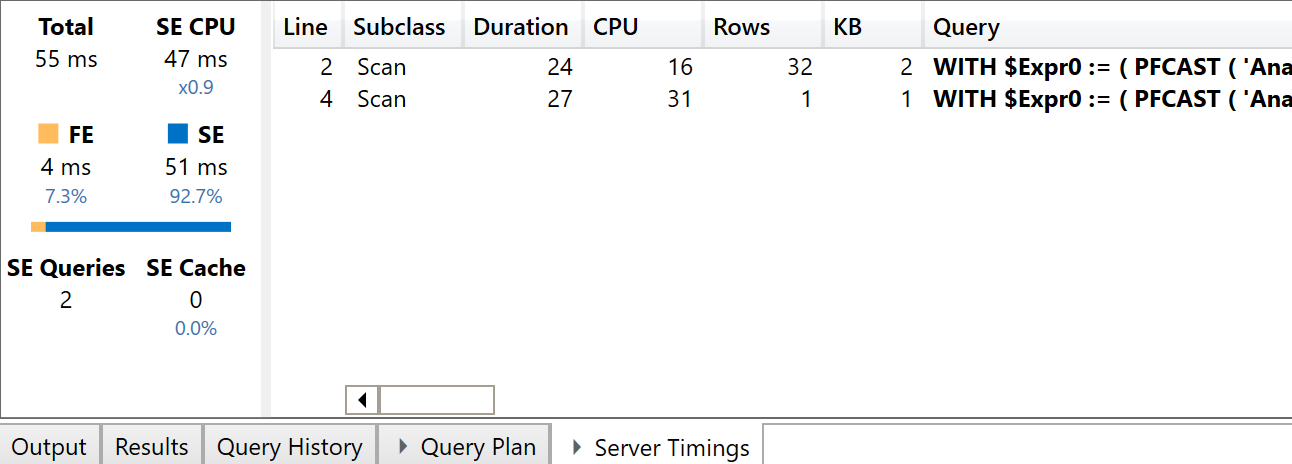
The presence of the IF condition in the iterator generates a CallbackDataID that does not cache the result of the SE query. While this is of limited importance for the DAX query executed by a single user, it has a bigger impact on the MDX version of the query. This is shown in the next screenshot.
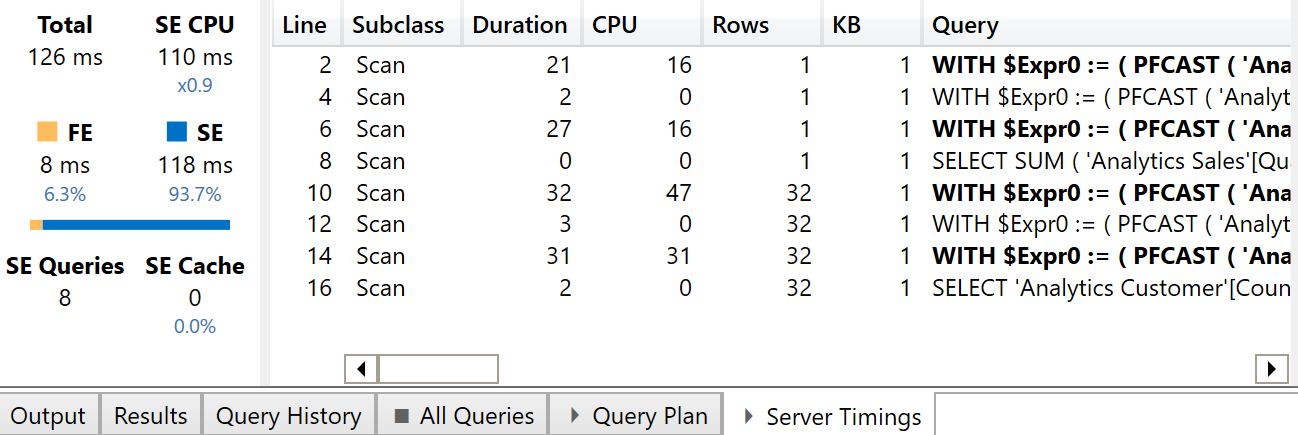
All the SE queries in bold include a CallbackDataID and do not take advantage of the SE cache. In this simple example, the MDX version of the report is two times slower than the DAX version (126 ms instead of 55 ms), but the effect produced by the increased number of SE queries could be bigger in more complex reports.
Possible optimizations
In order to improve the performance of an Excel report based on a PivotTable, consider the following best practices:
- Only in SQL Server Analysis Services: Reducing the number of measures included in a PivotTable. (No longer required in Power BI and Azure Analysis Services since October 2020).
- Optimizing the performance of the measures used in a PivotTable.
- Avoiding any CallbackDataID especially in measures that are referenced multiple times in the same report.
Call to action
A better solution would be an MDX implementation of the “fusion” optimization available for DAX queries. Please vote for this suggestion on idea.powerbi.com if you think this optimization is important in your scenarios, and in order to make Microsoft aware of this requirement; please ensure to also involve your account in Microsoft if you work in a larger corporation.
Thanks for supporting the idea that Microsoft implemented in Power BI and Analysis Services in October 2020. If you still suffer from the issue described in this article, please check whether you are using an updated version of Power BI Desktop.
Adds all the numbers in a column.
SUM ( <ColumnName> )
Returns the sum of an expression evaluated for each row in a table.
SUMX ( <Table>, <Expression> )
Checks whether a condition is met, and returns one value if TRUE, and another value if FALSE.
IF ( <LogicalTest>, <ResultIfTrue> [, <ResultIfFalse>] )