 Marco Russo
In a report-based tool, the user connects several data sources, imports data and applies transformations to it to get a “simple” table. This table enables the user to perform the comparison of different metrics within the same report. The goal of the transformations is to adapt data granularity making the comparison possible in the report.
- Pro: simple to use, calculations are scoped to a single report only.
- Cons: two reports based on the same data sources duplicate the same transformations. Formulas and transformations are shared across reports using “copy & paste” techniques.
In a model-based tool, the user connects to or imports from external data sources, and the tool defines a “semantic layer” like a classic Corporate BI tool. On top of this semantic layer, the same user can create one or more reports.
- Pro: once defined, the same model can be used for different reports.
- Cons: a good model that works with many different reports requires more authoring time. The presence of a model introduces more complexity for managing relationships and formulas.
Power BI is a model-based tool. It uses a proprietary language (DAX) to define the business logic of the measures in the semantic layer, and it allows querying of the data model using two languages: DAX and MDX – the latter being an industry standard.
The reason why DAX and MDX are used over a more common SQL is because SQL would not work well for a semantic layer. In the long story of Corporate BI tools, even if a tool generates SQL queries it is not possible to define generic business rules in SQL, except for very simple calculations at the row level of the source data.
For example, consider a Margin % calculation derived from two tables: Sales and Purchases. Defining a generic calculation in SQL that divides the result of two aggregations is a complex task.
Every tool has invented their own way of achieving this. Indeed, expressing this calculation in SQL requires a very specific query and cannot be generic enough to be used with any filter, any aggregation, or any combination of other measures in the same query.
The data model in Power BI is like a relational database. Even though it can have any number of tables and relationships, it provides the best results using a semi-denormalized approach: one entity, one table, derived from Ralph Kimball’s conformed dimensional modeling. The freedom in data modeling opens the door to possible mistakes and inefficiencies especially when creating complex structures. Nevertheless, complex structures can be created this way.
The following picture shows a Power BI data model with Purchases and Sales sharing common dimensions such as Product and Date.
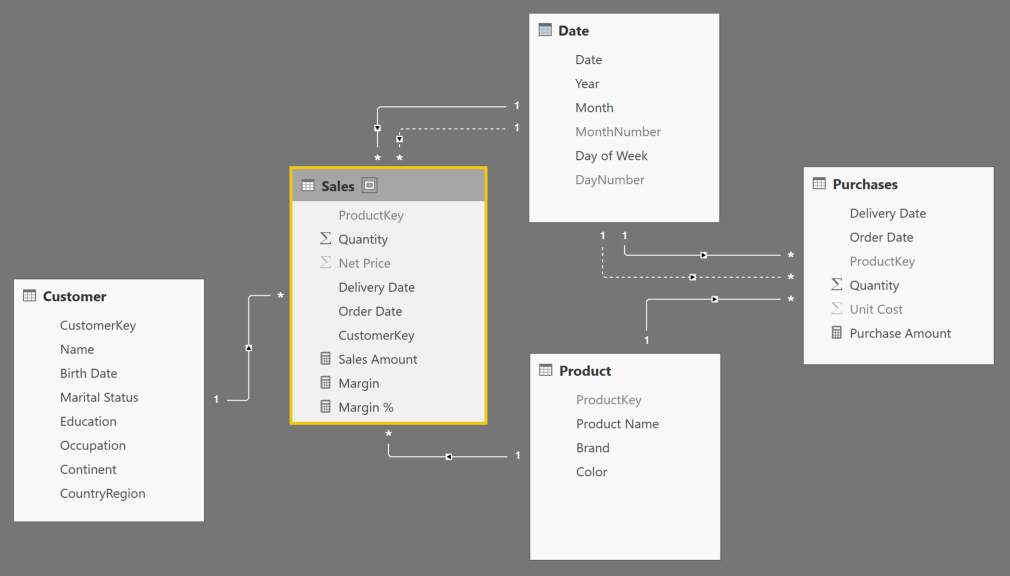
Many tools would not be able to handle such a simple data model, and we have seen many data models that are way more complex than that.
A report-based tool assumes that the input is made by a single table, or something that can be transformed into a single table. In a report-based tool, the previous data model must be transformed into a single table or at least into a single star schema. The following picture shows a single fact table with both Sales and Purchases transactions in the same table, grouped by Order Date and ProductKey.
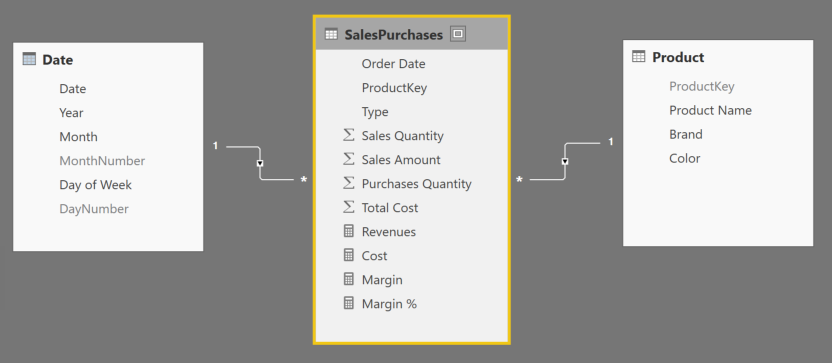
This way, it is still possible to calculate the Margin % by Product and Order Date, but users lose the ability to analyze sales by customer. Moreover, neither sales nor purchases can be analyzed by delivery date, because the SalesPurchases table was built using an SQL query such as:
SELECT
    "Sales" AS Type,
    [Order Date],
    ProductKey,
    SUM ( Quantity ) AS [Sales Quantity],
    SUM ( Quantity * [Net Price] ) AS [Sales Amount],
    NULL AS [Purchases Quantity],
    NULL AS [Total Cost]
FROM Sales
GROUP BY [Order Date], ProductKey
UNION ALL
SELECT
    "Purchases" AS Type,
    [Order Date],
    ProductKey,
    NULL AS [Sales Quantity],
    NULL AS [Sales Amount],
    SUM ( Quantity ) AS [Purchases Quantity],
    SUM ( Quantity * [Unit Cost] ) AS [Total Cost]
FROM Sales
GROUP BY [Order Date], ProductKey
A report-based tool requires specific data transformation for every report. This provides more control, but it is more time-consuming. It also requires a certain level of knowledge to do the job such as knowledge of the SQL language or of a data transformation tool. A model-based tool requires the developer to be competent in structuring their data model, and to be proficient in a language that can express the business logic for the calculation in order to design the model – an example would be DAX in Power BI. However, with a model-based tool a user without that knowledge can create different reports analyzing different attributes and comparing measures that do not belong to the same table… Something that is not possible with a report-based tool.
For these reasons, it would be fair to only compare Power BI with other model-based tools when considering the entire stack of a solution. Otherwise, the comparison will be limited to the data visualization capabilities of the product, which is only the final step in the analytical process.