 Marco Russo
When a Power BI dataset imports data from a data source that is continuously updated, it introduces a latency caused by the refresh schedule. If the dataset refresh runs every hour, the latency introduced can be up to one hour.
While latency is acceptable in most reports, there could be specific dashboards or visualizations requiring a latency close to zero. This requirement usually impacts the development time – thus increasing the cost – and the query performance – slowing down the response time of every report.
Power BI offers several options to manage real-time report updates:
- DirectQuery: The tables using DirectQuery generate SQL statements sent to the relational data source every time a DAX query is executed. If the dataset does not use aggregation tables, the result has zero latency. As a drawback, the query performance is usually slower compared to the Import mode.
- Hybrid models: Most tables use Import mode; a few DirectQuery tables retrieve current data. The query performance is faster than a pure DirectQuery solution, though special measures combine data aggregation in memory with the result obtained by DirectQuery tables. Frequent access to DirectQuery tables might impact the scalability of the data source and can result in a slightly slower performance than Import mode. Moreover, not all types of calculations can be split over different tables, like DISTINCTCOUNT.
- Push datasets: The tables are imported into the dataset, and new rows are incrementally added to the tables. This solution has no impact on the data source database performance because there are no additional SQL queries sent to the data source. However, you cannot create push datasets using Power BI Desktop. You can only create reports connected to published datasets. Push datasets require specific APIs to create the model and update the tables. Push datasets have limitations in the features supported.
The requirement for real time affects only a few reports in most business scenarios. Push datasets are an interesting option to avoid the scalability and performance issues of a DirectQuery solution, but the development cost has always been a disadvantage. The PbiPushTools command-line tool and the Sqlbi.PbiPushTools PowerShell cmdlet drastically lower a solution’s development cost based on Power BI push datasets by leveraging the open-source Sqlbi.PbiPushDataset library.
The idea is to extend a standard “import” dataset by using a push dataset that inherits the existing structures and measures. However, the push dataset is populated and updated only for the relevant parts of the reports that require real-time. The goal is to minimize the development cost to obtain a solution where the reports are always up-to-date, and a dashboard can have frequent unattended updates like in the following example.
Introducing real-time dashboards with push datasets
The Creating real-time dashboards in Power BI with push datasets article and the following video introduce the concept of a solution based on a push dataset derived from a regular import model. The following part of this article describes in detail the architecture and provides a step-by-step guide to implement a solution. The example provided can be reproduced in your Power BI tenant by downloading the sample files at the end of the article.
Architecture
A Power BI dataset usually imports data from a relational database updated by an application or an ETL batch. The following figure depicts the flow of information.
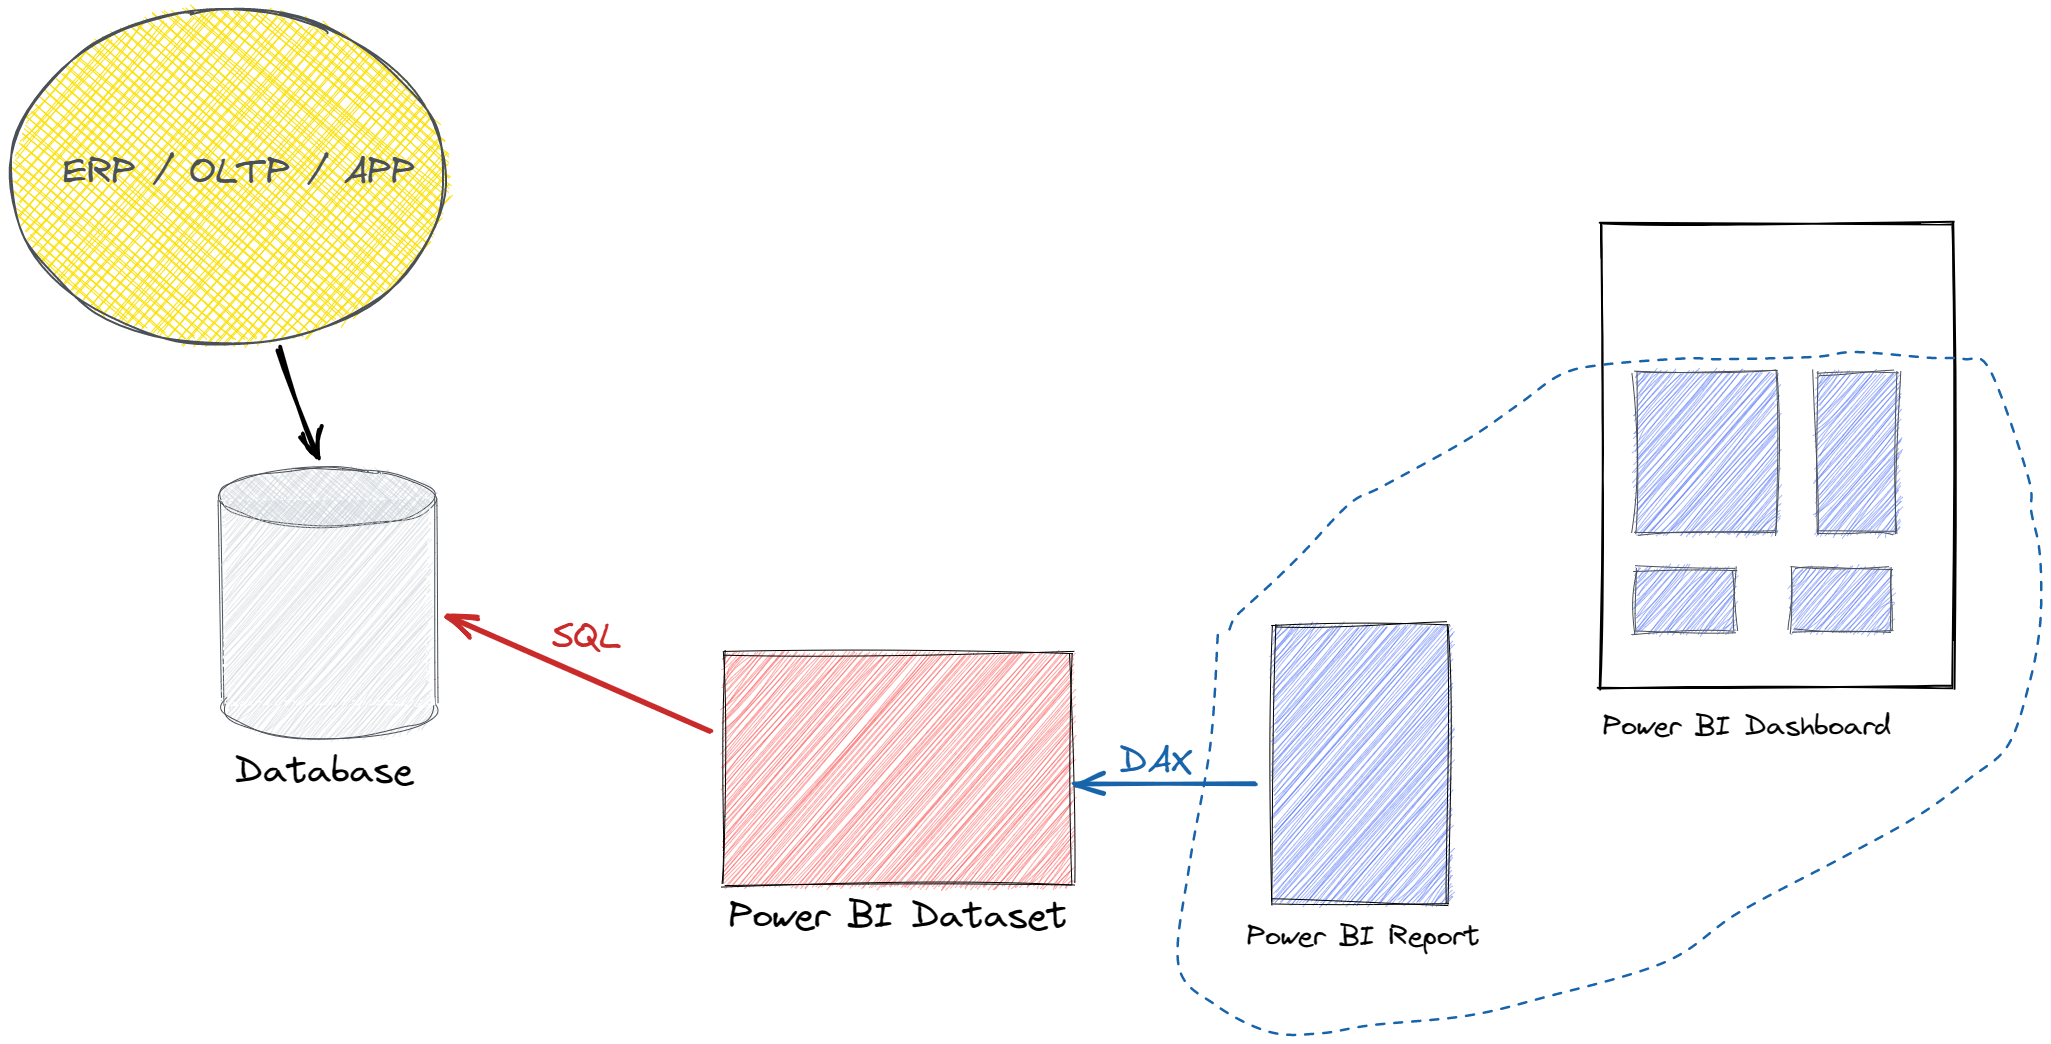
When there is a refresh request, the dataset sends SQL queries to the database and retrieves the data to populate the tables in the model. Power BI sends DAX queries to the dataset to update visuals in reports, which can be used as tiles in a Power BI dashboard. The dashboard tiles in Power BI are automatically updated when there is a dataset refresh.
The idea of Power BI Push Tools is to add to the previous architecture a new push dataset to serve real-time queries. The model used in the Power BI push dataset is a copy of the model used in the regular dataset. The Power BI Push tools perform this model duplication, in turn keeping only features supported in the push dataset and removing unsupported entities.
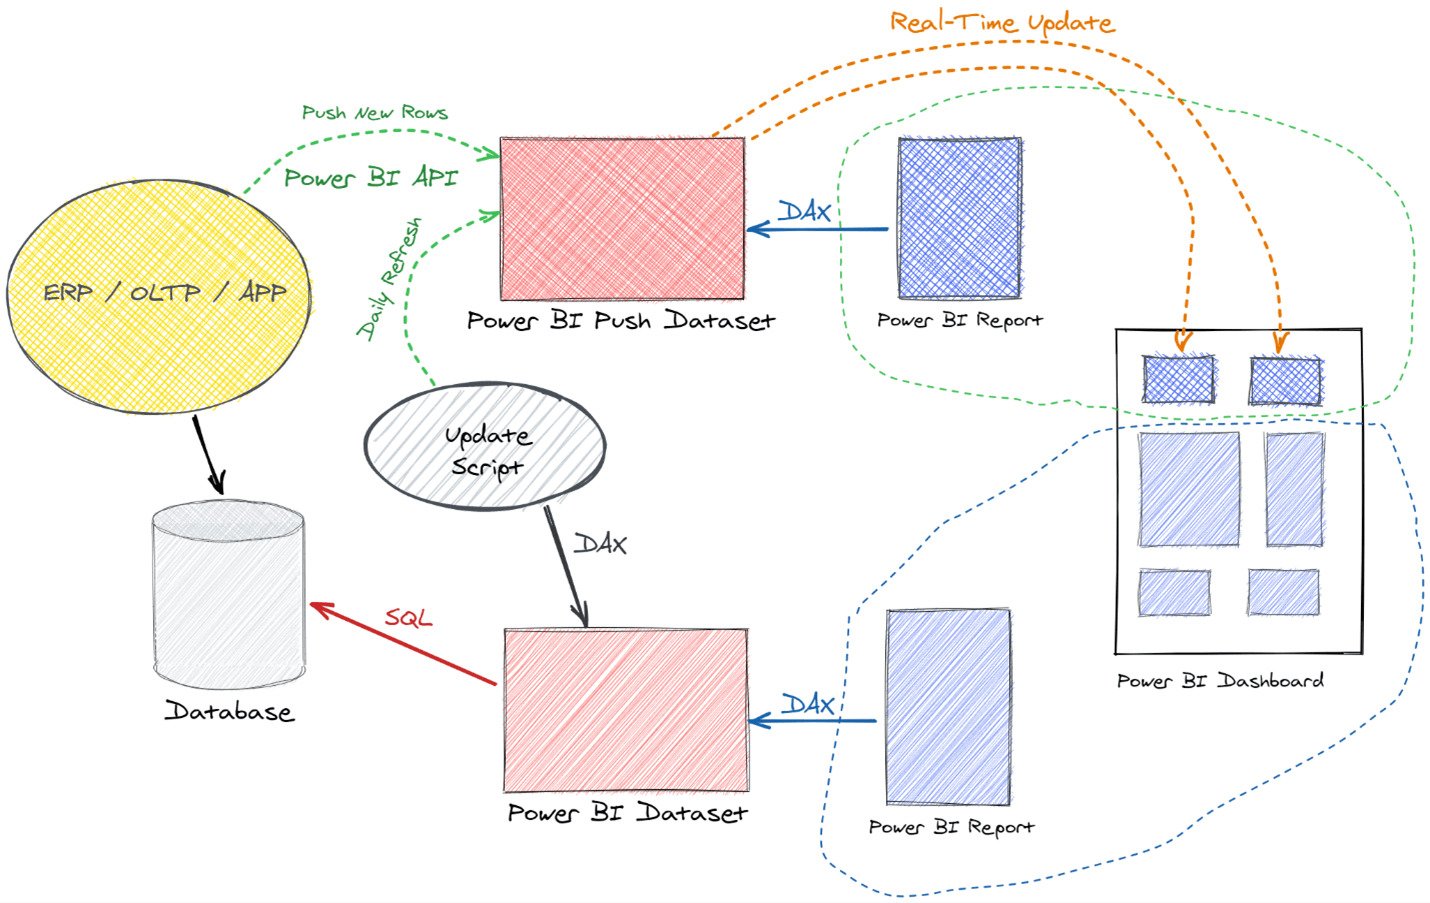
The result is an empty model that must be populated using two different techniques:
- First, the tables of the real-time dataset are emptied and populated using the original dataset. This first step is a periodic refresh during which the engine executes DAX queries on the original dataset. For example, the periodic refresh can be executed daily, just after the regular refresh of the imported dataset. The Update Script can invoke the command-line tool or the PowerShell cmdlet to execute a DAX script with the queries required to populate the corresponding tables in the push dataset.
- After the periodic refresh, using a near-real-time update, the application that detects new daily transactions sends new rows to the push dataset by using the Power BI REST API.
The result is that the Power BI push dataset is initialized every day with the data in the original dataset and then updated in real-time during the day.
The real-time Power BI report sends DAX queries to the push dataset to update the visuals, which as we said can be used as tiles in a Power BI dashboard. The dashboard tiles in Power BI are updated whenever the dataset receives near-real-time updates.
The Push dataset may be a copy of the original dataset, but due to limitations in the push dataset architecture of Power BI it might be necessary to reduce the number of rows in larger tables. Therefore, it is likely that the push dataset ends up being a modified version of the original dataset – though with reduced granularity or filtering conditions to allow the creation and update of the dataset itself.
Moreover, there are modeling and DAX features that are not supported by push datasets. We might have to modify the push dataset to accommodate these limitations. The Power BI Push Tools can streamline the work required to implement these changes.
The push dataset limitations are:
- Max rows per table depending on the retention policy, which defines which rows to keep in memory:
- No retention policy: max 5,000,000 rows per table;
once the limit is reached, the table is full and new rows are ignored.- FIFO retention policy: max 200,000 rows per table;
once the limit is reached, older rows are removed to store the new ones (FIFO = first-in first-out).- Max 75 columns per table;
- Max 75 tables per push dataset;
- Max 10,000 rows per single POST rows call;
- Max 1,000,000 rows added per hour per dataset;
- Max 5 pending POST rows requests per dataset;
- Max POST rows requests depending on table size:
- Less than 250,000 rows in the table: up to 120 POST rows requests per minute
- More than 250,000 rows in the table: up to 120 POST rows requests per hour
- 4,000 characters per value for string column in POST rows request;
- Data model restrictions:
- Inactive relationships are not supported
- Measures using USERELATIONSHIP are not supported
- Measures referencing invalid/non existing measures are not supported
- Hierarchies are not supported
- Mark as Date table is not supported.
Implementing a Power BI push dataset solution
We create a push dataset based on a regular import dataset in Power BI in this thorough walkthrough.
The initial Contoso.pbix file is a Power BI model with 10 million rows in the Sales table. The Sales table is related to Customer, Date, Product, and Store. The Currency Exchange table manages currency conversions. The following picture shows the VertiPaq Analyzer metrics of the dataset tables obtained with DAX Studio.
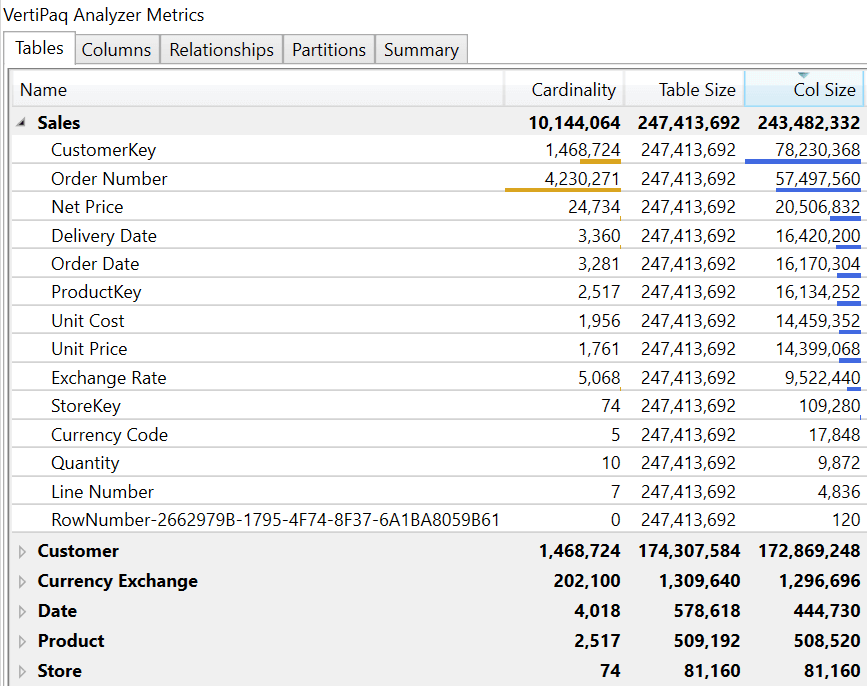
We can create a push dataset with the same structure, but the POST Rows limitations in the Power BI REST API force us to define a different granularity for the push dataset. We must reduce the size of the Sales table and reduce or ignore the content of the Customer table because populating these tables would exceed the limit of rows per table (5 million rows) or the limit of rows added per hour (1 million rows).
In this example, the business priority for the real-time dashboard is to compare data with historical sales at the store level. Therefore, we populate the initial version of the Sales table by grouping data by Order Date and StoreKey. The maximum number of combinations would be 242,794 (3,281 values in Order Date multiplied by 74 values in StoreKey), but the actual number of existing combinations is 162,487. We could reduce this number by 70-80% if we only needed data over the previous 2 or 3 years. This evaluation is crucial to decide how to populate the tables, but we do not have to remove tables from the model. It is enough to avoid populating unused tables – unless the number of tables exceeds the maximum number of tables in a push dataset (75). Thus, we can keep the same data model and just adapt the initial daily refresh of the push dataset.
Installing the Power BI Push tools
There are two versions of the Power BI Push tools. The PowerShell cmdlet version is compatible with PowerShell 7, and you can install it with the following PowerShell commands:
PowerShell version
Set-PSRepository -Name PSGallery -Installationpolicy trusted
Install-Module -Force -Name Sqlbi.PbiPushTools
You can also use the command-line version that does not require PowerShell. Just download the PbiPushTools ZIP file, expand the content in a folder included in the path, and execute the command line version PbiPushTools.exe.
In the following screenshots, we use the PowerShell version of the tool. However, we always include the syntax of the corresponding command-line version in each example.
Validating the model
Open the Tabular Editor external tool from Power BI Desktop and save the model as a file named Contoso.bim. This file contains the Tabular Object Model (TOM) structure that describes the entire dataset, including tables, columns, relationships, and measures. Because the push dataset does not support all the features available in a regular Tabular model, we should validate the model to verify invalid objects. We can use either the PowerShell or the command-line tool:
PowerShell version
Confirm-PushDataset -Model 'C:\Demo\Contoso.bim'

Command-line version
PbiPushTools.exe check -m "C:\Demo\Contoso.bim"
The result provided by the tool displays two issues.
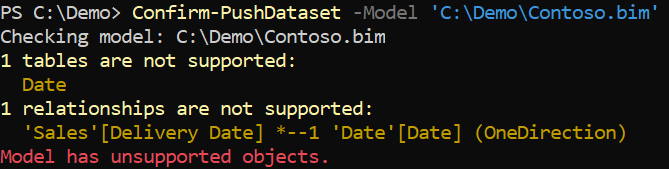
The Date table is not supported because push datasets cannot have a table named Date. As a workaround, we can rename the table Date to Dates. By doing the rename in Power BI Desktop, we make sure that all the references to Date are also renamed to Dates. You can of course use other names if you prefer, such as Calendar for example.
Once we complete the rename, we export the Contoso.bim file using Tabular Editor and rerun the validation.
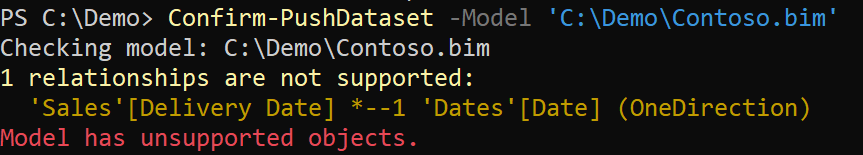
The relationship between Sales[Delivery Date] and Dates[Date] is invalid because inactive relationships are not supported. We could ignore this issue because the tool publishes only the valid objects. However, you can also remove the inactive relationships in Tabular Editor, save the Contoso.bim file, and rerun the validation.
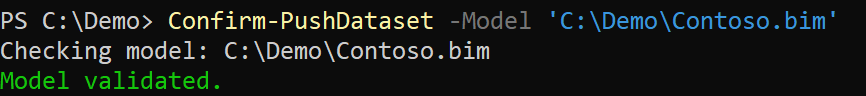
We can now use the Contoso.bim file to create a corresponding push dataset in Power BI.
Collecting credentials and configuration
Before using the Power BI REST API for push datasets, you should set the following variables as strings in PowerShell. Using the command-line version, you should store the information in environment variables using %VARIABLE% instead of $Variable. Make sure you have this information available before moving forward with your model. You can continue to read the article if you want to understand which operations use each variable:
- $Principal – The service principal for the Power BI REST API authentication. Usually, the tool runs in a scheduled unattended batch. The service principal is a string with a global unique identifier (GUID). Usually, you use the Application ID you see in the Azure configuration page for your application. For more details about the service principal, read Creating a service principal account for Power BI API.
- $Secret – The client secret for the service principal. For more details about the client secret, read Creating a service principal account for Power BI API.
- $Tenant – The Tenant ID of Azure Active Directory. It appears as “Directory (tenant) ID” in the Azure configuration. See How to find your tenant ID – Azure Active Directory.
- $Group – The Group ID corresponding to the Power BI workspace where you publish the push dataset (the tool does not support the publishing on My Workspace). The easiest way to retrieve this information is in the URL you can see when you browse the content of a workspace: the Group ID is the sequence of letters and numbers that appears just after “groups”. In the following URL, it is the string between “groups” and “list”:
https://app.powerbi.com/groups/53abcdef-3cb5-4ce3-bb3b-110a5f2f54fd/list - $Client – The Client ID of the application registered in Azure Active Directory that calls the REST API to update the push dataset. You can see how to register an application and obtain a Client ID in Creating a service principal account for Power BI API.
- $Username – The username to retrieve data from the regular dataset to initialize the push dataset after the daily refresh.
- $Password – The password to retrieve data from the regular dataset to initialize the push dataset after the daily refresh.
You can create a PowerShell script with the following initialization. We reference these variables in the examples that follow later on:
PowerShell version
$Principal="xxxxxxxx-xxxx-xxxx-xxxx-xxxxxxxxxxxx"
$Secret="xxxxxxxxxxxxxxxxxxxxxxxxxxxxxxxxxx"
$Tenant="xxxxxxxx-xxxx-xxxx-xxxx-xxxxxxxxxxxx"
$Group="xxxxxxxx-xxxx-xxxx-xxxx-xxxxxxxxxxxx"
$Client="xxxxxxxx-xxxx-xxxx-xxxx-xxxxxxxxxxxx"
$Username="xxxxxxxx@yyyyyyy.zzz"
$Password="xxxxxxxx"
Once the application is registered in Active Directory, you can add the application to the workspace. In order to do that, click Access on the workspace content list page and assign Member permission to the app name as it was a user.
Creating the push dataset
The publish command of the tool creates a Power BI push dataset with the tables, columns, and relationships of the Tabular model provided in the .bim file. The following command creates a ContosoRT dataset using the Contoso.bim file we created in the previous step:
PowerShell version
Publish-PushDataset -Model "Contoso.bim" -Principal $Principal -Secret $Secret
                    -Tenant $Tenant -Group $Group -DatasetName ContosoRT

Command-line version
PbiPushTools.exe publish -m "Contoso.bim" -p %PRINCIPAL% -s %SECRET% -t %TENANT%
                         -g %GROUP% -dn Contoso
If the operation is successful, you can see the Dataset ID assigned to the new push dataset:

The push dataset cannot be opened through an XMLA endpoint. However, if you connect to the push dataset using Power BI or Excel, you can see the original model’s tables, columns, and measures. Initially, all the tables are empty, and there are no data sources defined in a push dataset. Your application – or the tool we are using – is responsible for writing rows in all model tables.
Populating the push dataset
We decided to populate the push dataset model with a granularity of date and store. To initialize the dataset with historical data, we can retrieve the data at that granularity from the Contoso dataset by using custom DAX queries. The tool we use can execute one or more DAX queries over the specified connection and write the query’s result in a corresponding table. It uses the column names to identify the target table and columns. For this reason, each column must be fully qualified.
The tool processes a single script with multiple queries. In this section we comment one query at a time, but a single file named PopulateContoso.dax is available with the complete script. Because we group historical sales by date and store, we only need to populate three tables: Store, Date, and Sales.
The Store table requires a straightforward DAX query that copies all the columns and all the rows of the original table:
EVALUATE Store
Because we renamed the original Date table to Dates, if we keep the Date name in the original dataset, we must map the Date table name to Dates. Indeed, there might be other reports out there already published. This mapping requires a more verbose DAX syntax which must include all the columns. The preliminary version of the tool has an automatic renaming from Date to Dates, but we prefer to show the verbose approach for educational purposes; there may be other cases where a similar technique can be necessary. If you omit columns in the query, for the columns that were skipped you will find a blank value in the destination push dataset. The order of the columns in the query is not relevant. The order of the rows reflects the order used to insert data in the push dataset, but it should not affect performance – we can omit the ORDER BY condition as we did for the Store table:
EVALUATE
SELECTCOLUMNS(
    'Date',
    "Dates[Date]", 'Date'[Date],
    "Dates[Day of Week Number]", 'Date'[Day of Week Number],
    "Dates[Day of Week]", 'Date'[Day of Week],
    "Dates[Day of Week Short]", 'Date'[Day of Week Short],
    "Dates[End of Month]", 'Date'[End of Month],
    "Dates[Month Number]", 'Date'[Month Number],
    "Dates[Month]", 'Date'[Month],
    "Dates[Month Short]", 'Date'[Month Short],
    "Dates[Quarter]", 'Date'[Quarter],
    "Dates[Working Day]", 'Date'[Working Day],
    "Dates[Working Day Number]", 'Date'[Working Day Number],
    "Dates[Year]", 'Date'[Year],
    "Dates[Year Month Number]", 'Date'[Year Month Number],
    "Dates[Year Month]", 'Date'[Year Month],
    "Dates[Year Month Short]", 'Date'[Year Month Short],
    "Dates[Year Quarter Number]", 'Date'[Year Quarter Number],
    "Dates[Year Quarter]", 'Date'[Year Quarter]
)
ORDER BY
    Dates[Date] ASC
The Sales table should have a smaller number of rows, which impacts the columns containing metrics that can be aggregated. We can aggregate the Sales[Quantity] column by SUM, but we cannot manage the Net Price, Unit Cost, and Unit Price columns the same way. Because we do not want to change the measures and the model in general, we must write in each grouped row a price that is consistent with the new quantity value – so that the total obtained by multiplying the price by quantity at the day level is the same. Writing the correct value for the price columns is the most critical part of the script. An error in these formulas can produce inaccurate numbers in the push dataset when querying historical data.
It is also worth noting that we are modifying the semantics of the columns by changing the very values of the columns. If a measure computed the average net price, it would stop working and start producing inaccurate results:
EVALUATE
SUMMARIZECOLUMNS (
    Sales[Order Date],
    Sales[StoreKey],
    "Sales[Quantity]", SUM ( Sales[Quantity] ),
    "Sales[Net Price]",
        DIVIDE (
            SUMX ( Sales, Sales[Quantity] * Sales[Net Price] ),
            SUM ( Sales[Quantity] )
        ),
    "Sales[Unit Cost]",
        DIVIDE (
            SUMX ( Sales, Sales[Quantity] * Sales[Unit Cost] ),
            SUM ( Sales[Quantity] )
        ),
    "Sales[Unit Price]",
        DIVIDE (
            SUMX ( Sales, Sales[Quantity] * Sales[Unit Price] ),
            SUM ( Sales[Quantity] )
        )
)
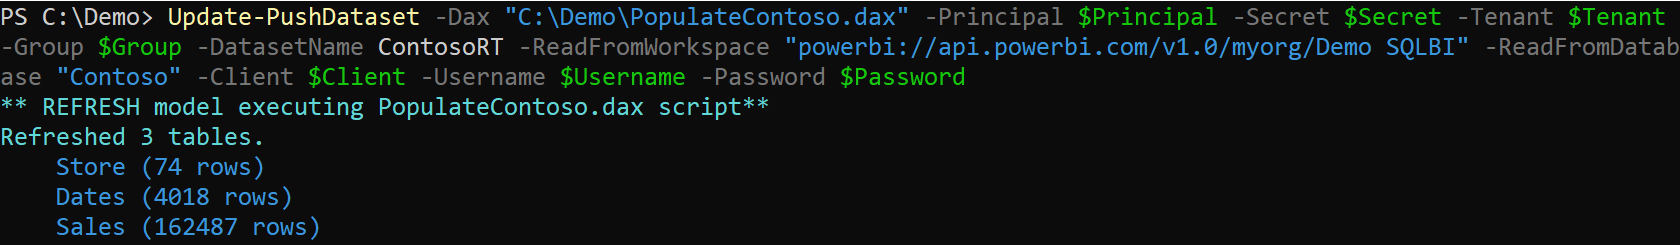
You should prepare and test these queries using DAX Studio, making sure that the results are consistent. We included the three queries in a single PopulateContoso.dax file that we reference in the updated instructions of the tool. We published the original Contoso dataset on the Demo SQLBI workspace in the following example:
PowerShell version
Update-PushDataset -Dax "PopulateContoso.dax" -Principal $Principal -Secret $Secret
                   -Tenant $Tenant -Group $Group -DatasetName ContosoRT
                   -ReadFromWorkspace "powerbi://api.powerbi.com/v1.0/myorg/Demo SQLBI"
                   -ReadFromDatabase "Contoso"
                   -Client $Client -Username $Username -Password $Password

Command-line version
PbiPushTools.exe refresh -m "PopulateContoso.dax" -p %PRINCIPAL% -s %SECRET%
                         -t %TENANT% -g %GROUP% -dn Contoso
                         -rw "powerbi://api.powerbi.com/v1.0/myorg/Demo SQLBI"
                         -rd "Contoso" -x "PopulateContoso.dax"
                         -ua %CLIENT% -un %USERNAME% -up %PASSWORD%
The operation clears all the tables in the push dataset and displays the number of rows written in each table:
Creating Power BI report and dashboard
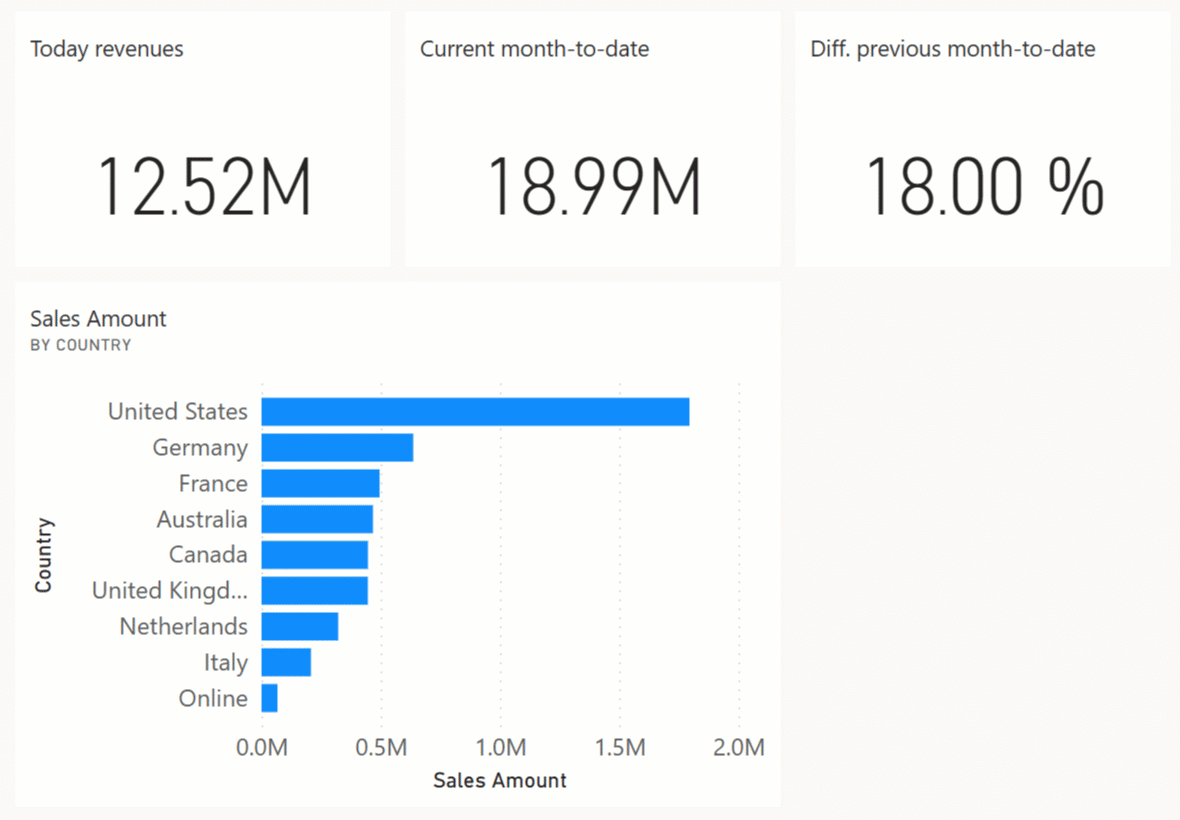
Create a new Power BI report connected to the ContosoRT push dataset we published and populated in the previous steps. You can use either Power BI Desktop or the powerbi.com website. The “ContosoRT Day.pbix” file contains the two report pages described in this section: you can also open the file and change the data source pointing to the ContosoRT dataset you published on your Power BI tenant.
On the first page, we create a matrix with a hierarchy of dates on the rows (Year, Month, and Date) and the Sales Amount measure in the Values section. In the example we used, we have data until 3/3/2020.
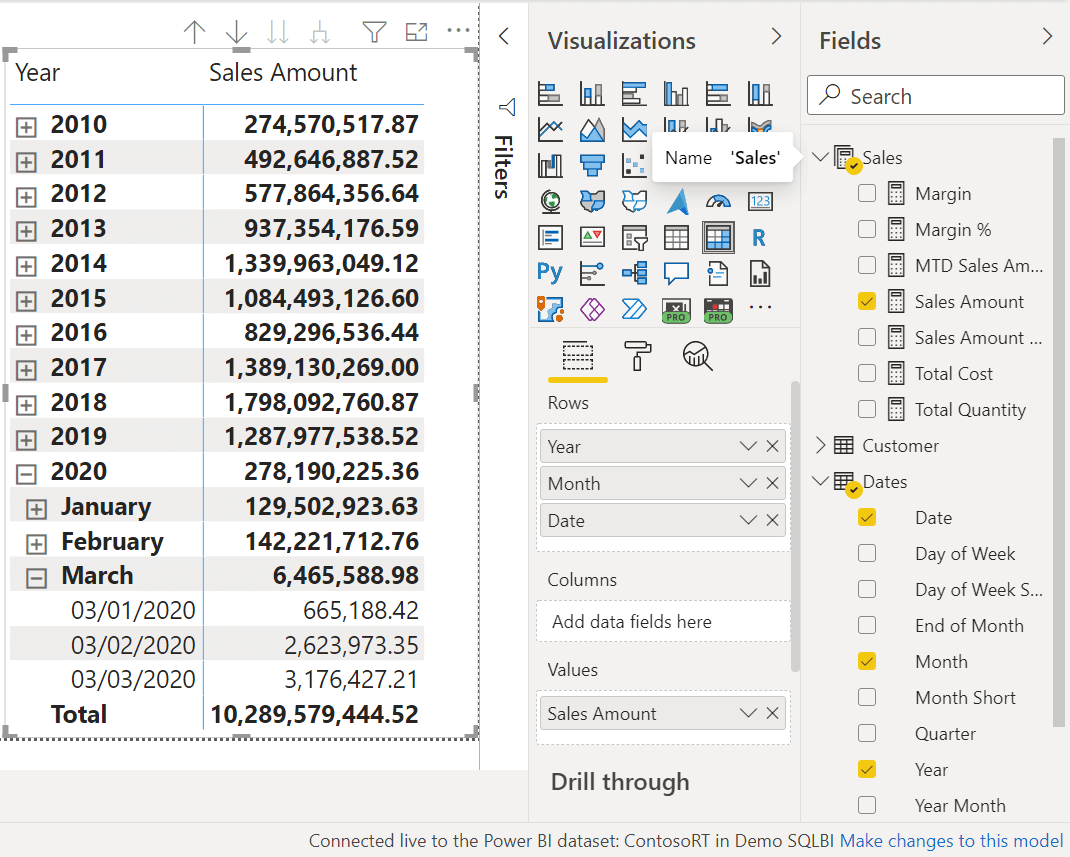
The Sales Amount measure was in the original Contoso model, including user hierarchies to navigate dates. However, push datasets do not support user hierarchies. The conversion tool did not show any warning because user hierarchies are ignored in the conversion process as they cannot break existing calculations.
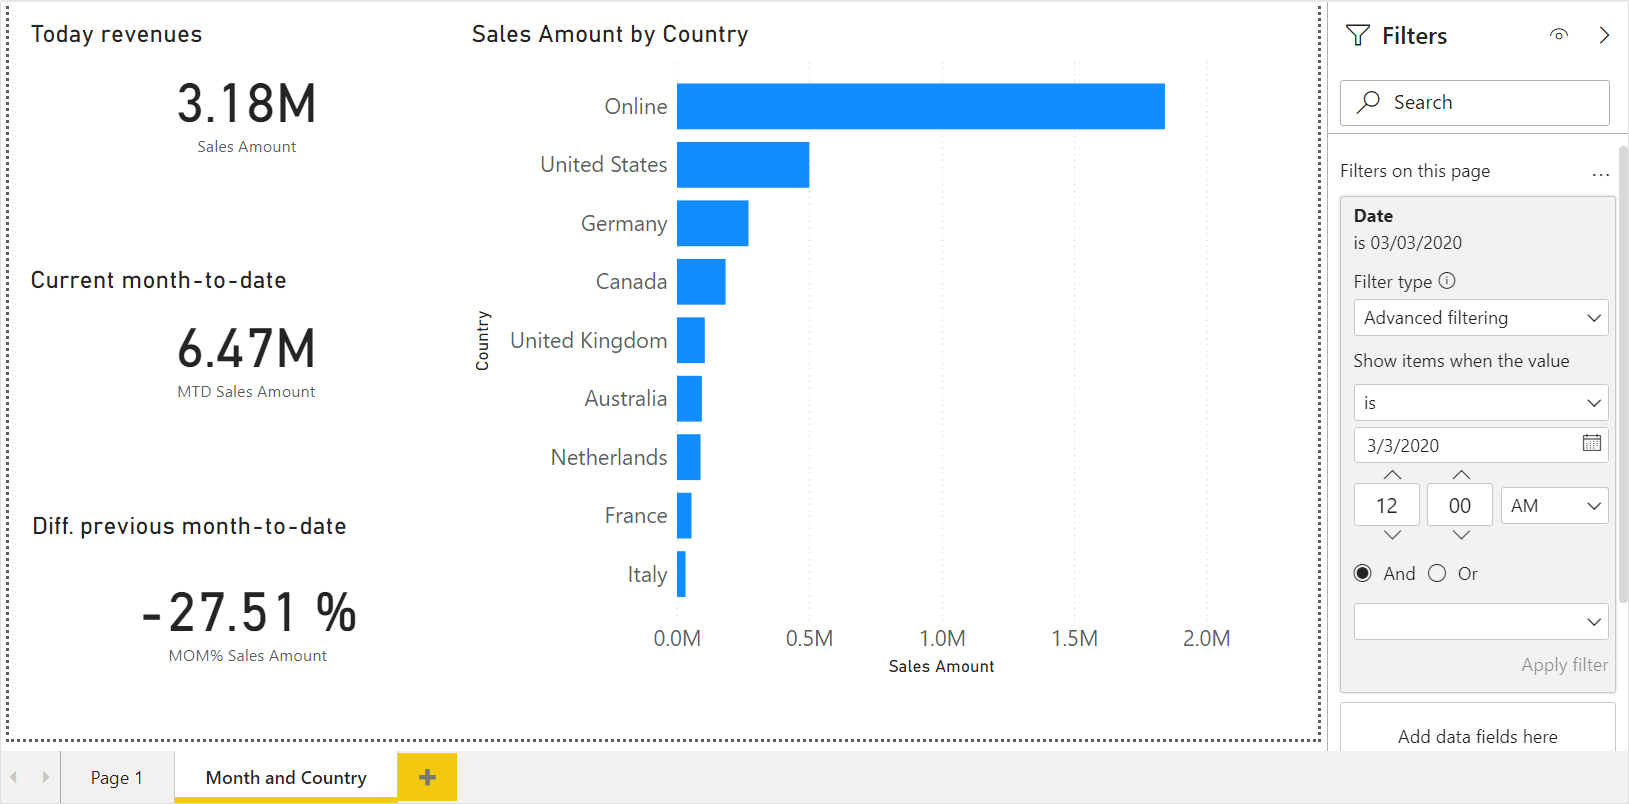
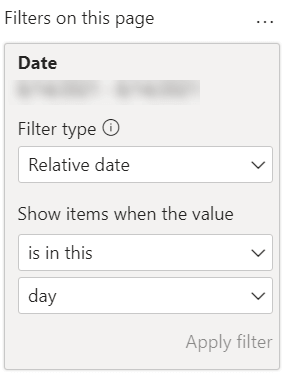
On the second page, we create visualizations to use in a Power BI dashboard that displays the “today” revenues, the corresponding month-to-date total, and the difference as a percentage with the previous month-to-date total. To simulate the “today” state with the data available, we set a page filter on the last date with data (3/3/2020 in our sample). In a production model, we could use a relative date filter set to “is in this day”.
Because the original Contoso model does not define month-to-date calculations, we create two report measures to use in our visualizations:
- MTD Sales Amount returns the month-to-date value of Sales Amount;
- MOM% Sales Amount returns the ratio of sales month-to-date over sales month-to-date the year before.
We can optimize the report measures for use in this single report, and ignore the requirements of other reports:
MTD Sales Amount :=
CALCULATE (
    [Sales Amount],
    REMOVEFILTERS ( Dates ),
    VALUES ( Dates[Year Month Number] )
)
MOM% Sales Amount :=
VAR LastDateWithSales = MAX ( Sales[Order Date] )
VAR CurrentMonthNumber = SELECTEDVALUE ( Dates[Year Month Number] )
VAR PreviousMonthNumber =  CurrentMonthNumber – 1
VAR SalesCurrentMonth =
    CALCULATE (
        [Sales Amount],
        REMOVEFILTERS ( Dates ),
        Dates[Year Month Number] = CurrentMonthNumber
    )
VAR SalesPreviousMonth =
    CALCULATE (
        [Sales Amount],
        REMOVEFILTERS ( Dates ),
        Dates[Year Month Number] = PreviousMonthNumber,
        Dates[Date] <= EDATE ( LastDateWithSales, -1 )
    )
VAR Result =
    DIVIDE ( SalesCurrentMonth - SalesPreviousMonth, SalesPreviousMonth )
RETURN Result
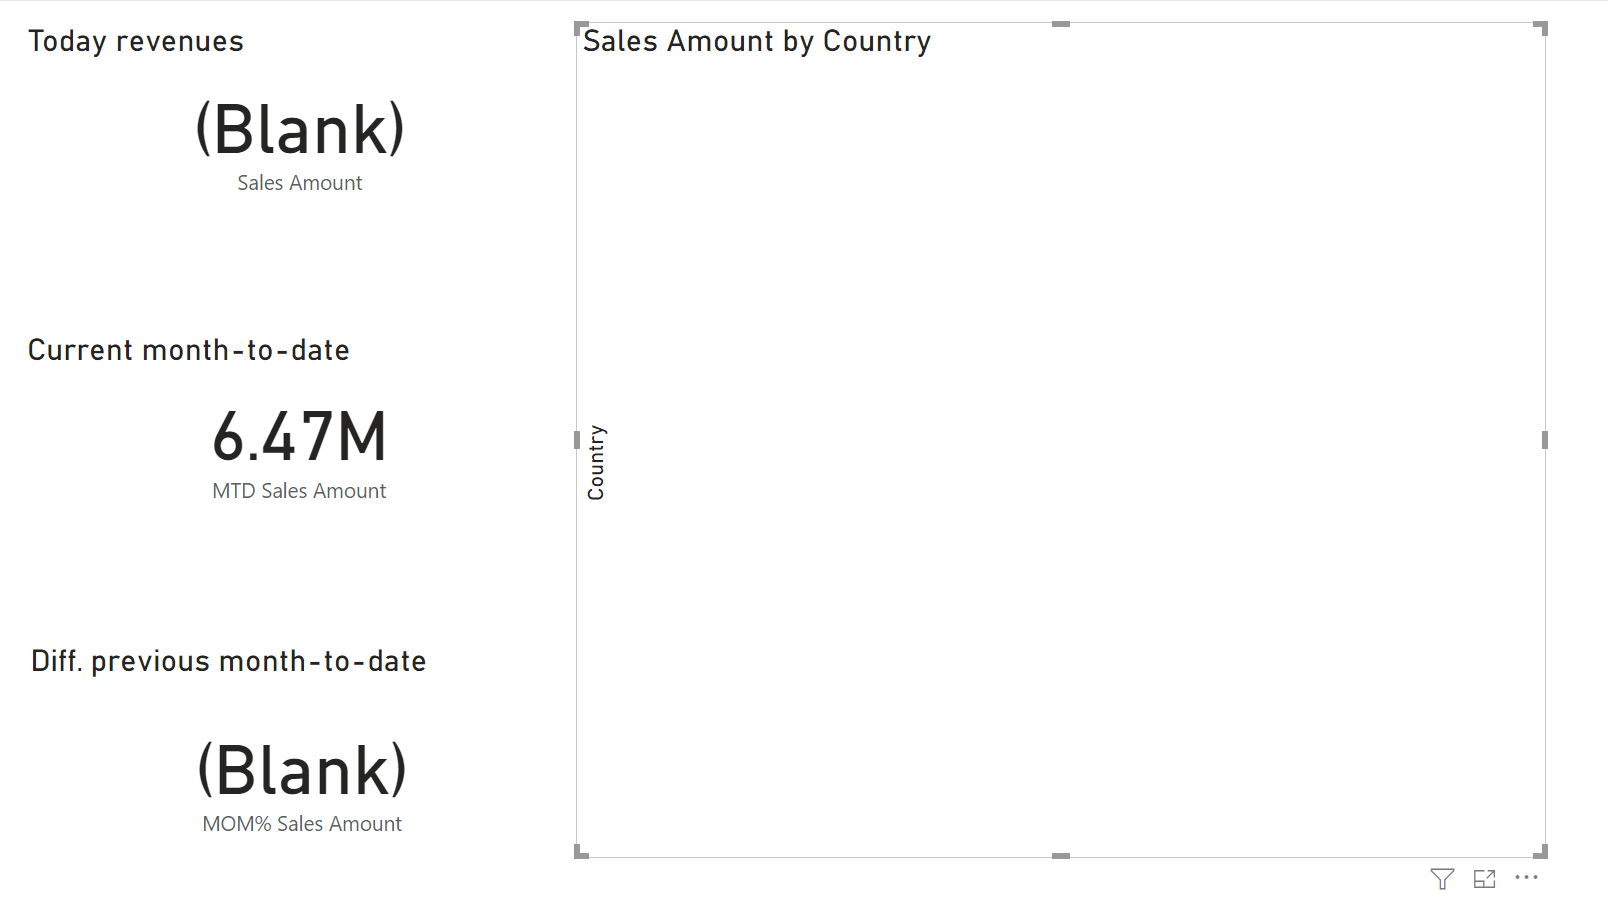
We create four visuals with a page filter that applies a filter on the last date with data (3/3/2020 in our sample). These are the visuals to create, listed by Title property – we did not include adjustments to font size and other graphical details:
- Today revenues
- Visual Type: Card
- Fields: Sales Amount measure
- Current month-to-date
- Visual Type: Card
- Fields: MTD Sales Amount measure
- previous month-to-date
- Visual Type: Card
- Fields: MOM% Sales Amount measure
- Sales Amount by Country
- Visual Type: Clustered Bar Chart
- Axis: Country column from the Store table
- Values: Sales Amount measure
Before publishing the report, we set the page filter to the proper setting for real-time updates. For a system in production, we should use the current date.
If you use the simulation described in the next step with the same configuration, you should set the page filter to 3/5/2020 (March 5, 2020).
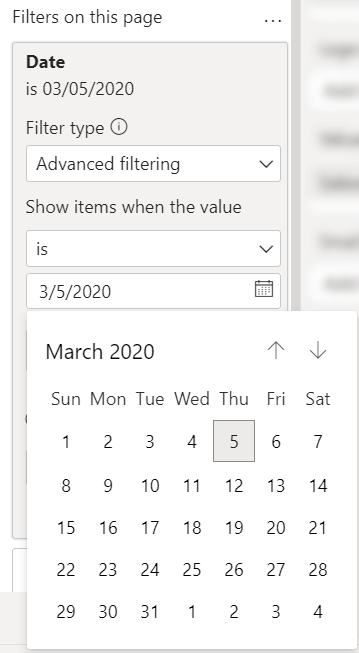
By setting the page filter to a date where there is no data (yet), you should see blank values in several visuals. This is to be expected. The visualization changes once the application sends data to the push dataset, as described in the following steps.
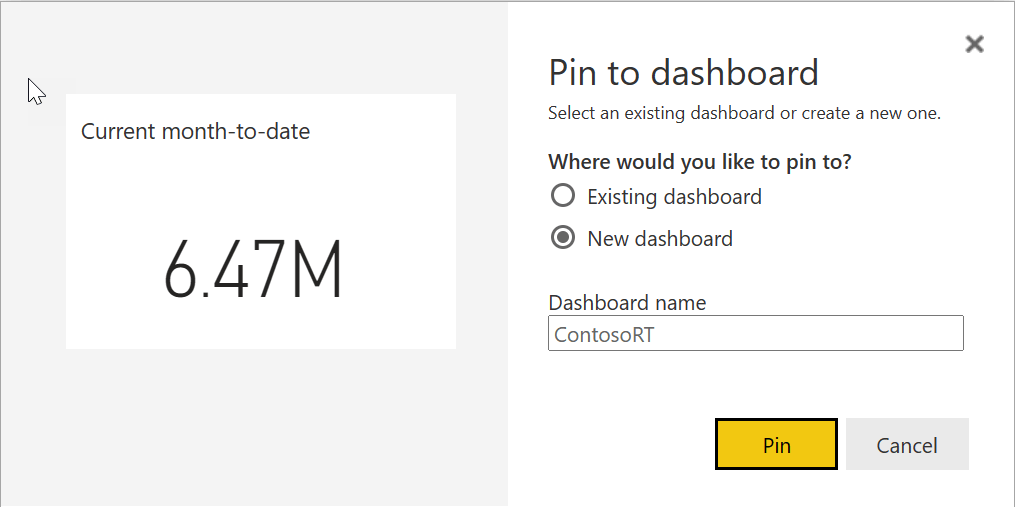
After setting the proper page filter, you should publish the report to powerbi.com if you are using Power BI Desktop, or save the report if you created it on the Power BI website. Then open the report on powerbi.com using a web browser and pin each visual to a new dashboard. We create a new ContosoRT dashboard while pinning the first visual, and we use the existing ContosoRT dashboard while pinning the other visuals.

Edit the ContosoRT dashboard by moving tiles to obtain a better layout, like in the following example.
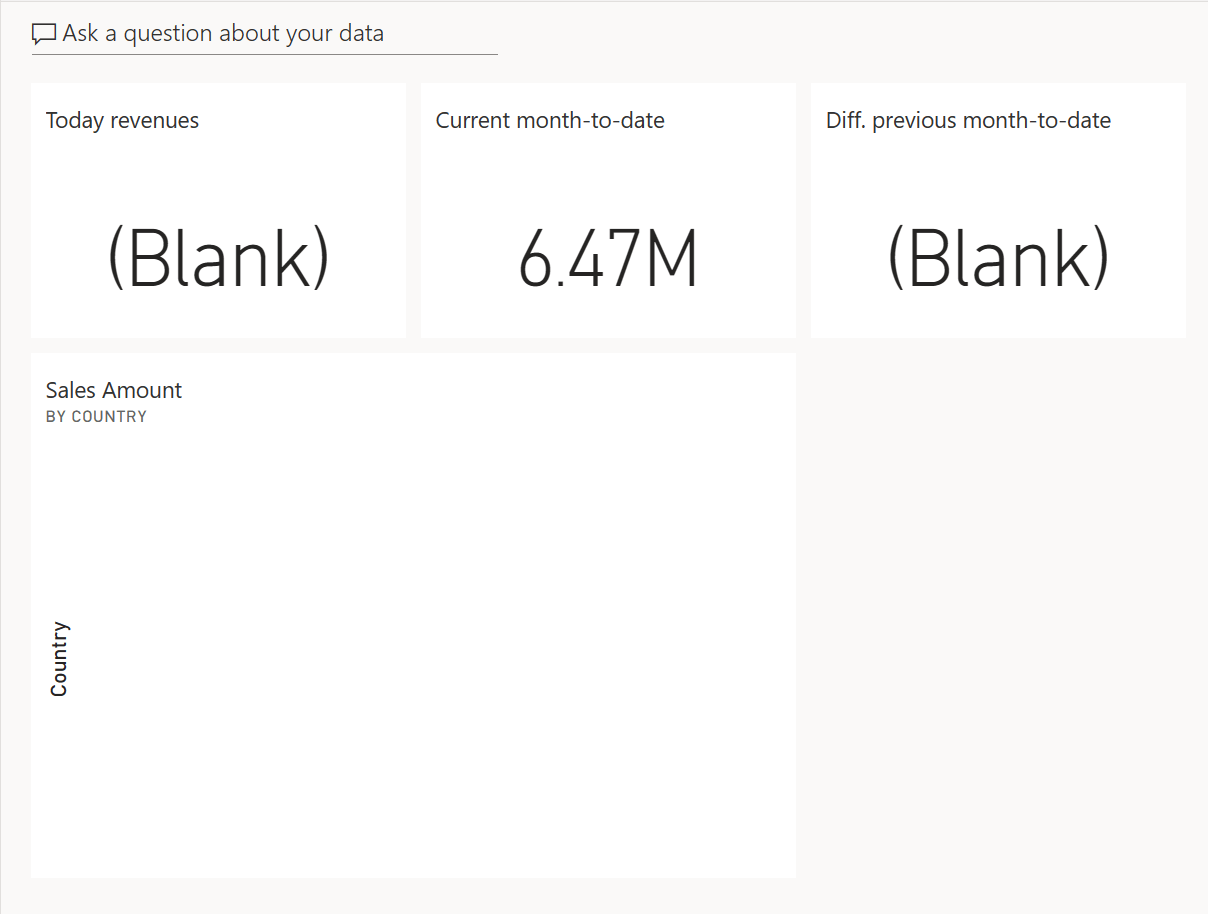
Even though the visuals are blank, it is essential to set the page filter the right way. The visuals pinned in a dashboard include the filters applied to the report when you pin the visual. Changing the filters in the report after pinning the visual would not change the configuration of the tiles already included in a dashboard. Once populated, the dashboard looks much better.
Writing data in push dataset (simulation)
The Power BI Push tools can simulate real-time transactions and send them to the push datasets. This feature is helpful in order to test the infrastructure and run a demo with live reports, even though the real-time updates in production require an additional coding effort as described in the next section.
The simulation feature uses a configuration file that defines the range of values in each column as well as the frequency of updates. You can find more details about the format of this file in the documentation. The sample used in this demo writes rows in the Sales table only, thus populating the Quantity, Net Price, Unit Price, Order Date, and StoreKey columns. The other columns of the Sales table are left blank:
PowerShell version
Enter-PushDataset -Configuration "ContosoSimulation.json" -Principal $Principal
                  -Secret $Secret -Tenant $Tenant -Group $Group -DatasetName ContosoRT

Command-line version
PbiPushTools.exe simulate -p %PRINCIPAL% -s %SECRET% -t %TENANT% -g %GROUP%
                          -dn ContosoRT -c "ContosoSimulation.json"
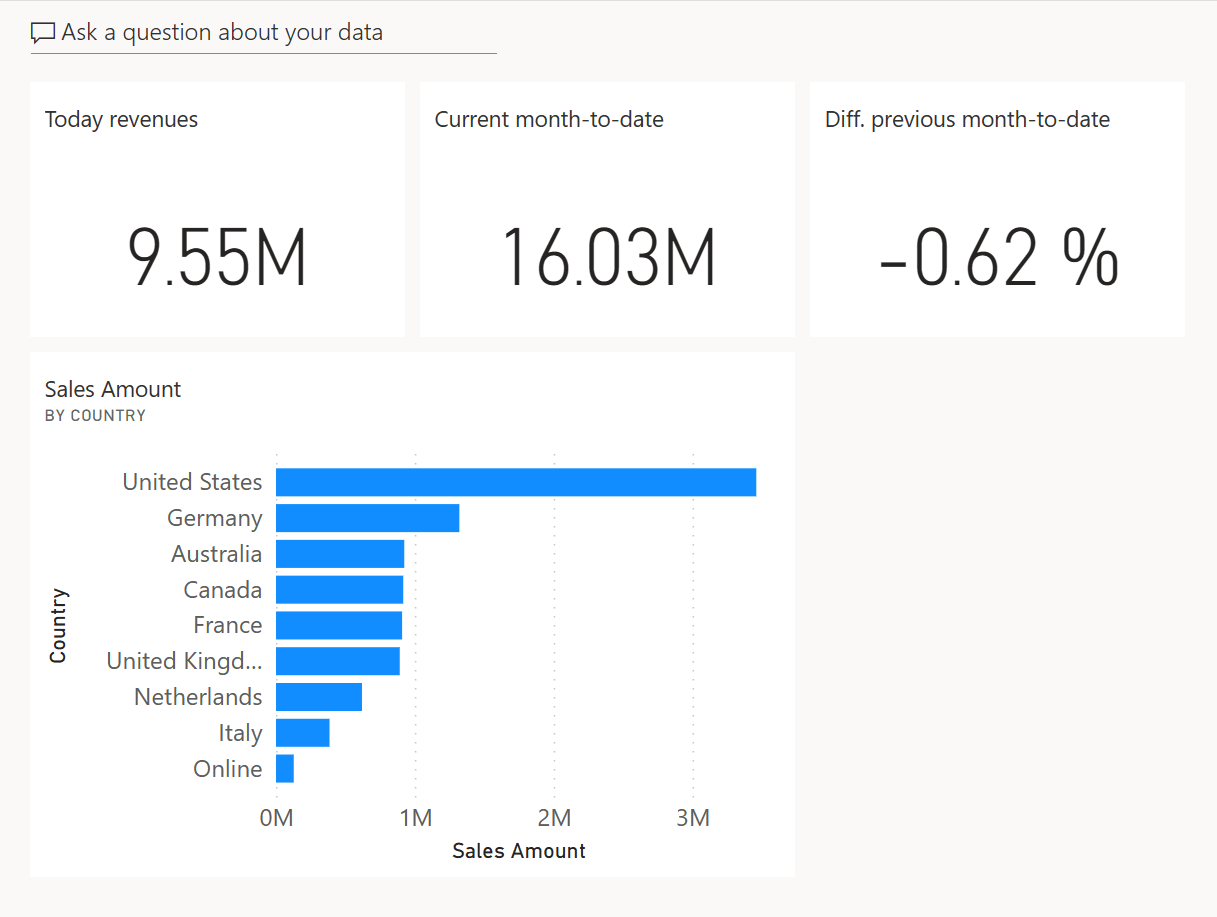
The configuration used in this example sends 98 rows to the Sales table every 2 seconds.
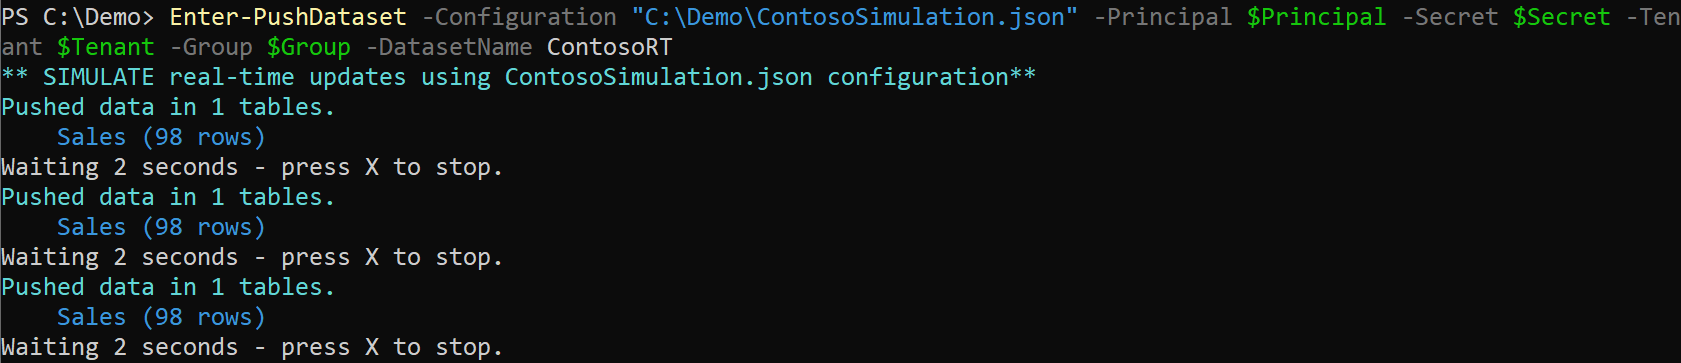
If you keep the simulation running, you should see an update of the dashboard every 2 seconds. You might have to refresh the dashboard page the first time to activate notifications if you still have the original dashboard page visible in your browser. You can experience something like the following animation by keeping the dashboard page open without any interaction with the user interface; the dashboard tiles are automatically updated when the push dataset receives new data.
If you open a page of the report, you have to refresh the report to get new data. Power BI reports do not support unattended updates; you can use the automatic page refresh feature to enable that behavior on a Power BI report.
Implementing real-time writes in push dataset (production)
Your application must send new rows to the push dataset, by using the Datasets PostRowsInGroup function available in the Power BI REST API. This step requires development skills and some level of interaction with the IT department that manages the infrastructure. Usually, a business user cannot implement this part of the architecture on their own. However, you can complete all previous steps without writing any JavaScript or .NET code. The result can be a proof-of-concept that shows a result attainable through minimal development efforts.
Once the push dataset model is published, the code to write is minimal – the biggest challenge is to integrate the application that generates the transactions to analyze. If you do not have control over the application, you should find a way to intercept new transactions. One way could be to intercept new rows in the relational database by using triggers. However, increasing the workload on the relational database defeats the very purpose of this architecture, which is to provide real-time updates without the additional workload created on the data source by DirectQuery.
Your application does not require the Sqlbi.PbiPushDataset library to send updates to the push dataset, even though you might want to take advantage of the existing PbiConnection class to manage the authentication and the connection information more easily. You can look at the C# implementation of PushSimulation methods to create a more specialized function that writes data according to your specific requirements.
Because of the POST Rows limitations in the Power BI REST API, you probably cannot afford to send the data one row at a time: it is usually better to group the rows you want to send into a smaller number of POST requests.
Conclusions
Push datasets allow the creation of solutions where real-time updates of reports and dashboards have a minimal impact on the data source workload compared to DirectQuery. The real-time update of a push dataset requires an initial development investment to intercept transactions and send them through the REST API. There are no additional licensing costs for using push datasets available on Power BI Pro nor Power BI Premium.