 Marco Russo & Alberto Ferrari
Power BI offers the capability to show tables with alternating colored rows so to make it easier to read the content of a report.
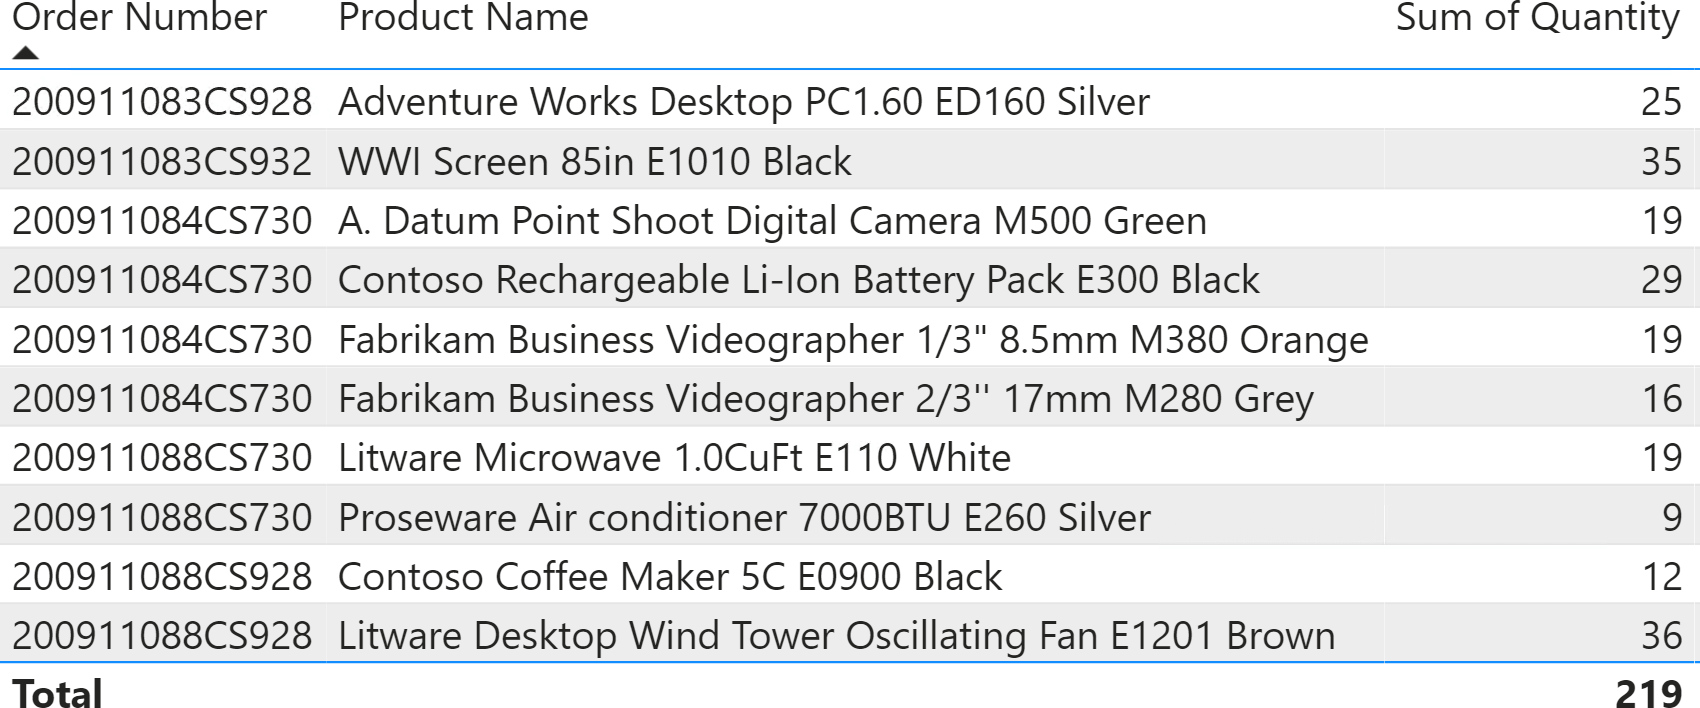
You might want to use a similar alternate coloring style for a different purpose: highlighting all the lines of one same order. If you look carefully at the figure above, you can discover that there are indeed five orders visible, each with one or more products. But there is no visual indication of the rows belonging to the same order. A better format using alternate background colors would be the following.
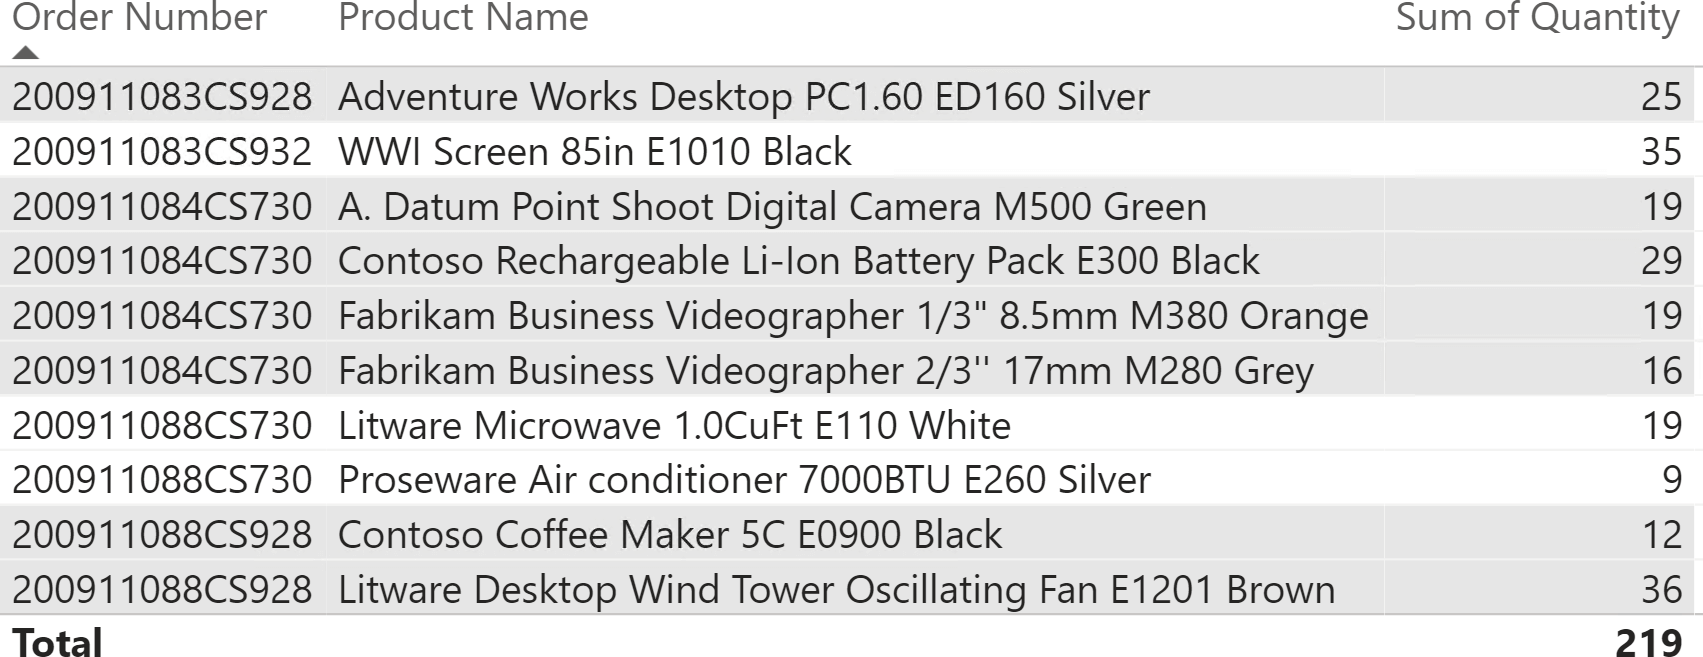
The background color of the rows depends on Sales[Order Number]. The background color switches between white and light gray every time the order number changes, so all the rows of the same order have the same background color and can be easily identified. You cannot obtain this visualization by only using a Power BI style, because the coloring of a row depends on the actual data in it. You can achieve this goal by using the conditional formatting feature in Power BI. You can set the background color of a cell according to the value of a measure. Therefore, you need a DAX formula that returns two values: one for the white rows and one for the gray rows. The value returned by the measure must alternate between those two values with each consecutive order number.
A possible (but incomplete) solution would be a measure that returns 0 for even order numbers and 1 for odd order numbers. However, this formula does not guarantee that the values are changing for every order. In case you filter two orders with an even number in a row, they would be colored the same. If you look at the figures, all order numbers are even! Nevertheless, the idea of using odd and even order numbers looks promising. We only need to transform the order number into an integer that increases by one for each order, regardless of the actual order number.
The RANKX function in DAX serves exactly this purpose. We can rank the rows in the report by their order number, and then color the table in the report depending on whether the rank is odd or even. Besides, due to its simplicity this formula is a perfect opportunity to expand on one of the lesser known arguments of RANKX: its third parameter.
Let us start with the code:
RankOrder =
VAR OrderNumbers =                       -- By using ALLSELECTED ( Sales[Order Number] )
    CALCULATETABLE (                     -- we would get all the order numbers
        VALUES ( Sales[Order Number] ),  -- if there were no explicit filter on the
        ALLSELECTED ( )                  -- order numbers. Therefore, we use
    )                                    -- VALUES / ALLSELECTED to reduce the number of orders
                                         -- evaluated in the ranking.
VAR CurrentOrder =
    SELECTEDVALUE ( Sales[Order Number] )
VAR Result =
    IF (
        HASONEVALUE ( Sales[Order Number] ),   -- Check that only one order is visible.
        RANKX (
            OrderNumbers,                -- Table to build the lookup values.
            Sales[Order Number],         -- Expression to use during the iteration.
            CurrentOrder,                -- Value to rank. We must use SELECTEDVALUE
            ASC                          -- to retrieve the current row in the report.
        )
    )
RETURN
    Result
The OrderNumbers variable stores the order numbers that are visible in the table visualization. Be mindful that we did not use ALLSELECTED( Sales[Order Number] ) because it would return all the values of the Sales[Order Number] column. Indeed, ALLSELECTED as a table function returns the filtered values only if the column is being actively filtered. We retrieve the order numbers visible in the current visual by using the VALUES function evaluated with ALLSELECTED as a CALCULATE modifier.
The CurrentOrder variable is important too. Each row of the table visual is showing exactly one order number. Therefore, each cell has a filter context that filters exactly one order. In this scenario, SELECTEDVALUE returns the value of the order number currently being filtered. You cannot omit SELECTEDVALUE, because the Sales[Order Number] column reference alone requires a row context which is not present in our formula.
The Result variable evaluates the ranking if and only if there is only one order number visible, to avoid any calculation for the total and for any subtotal that groups two or more orders. If there is only one order in the filter context, then RANKX provides the ranking.
If you have used RANKX in the past, you were likely ranking a measure like Sales Amount. When you apply RANKX to a measure, you typically only use the first two arguments of RANKX. RANKX evaluates the measure during the iteration over the table provided in the first argument; because of the context transition, RANKX evaluates the expression of the measure in a filter context obtained by the row being iterated. After the iteration, RANKX re-evaluates the same measure in the original filter context to obtain the value to rank.
In our case, we are ranking a column value and not the result of a measure. Therefore, we do not rely on a context transition. During the iteration, RANKX evaluates the Sales[Order Number] expression within a row context corresponding to the row being iterated. At the end of the iteration, RANKX must obtain the value to rank, but can no longer use the Sales[Order Number] expression because the row context is missing in the original evaluation context.
The third argument of RANKX is now useful: RANKX uses the third argument to get the value to rank. If the third argument is missing, RANKX evaluates the same expression passed in the second argument in the original evaluation context, which is why you have probably never used it. In our example, we provide CurrentOrder as the third argument of RANKX, getting the rank of the order number displayed in the report.
You can see the result of the RankOrder measure in the following picture.
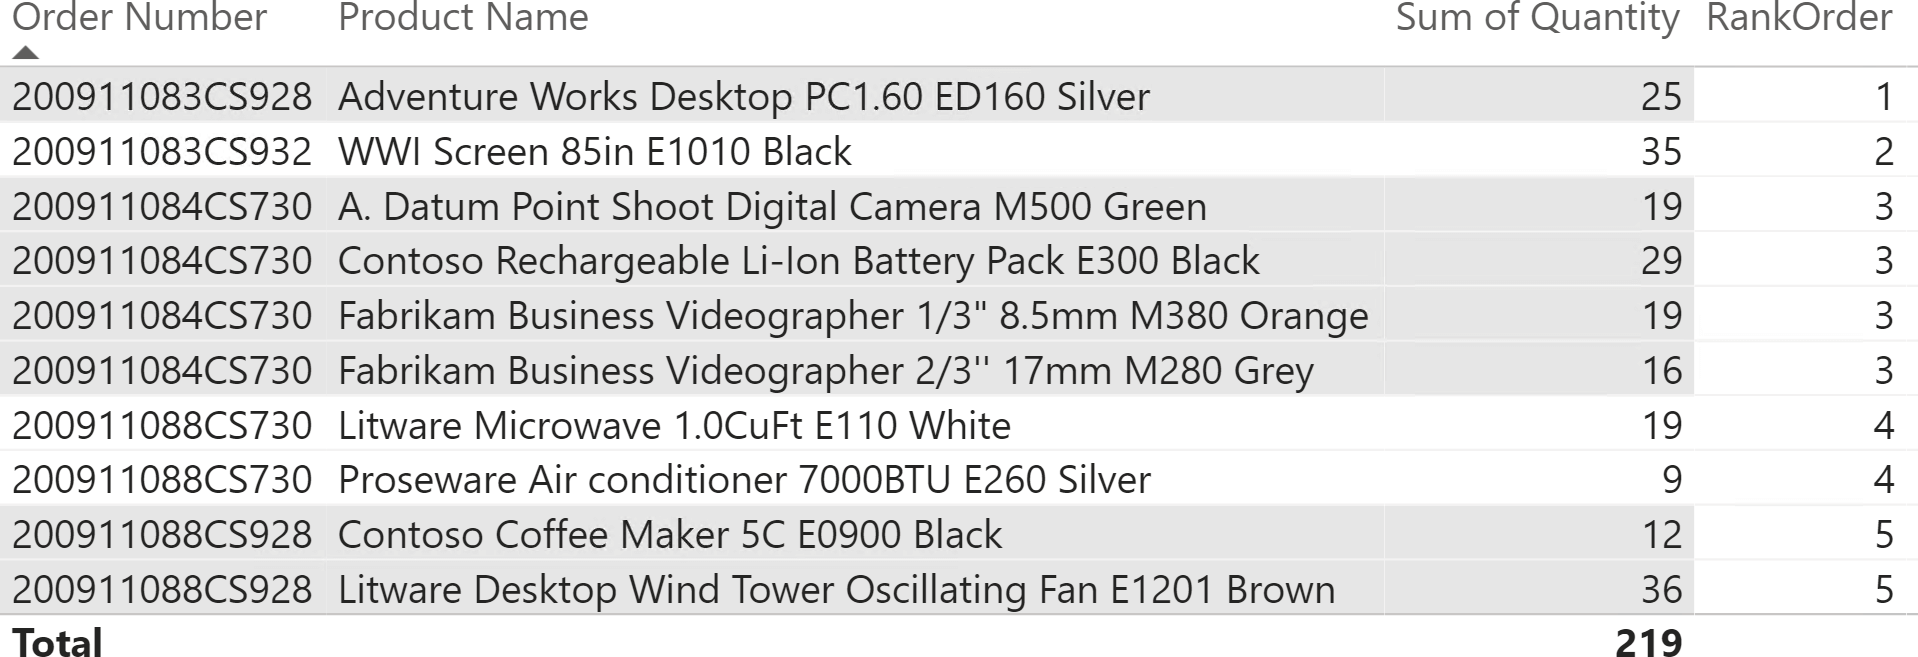
RankOrder is a number increasing by one each time the row shows a different order number, regardless of the actual Order Number value. We can create the BandNumber measure to transform this number into 0 or 1:
BandNumber := MOD ( [RankOrder], 2 )
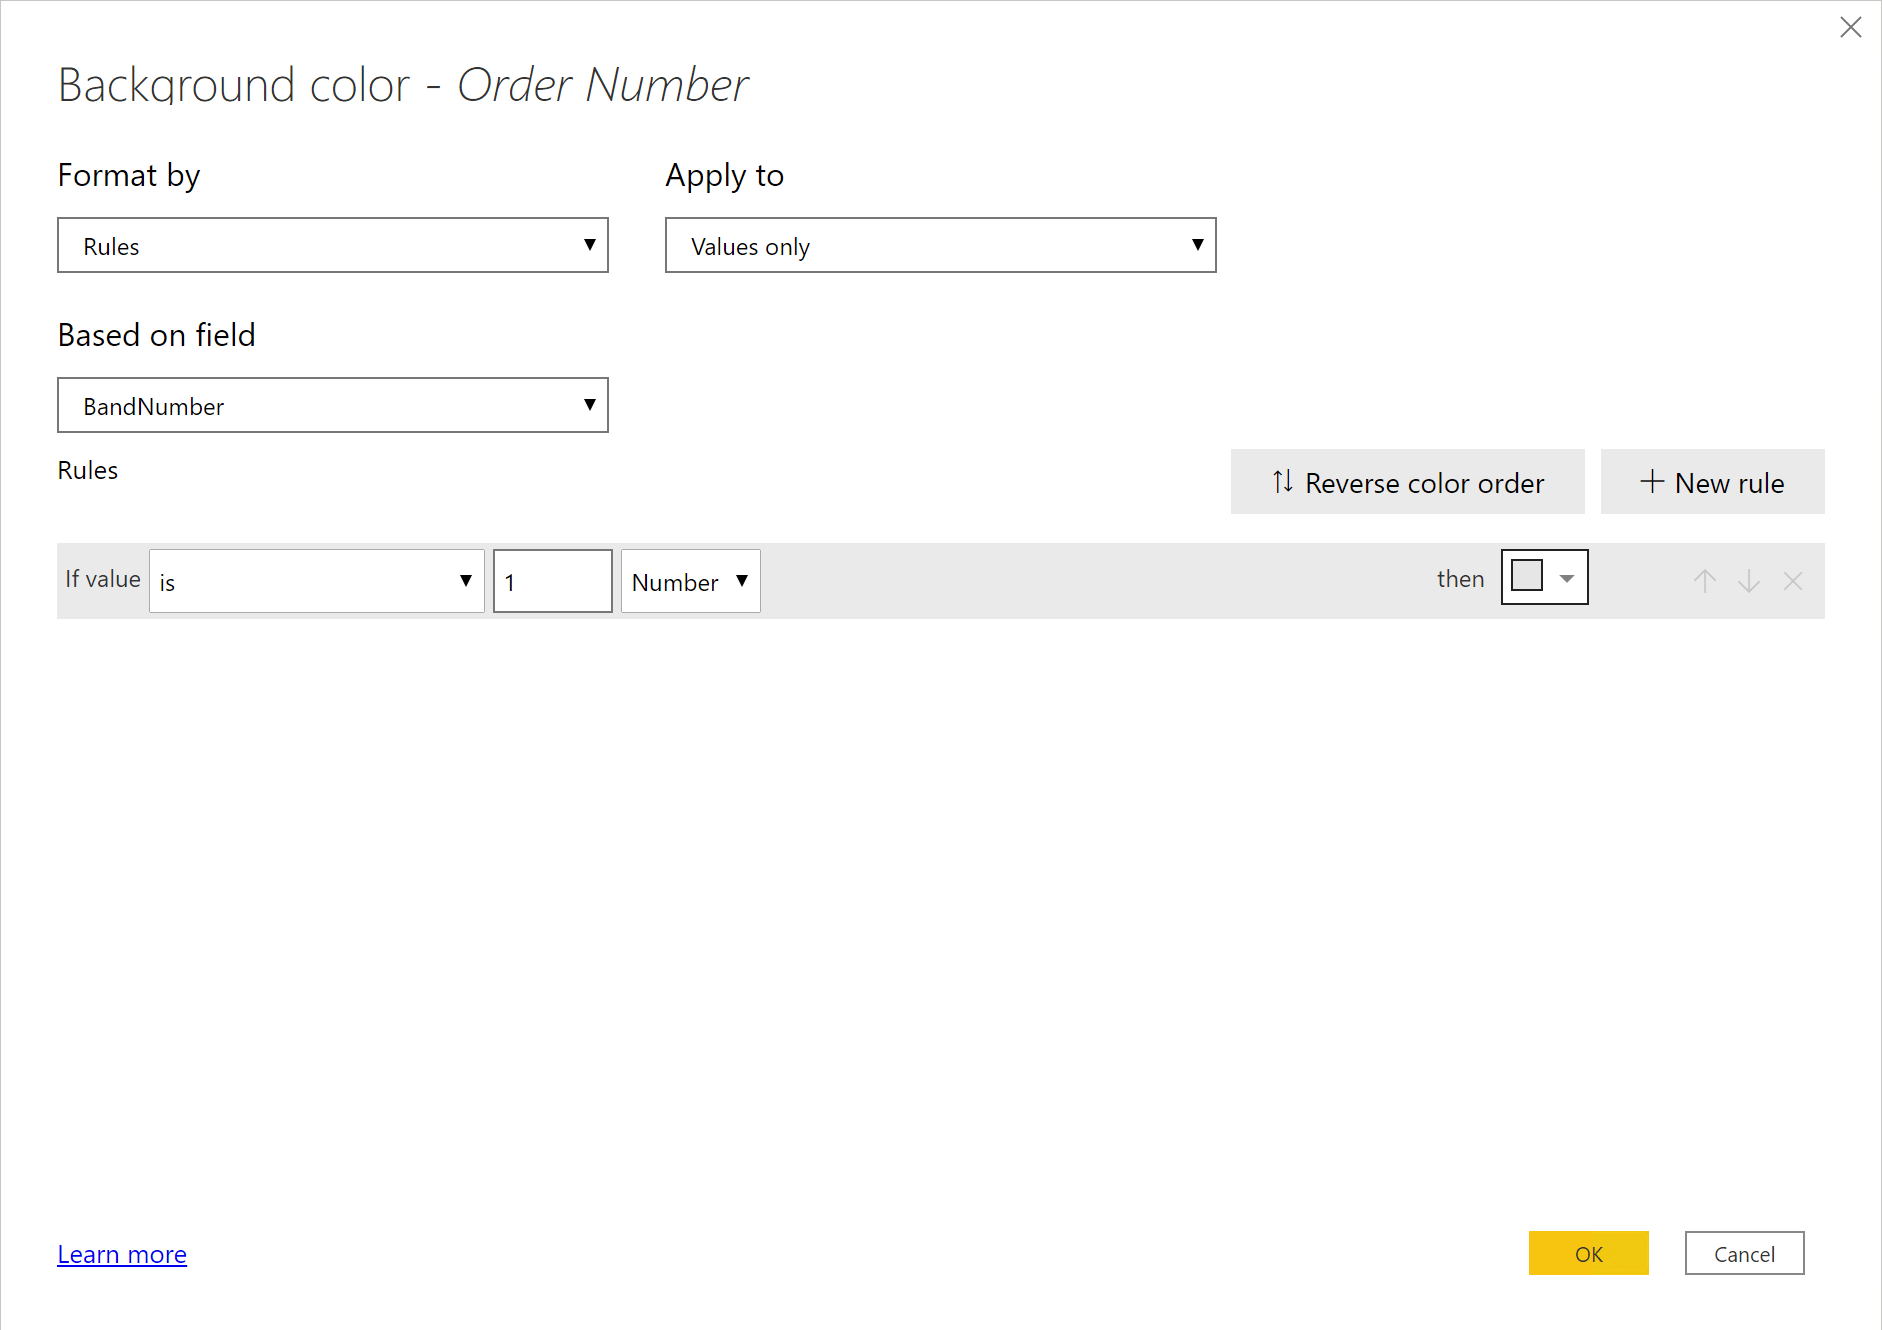
The BandNumber measure is easy to use in the conditional formatting options of Power BI to change the background of all the columns you want to format. Unfortunately, you have to apply this format to every column shown in the visual because it is not possible to set conditional formatting for the entire row.
The report now shows alternate colors depending on the order number. You can hide the RankOrder and BandNumber measures; indeed, they are just internal measures whose sole purpose is to improve data visualization.
As you see, DAX is not only useful to compute super-complex expressions. You can also rely on DAX to format your report the way you like, by combining the power of DAX with the flexibility of conditional formatting.
Returns the rank of an expression evaluated in the current context in the list of values for the expression evaluated for each row in the specified table.
RANKX ( <Table>, <Expression> [, <Value>] [, <Order>] [, <Ties>] )
Returns all the rows in a table, or all the values in a column, ignoring any filters that might have been applied inside the query, but keeping filters that come from outside.
ALLSELECTED ( [<TableNameOrColumnName>] [, <ColumnName> [, <ColumnName> [, … ] ] ] )
When a column name is given, returns a single-column table of unique values. When a table name is given, returns a table with the same columns and all the rows of the table (including duplicates) with the additional blank row caused by an invalid relationship if present.
VALUES ( <TableNameOrColumnName> )
Evaluates an expression in a context modified by filters.
CALCULATE ( <Expression> [, <Filter> [, <Filter> [, … ] ] ] )
Returns the value when there’s only one value in the specified column, otherwise returns the alternate result.
SELECTEDVALUE ( <ColumnName> [, <AlternateResult>] )