 Marco Russo
In both Power BI and Excel, all the elements selected in a slicer are considered in a logical OR condition. However, different slicers are always considered in a logical AND condition. For example, the following screenshot show that the Units measure provides the quantity of Contoso products sold to customers who have a Professional occupation.
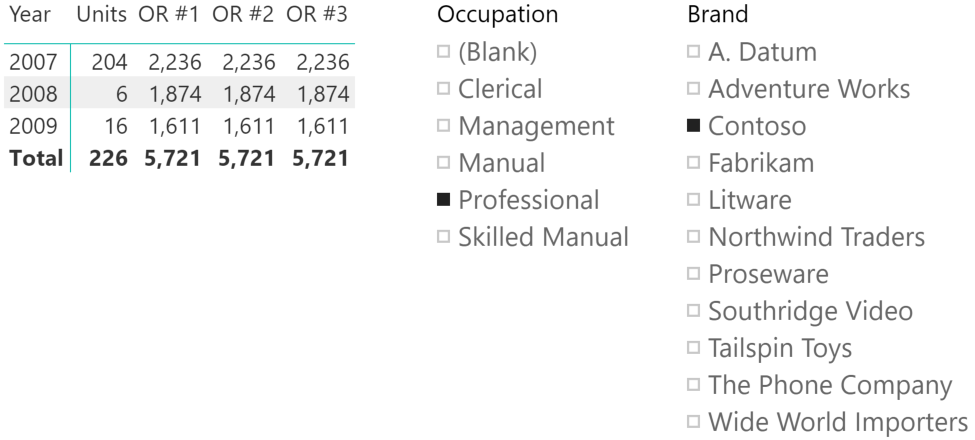
Usually, the logical AND condition is the expected behavior for scenarios with different slicers. However, there could be cases where there is a need for a logical OR condition between several slicers. In our example, the semantic would be, “show the quantity sold of products that are of brand Contoso or that have been sold to customers who have a Professional occupation”. The measures OR #1, OR #2, and OR #3 show the same result obtained with three different techniques.
The first two techniques are best practices and might provide different performance depending on the data distribution. The third technique is usually a bad idea because it implements a table filter rather than a multi-column filter. It is included for informational purposes, and as an example of what not to do in production code.
Implementing multi-column filter #1
The first technique uses the possible combinations between two slicers. The selection of each slicer is combined with all the values available in the other slicer. The result might include combinations that do not exist in the underlying data used to compute the Units measure, but it is usually faster if the two slicers do not have many (hundreds or more) unique values.
OR #1 :=
CALCULATE (
    [Units],
    UNION (
        CROSSJOIN ( VALUES ( 'Product'[Brand] ), ALL ( Customer[Occupation] ) ),
        CROSSJOIN ( ALL ( 'Product'[Brand] ), VALUES ( Customer[Occupation] ) )
    )
)
The single multi-column filter applied to the filter context overrides the existing filters over the two columns. The generic pattern applied to two slicers over columns T1[Column1] and T2[Column2] is the following:
CALCULATE (
    [measure],
    UNION (
        CROSSJOIN ( VALUES ( T1[Column1] ), ALL ( T2[Column2] ) ),
        CROSSJOIN ( ALL ( T1[Column1] ), VALUES ( T2[Column2] ) )
    )
)
Implementing multi-column filter #2
The second technique uses a scan of the table containing the data used by the Units measure to retrieve only the existing combinations of the two columns selected. This approach is usually more expensive compared to the previous approach, but it could be faster in case there are many values (hundreds or more) in the two slicers.
OR #2 :=
CALCULATE (
    [Units],
    FILTER (
        CALCULATETABLE (
            SUMMARIZE ( Sales, 'Product'[Brand], Customer[Occupation] ),
            ALL ( 'Product'[Brand] ),
            ALL ( Customer[Occupation] )
        ),
        OR (
            'Product'[Brand] IN VALUES ( 'Product'[Brand] ),
            Customer[Occupation] IN VALUES ( Customer[Occupation] )
        )
    )
)
As in the previous pattern, the single multi-column filter applied to the filter context overrides the existing filters over the two columns. In this case, it is necessary to know the table used to aggregate values for the measure, otherwise it is not possible to properly call the SUMMARIZE function. The generic pattern applied to two slicers over columns T1[Column1] and T2[Column2] for a measure based on data in the Fact table is as follows:
CALCULATE (
    [measure],
    FILTER (
        CALCULATETABLE (
            SUMMARIZE ( Fact, T1[Column1], T2[Column2] ),
            ALL ( T1[Column1] ),
            ALL ( T2[Column2] )
        ),
        OR (
            T1[Column1] IN VALUES ( T1[Column1] ),
            T2[Column2] IN VALUES ( T2[Column2] )
        )
    )
)
Implementing table filter #3
The third and last technique applies a table filter to the table containing the data used by the Units measure. A table filter in a CALCULATE function is almost always a bad practice. It tends to cause bad performance and possible side effects caused by the filter propagation generated by the expanded table. We are only including this example to highlight that, although this approach works, it does not present any advantages and it also results in a longer and more complex code to implement.
-- Example of bad table filter patter - try to avoid in your code!
OR #3 :=
CALCULATE (
    [Units],
    VAR Brands = VALUES ( 'Product'[Brand] )
    VAR Occupations = VALUES ( Customer[Occupation] )
    RETURN
    CALCULATETABLE (
        FILTER (
            Sales,
            RELATED ( 'Product'[Brand] ) IN Brands
                || RELATED ( Customer[Occupation] ) IN Occupations
        ),
        ALL ( 'Product'[Brand] ),
        ALL ( Customer[Occupation] )
    )
)
The generic pattern applied to two slicers over columns T1[Column1] and T2[Column2] for a measure based on data in the Fact table is the following:
-- Example of bad table filter patter - try to avoid in your code!
CALCULATE (
    [measure],
    VAR Filter1 = VALUES ( T1[Column1] )
    VAR Filter2 = VALUES ( T2[Column2] )
    RETURN
    CALCULATETABLE (
        FILTER (
            Fact,
            RELATED ( T1[Column1] ) IN Filter1
                || RELATED ( T2[Column2] ) IN Filter2
        ),
        ALL ( T1[Column1] ),
        ALL ( T2[Column2] )
    )
)
Conclusions
Power BI reports and PivotTables in Excel provide independent slicers that are always applied as filters in an AND condition to standard measures of the data model. Using DAX, it is possible to control the filter context and to use the slicers selection as an OR condition. This approach requires adequate knowledge of the slicers that will be used and cannot be applied generically to any slicer of a report. However, it is possible to create measures that work in specific reports knowing which slicers must be used in an OR condition.
Returns TRUE if any of the arguments are TRUE, and returns FALSE if all arguments are FALSE.
OR ( <Logical1>, <Logical2> )
Checks whether all arguments are TRUE, and returns TRUE if all arguments are TRUE.
AND ( <Logical1>, <Logical2> )
Creates a summary of the input table grouped by the specified columns.
SUMMARIZE ( <Table> [, <GroupBy_ColumnName> [, [<Name>] [, [<Expression>] [, <GroupBy_ColumnName> [, [<Name>] [, [<Expression>] [, … ] ] ] ] ] ] ] )
Evaluates an expression in a context modified by filters.
CALCULATE ( <Expression> [, <Filter> [, <Filter> [, … ] ] ] )