 Marco Russo
The Power BI Performance Analyzer is a feature that simplifies the collection of DAX queries generated by Power BI. We described it previously in the Introducing the Power BI Performance Analyzer article. Version 2.9.0 of DAX Studio introduced a new feature to import the information captured by the Power BI Performance Analyzer.
DAX Studio helps you navigate through the performance metrics; it improves the productivity in executing one or more of the collected queries, reducing the number of copy/paste operations required. In order to use the DAX Studio feature, first you must export the data collected by Performance Analyzer in Power BI Desktop.
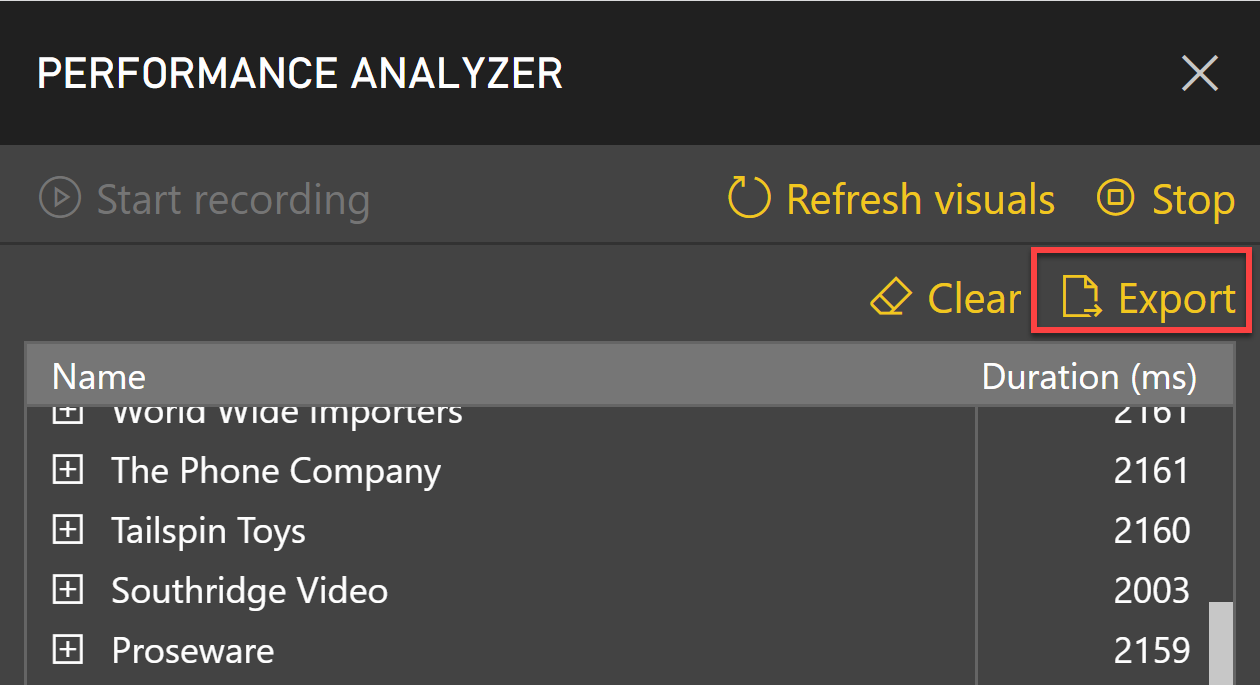
The button saves a file named PowerBIPerformanceData.JSON by default. You can change the file name to save, but we suggest keeping the JSON extension.
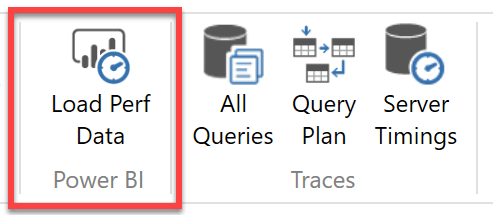
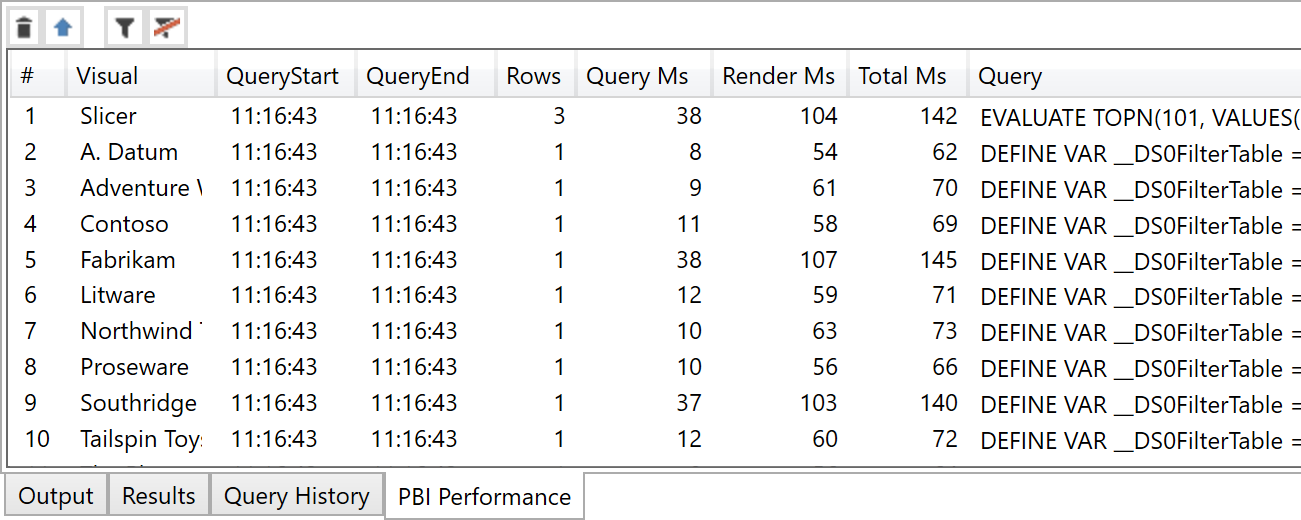
At this point you can switch to DAX Studio, click the Load Perf Data button and select the JSON file you exported from Power BI. Once the file is loaded, you see the PBI Performance pane in DAX displaying all the queries captured by the Power BI Performance Analyzer.
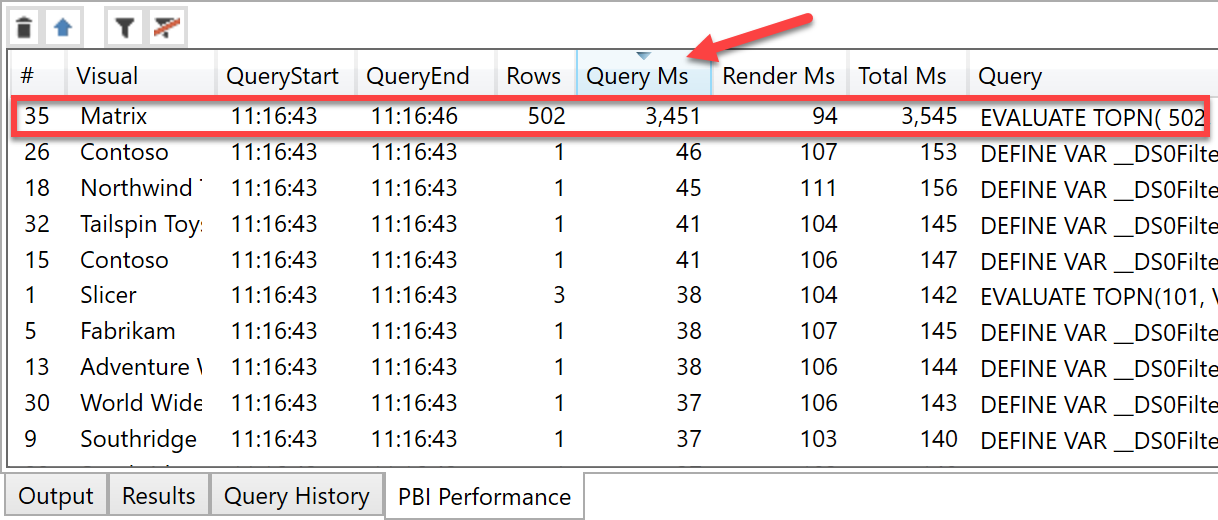
Because you are probably interested in detecting the slowest DAX query, you can just click on the Query Ms column sorting the queries by execution time. Every click will switch the order (ascending/descending). By choosing the descending order, you can see the slowest query at the top, also identifying the culprit in the Visual column.
If you double click the text in the Query column, the DAX code in the selected row is copied into the query window of DAX Studio, including an initial comment with the metrics of the query collected in the JSON file.
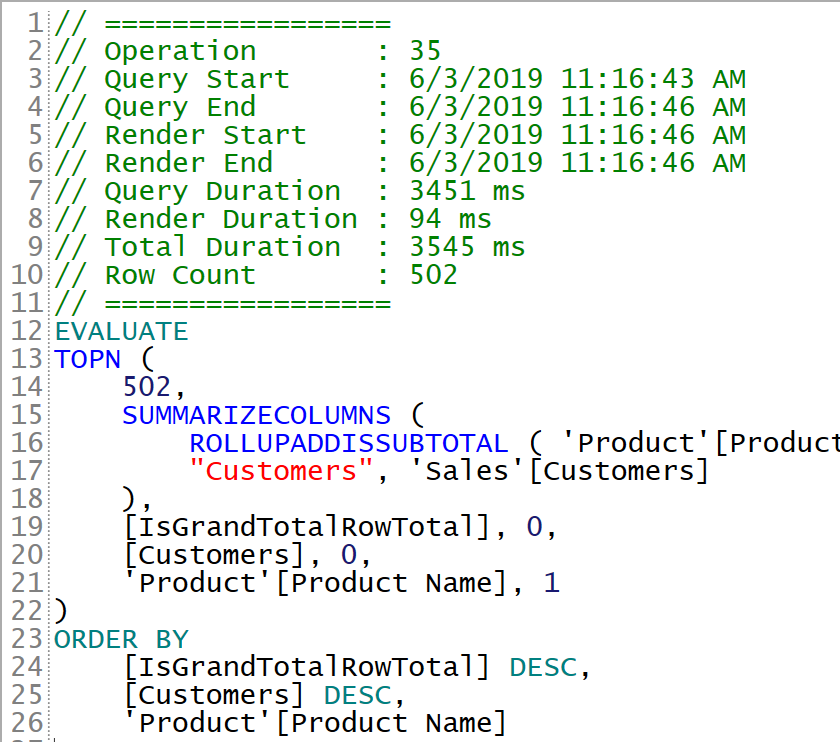
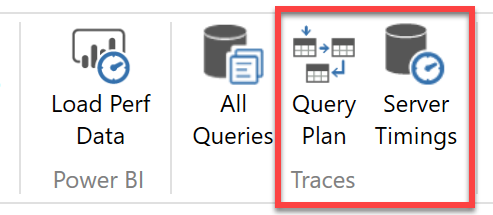
At this point you can run the query again, enabling Query Plan and Server Timings to collect more details about why the query is slow.
If you want to learn more about how to optimize your DAX code, you can use the following links:
- Articles about DAX Optimization on SQLBI.com
- Video: DAX Studio – Improved Debug Experience
- Video: My Power BI report is slow: what should I do?
- Video: Power BI DAX optimization examples