 Alberto Ferrari
Conditional formatting is a handy feature in Power BI; combined with DAX skills, conditional formatting can produce excellent results. In this example, we show how to highlight relevant information in a matrix by formatting the desired cells.
We look at the sales of Contoso in different countries and years. If we look for geographical areas where some brands do not sell well, we can start the investigation with a matrix like the one below.
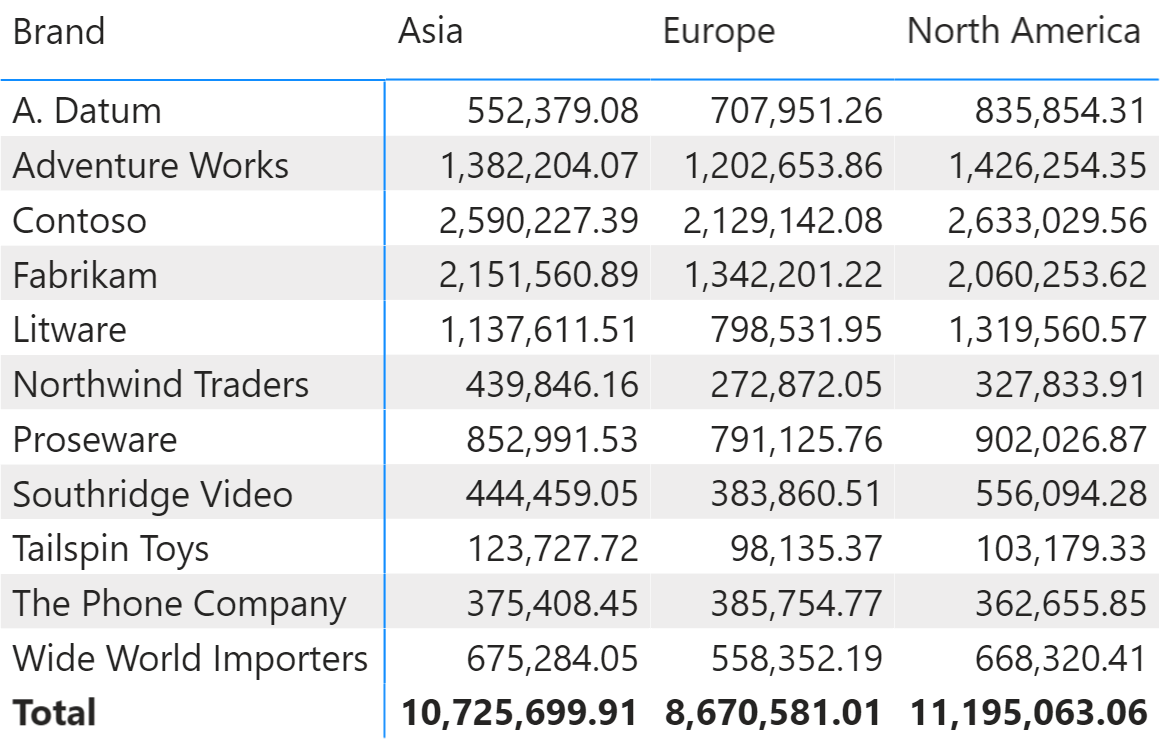
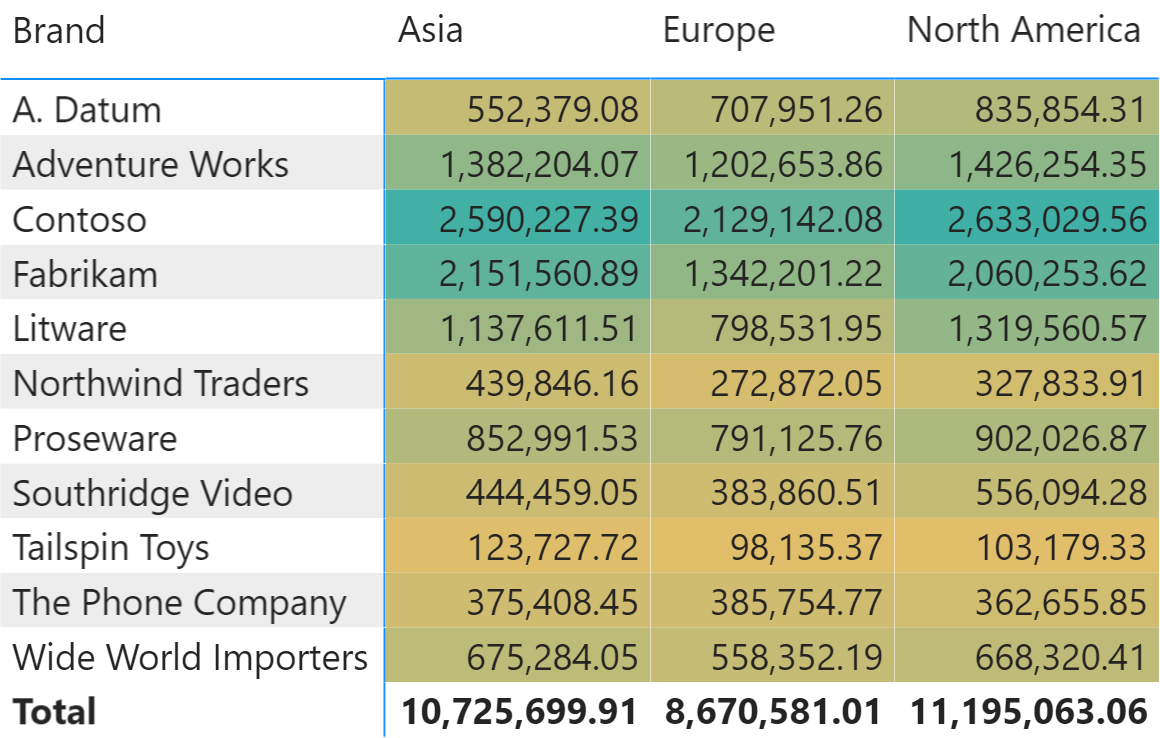
If we were to search for specific kinds of information by just looking at the numbers, we would be on our own. The matrix itself is not highlighting the most relevant information, nor guiding our eyes where it matters. The conditional feature in Power BI can improve data visualization, highlighting the higher and lower values with different background colors.
However, there are cases where we want to identify the best and worst figures in a matrix full of numbers. In other words, we want to highlight the cell with the maximum value – the best combination of continent and brand in the previous picture – and the minimum value – the worst combination of brand and continent. The following picture shows a matrix that highlights the best/worst cases.
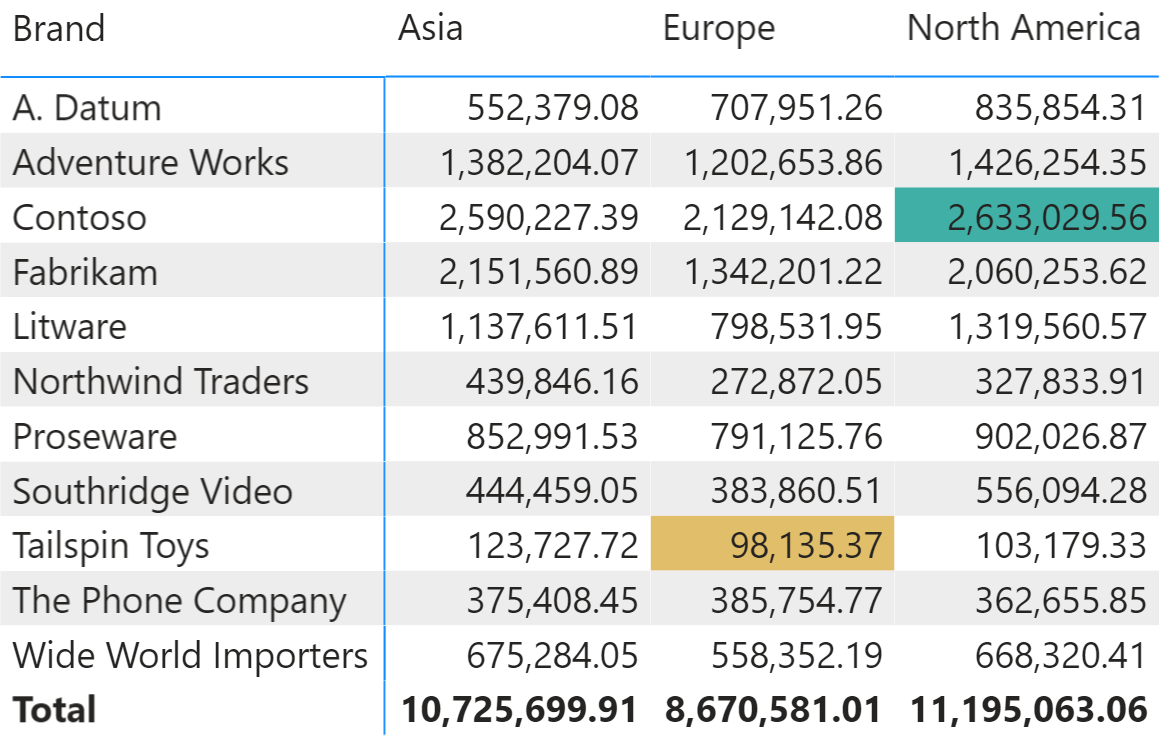
We can obtain this result by mixing conditional formatting of the background with a measure that returns a number indicating whether the current cell is the minimum or the maximum of all the cells in the matrix. As we discuss later, we can use the same technique to highlight cells with an arbitrary business rule.
We need a MinMax measure that rebuilds the full result of the matrix in a temporary table. It then identifies the minimum and maximum values among all the ones computed. Finally, it checks if the current value of the measure is the minimum, the maximum, or any other value:
MinMax =
VAR Vals =
    CALCULATETABLE(
        ADDCOLUMNS (
            SUMMARIZE ( Sales, 'Product'[Brand], Store[Continent] ),
            "@SalesAmt", [Sales Amount]
        ),
        ALLSELECTED ()
    )
VAR MinValue = MINX ( Vals, [@SalesAmt] )
VAR MaxValue = MAXX ( Vals, [@SalesAmt] )
VAR CurrentValue = [Sales Amount]
VAR Result =
    SWITCH (
        TRUE,
        CurrentValue = MinValue, 1, -- 1 for MIN
        CurrentValue = MaxValue, 2  -- 2 for MAX
    )
RETURN
    Result
The MinMax measure must return a number because otherwise, it cannot be used in the conditional formatting panel. The MinMax measure returns 1 only for the cell with the minimum value, 2 for the cell with the maximum value, and blank otherwise.
We configure the conditional formatting of the matrix so that it uses the information provided by the MinMax measure to color the cell background with the following rule.
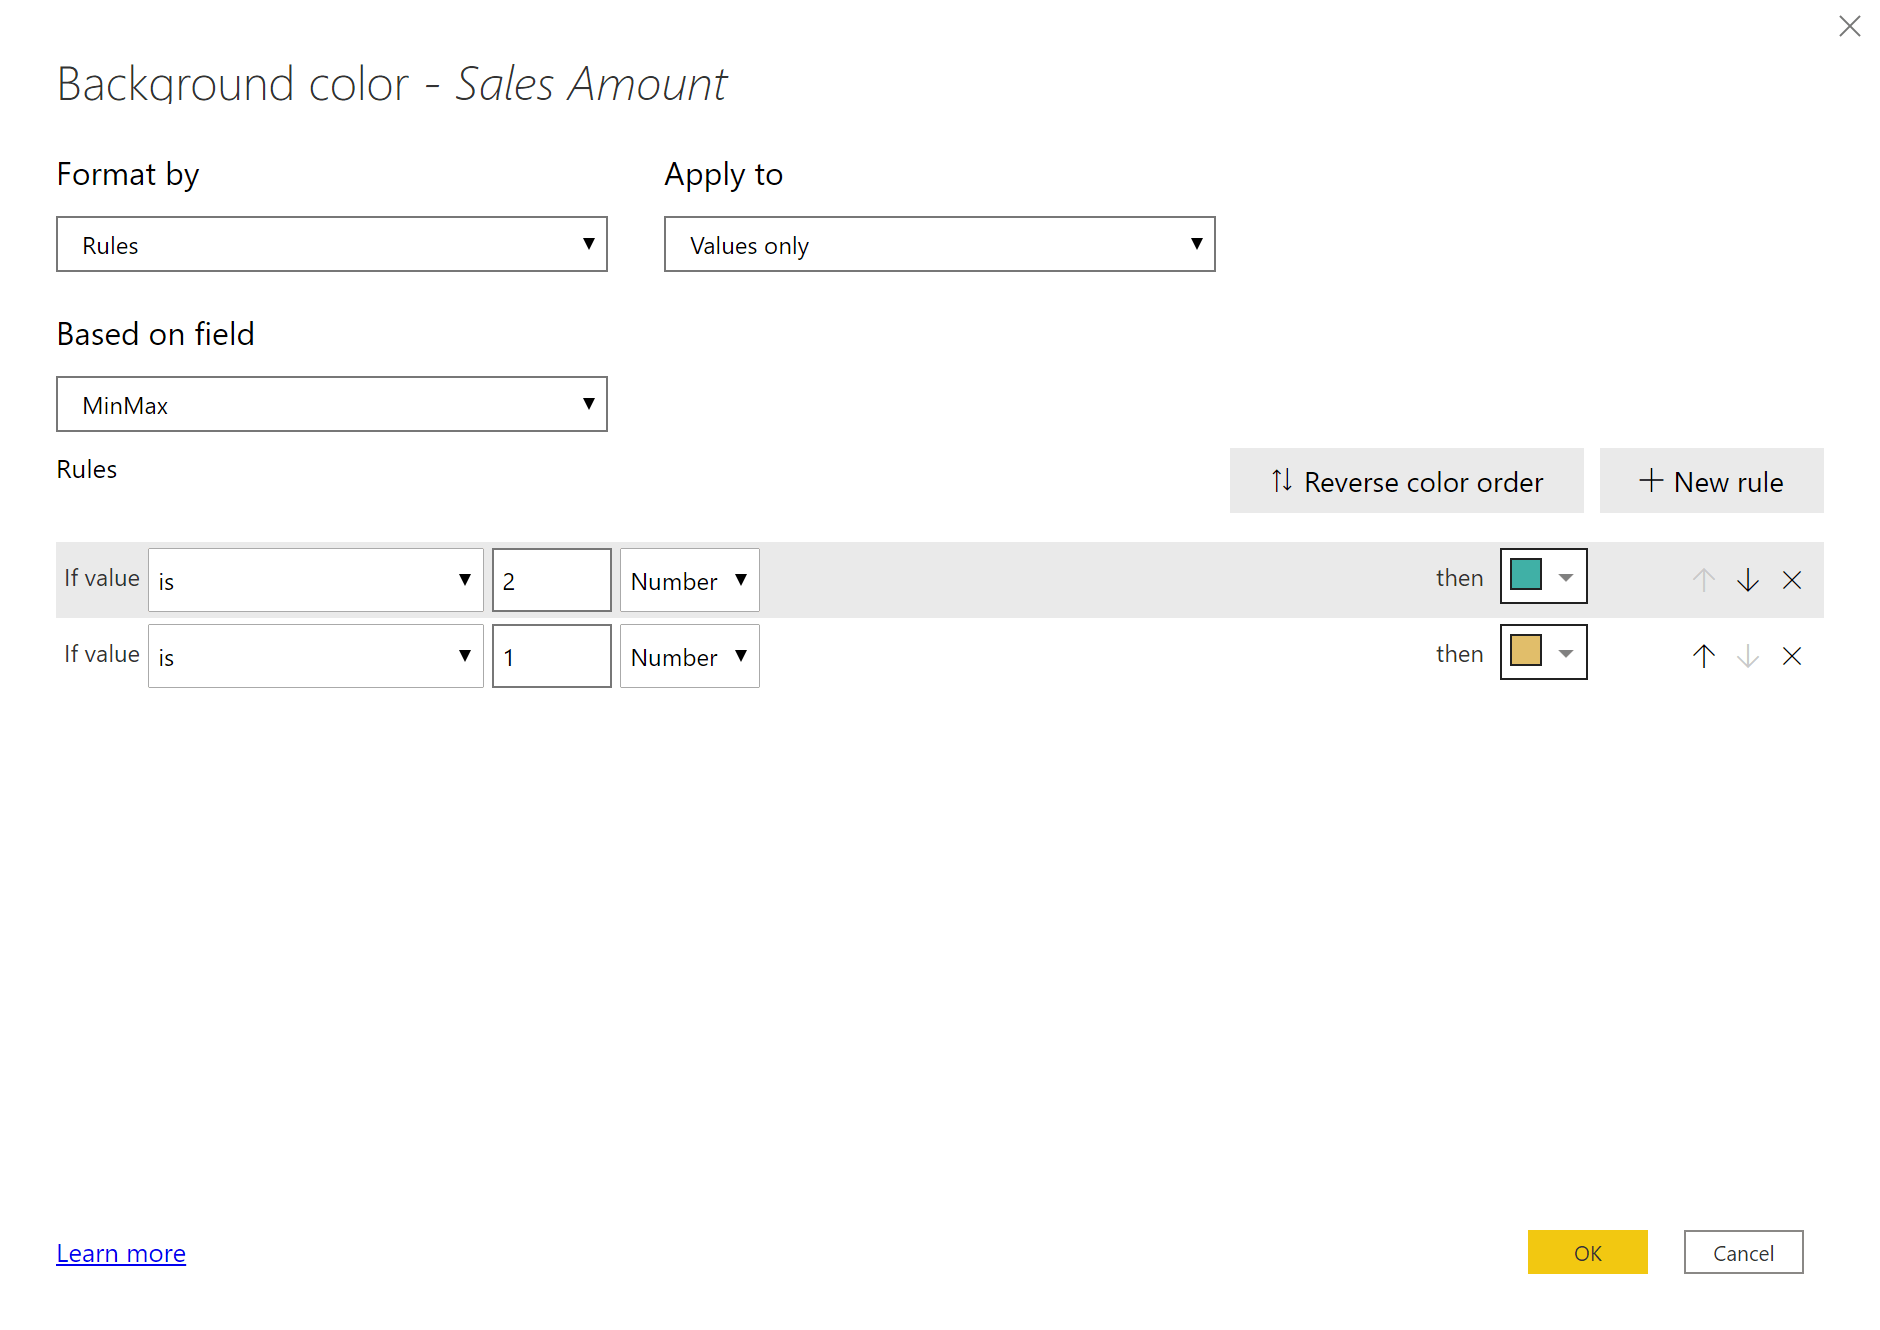
By using this configuration, we obtain the desired result.
We used this technique to highlight the minimum and maximum values in the matrix. In other reports, you can use the same approach to highlight cells based on different business rules. For example, you can highlight the presence of large transactions in the underlying data even though the report only shows aggregated values, or you can highlight a difference with a reference value that goes beyond a predefined threshold.
Because the measure must internally rebuild the exact values shown in the matrix, the measure used for the conditional formatting strongly depends on the matrix where it is being used. For example, if a user removes the Continent attribute from the columns and replaces it with the Year attribute, then the custom formatting rule stops working or could return unexpected results.
As you can see, simple measures like MinMax can make a significant difference in the usability of a report. Therefore, they are the perfect candidate for report measures, built in a specific report for the sole purpose of improving the consumption user experience.
UPDATE 2022-07-25: a very popular question is how to display MIN/MAX by continent. The key is to manipulate the line 8 in the MinMax measure, manipulating ALLSELECTED so that you include in ALLSELECTED the tables/columns you want to remove from the filter context. For example, use ALLSELECTED ( ‘Product’ ) if you want to get the min/max by Continent (or any other attribute of the Customer table), or use ALLSELECTED ( ‘Customer’ ) if you want to get the min/max by any selection of Product.
Returns all the rows in a table, or all the values in a column, ignoring any filters that might have been applied inside the query, but keeping filters that come from outside.
ALLSELECTED ( [<TableNameOrColumnName>] [, <ColumnName> [, <ColumnName> [, … ] ] ] )