 Marco Russo & Alberto Ferrari
The first paragraph needs to be a warning: this article is for DAX and Power BI enthusiasts only. We are going to show a report that does not work. We will then explore how to fix the problem by performing a deep analysis of the queries generated by Power BI, finding the problem, and finally fixing it. The article contains a lot of references to advanced DAX concepts and the final solution is NOT a best practice. The value of the article is not in the specific solution exposed. Rather, the important part is that a deep understanding of DAX and Power BI can help you obtain the right results. This is especially true when you have the feeling that you are faced with a bug because Power BI is acting strange. If you do not like DAX before reading this article, you will like it even less at the end. But if you love DAX, then chances are you will really enjoy this read although it requires quite a lot of brain bandwidth. For sure, it took all of mine when I first encountered this behavior.
The scenario
If the previous paragraphs has not scared you off, here we go. To showcase the problem, we need to perform several preparation steps. Let us start with the model, which is a simple star schema with three tables only.
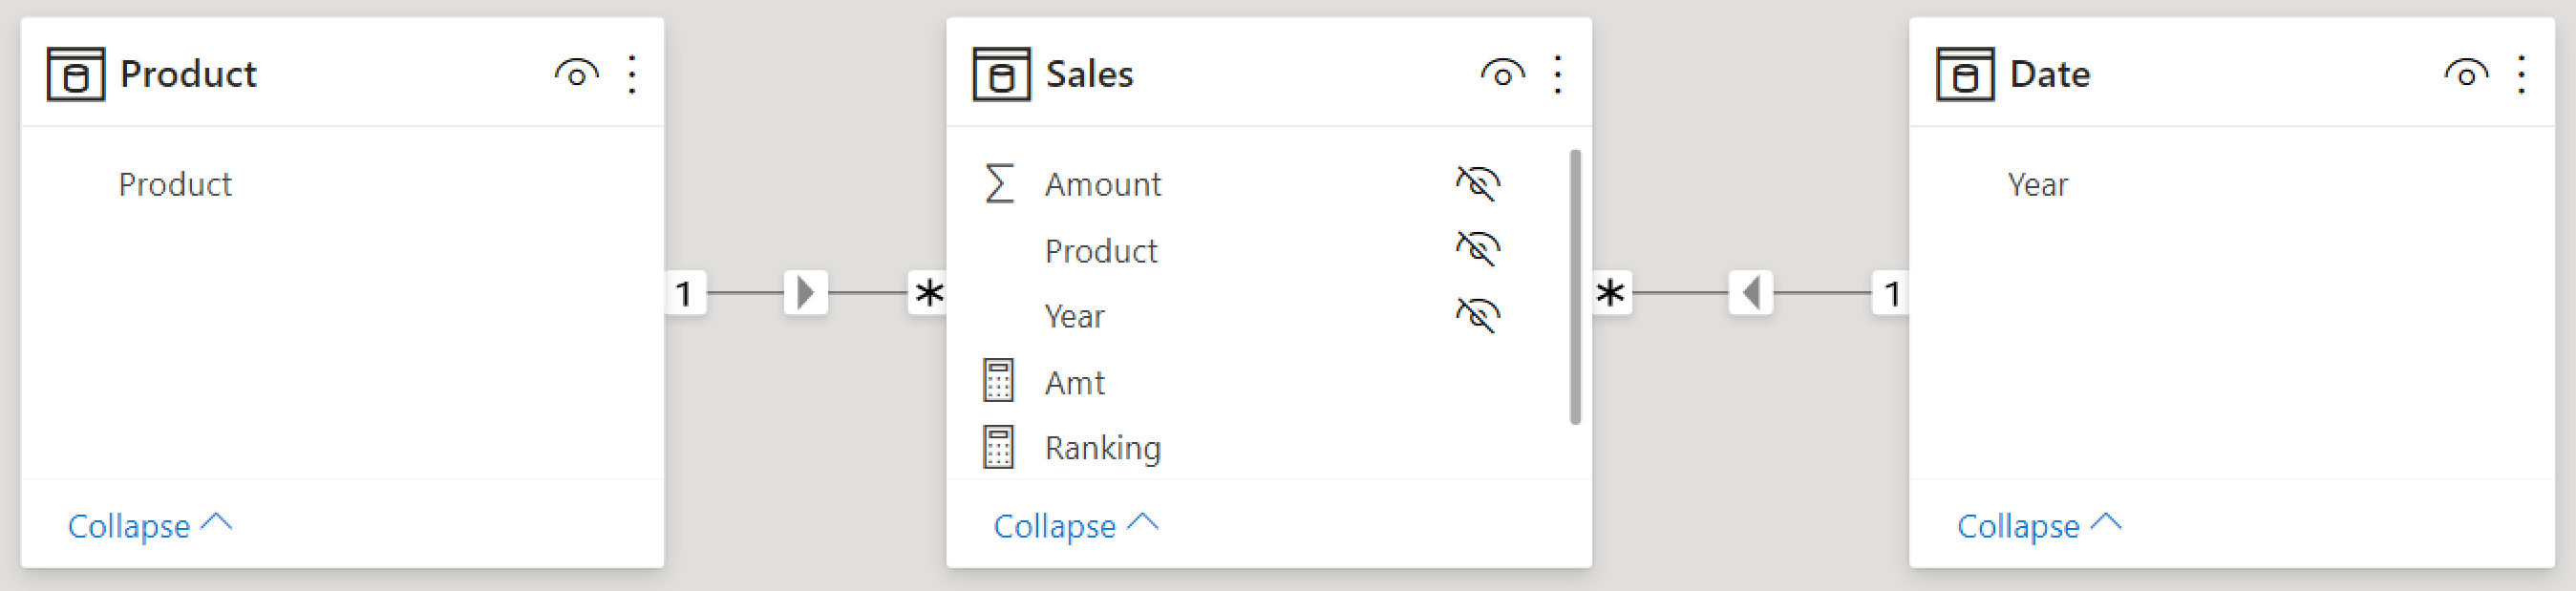
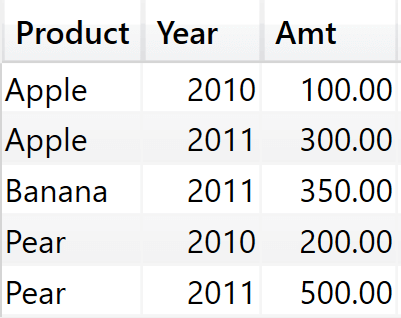
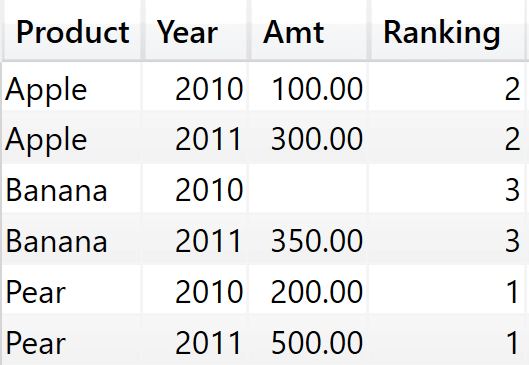
The model is not based on our usual Contoso database. We use a highly simplified model with just a few rows and different fruit as products. Moreover, the Date table contains only the Year column, again for the sake of simplicity. The full content of the Sales table is synthetized in the following matrix.
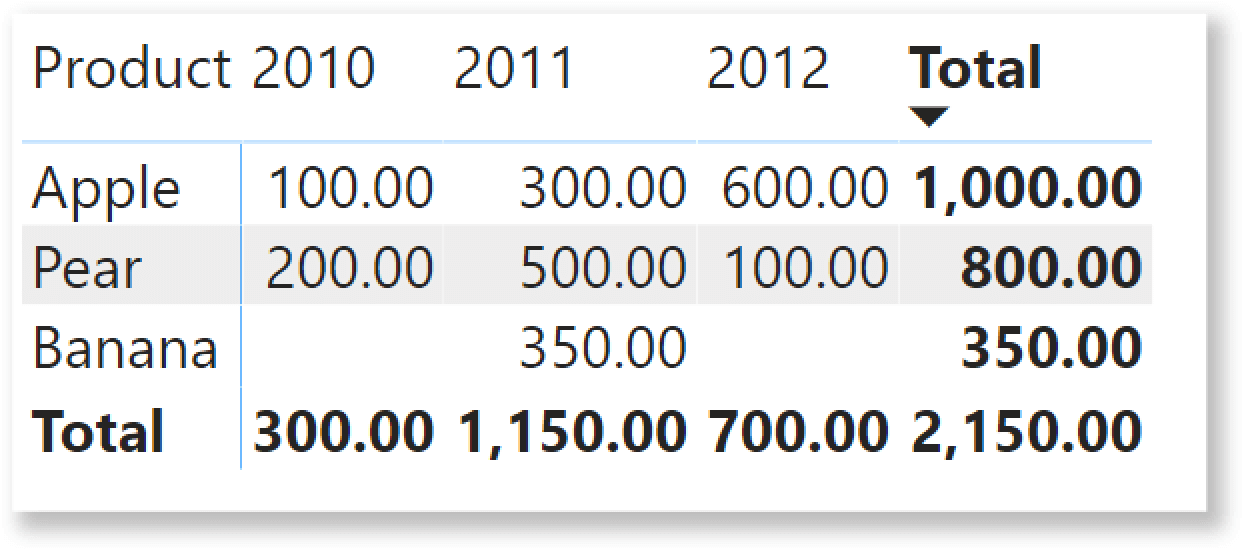
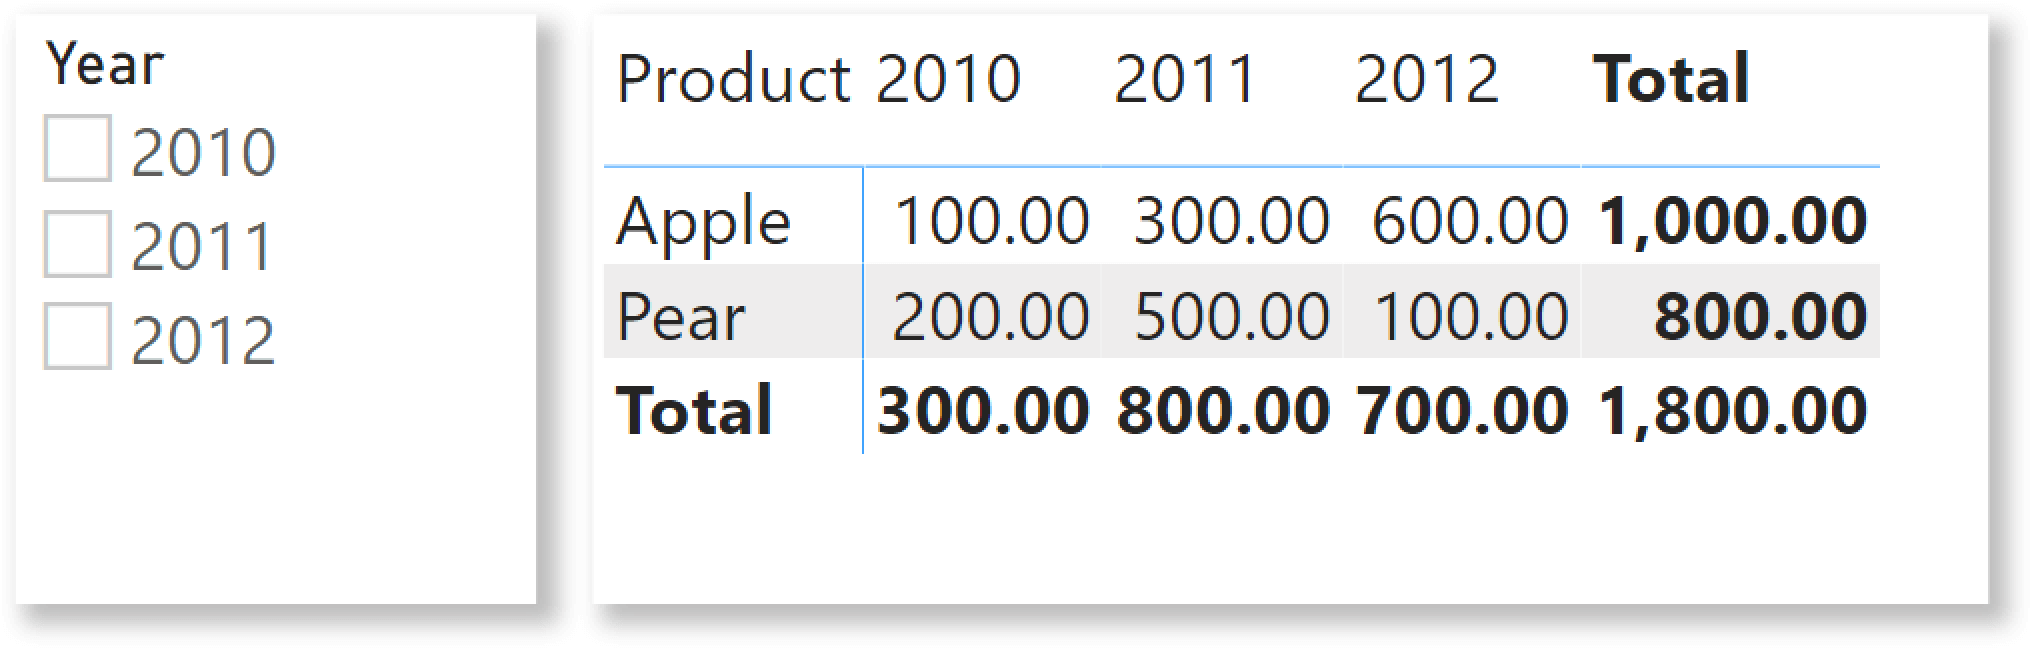
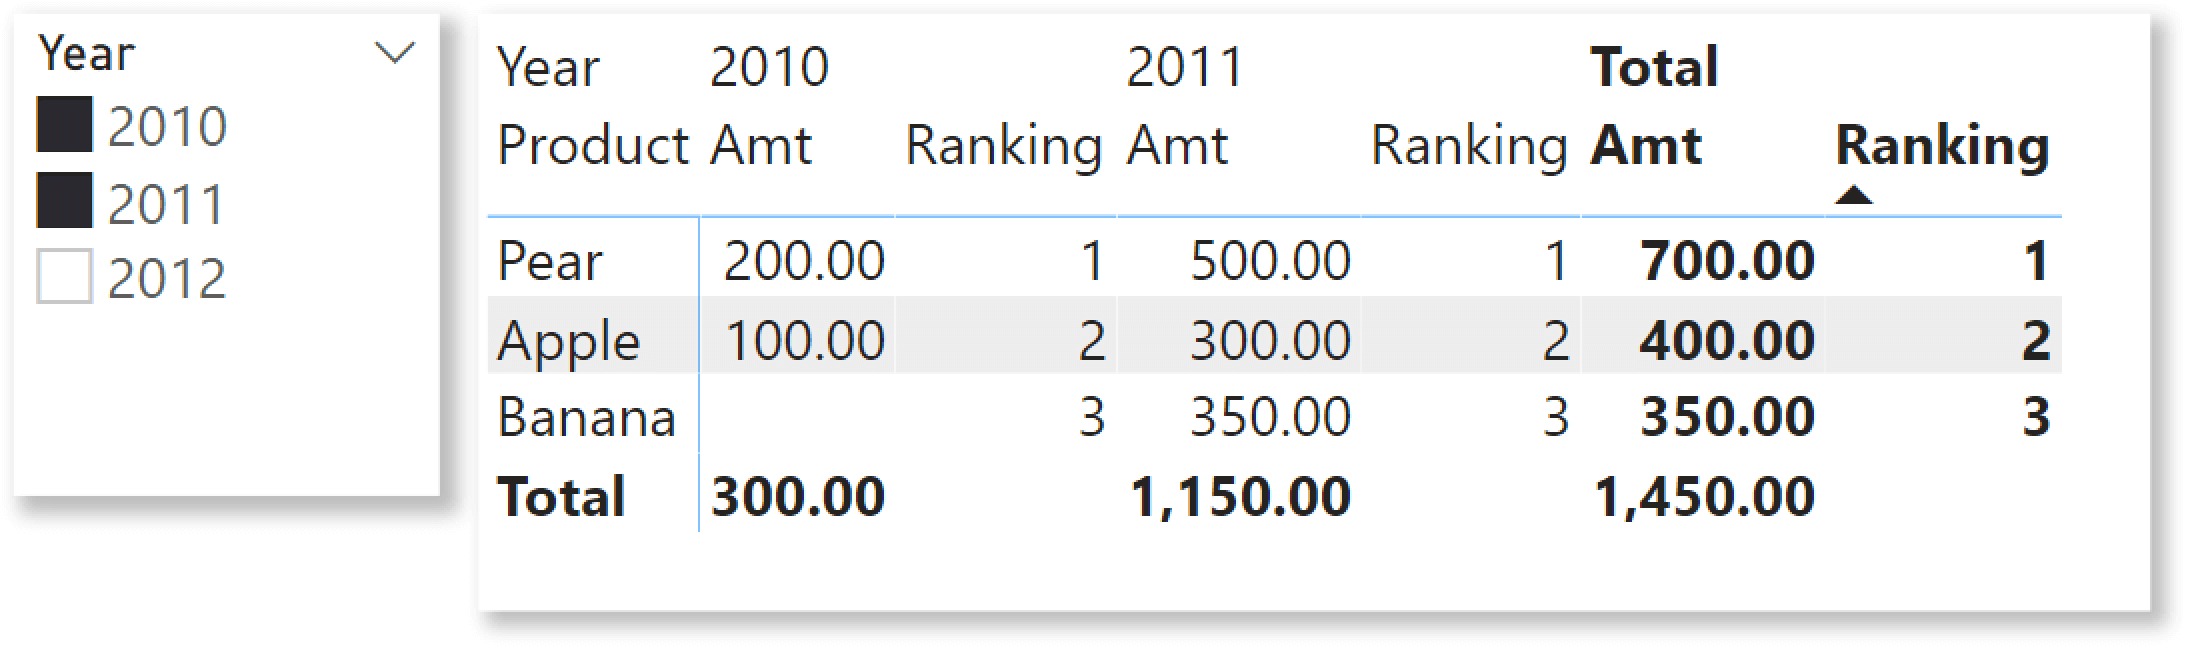
Now, the business requirement. Based on this data, we want to create a report that shows the top 2 products over a user-defined period of time, along with their monthly sales. As you can see, Apple and Pear are the all-time bestsellers, with 1,000.00 and 800.00 respectively. Hence, the report should look like the following picture.
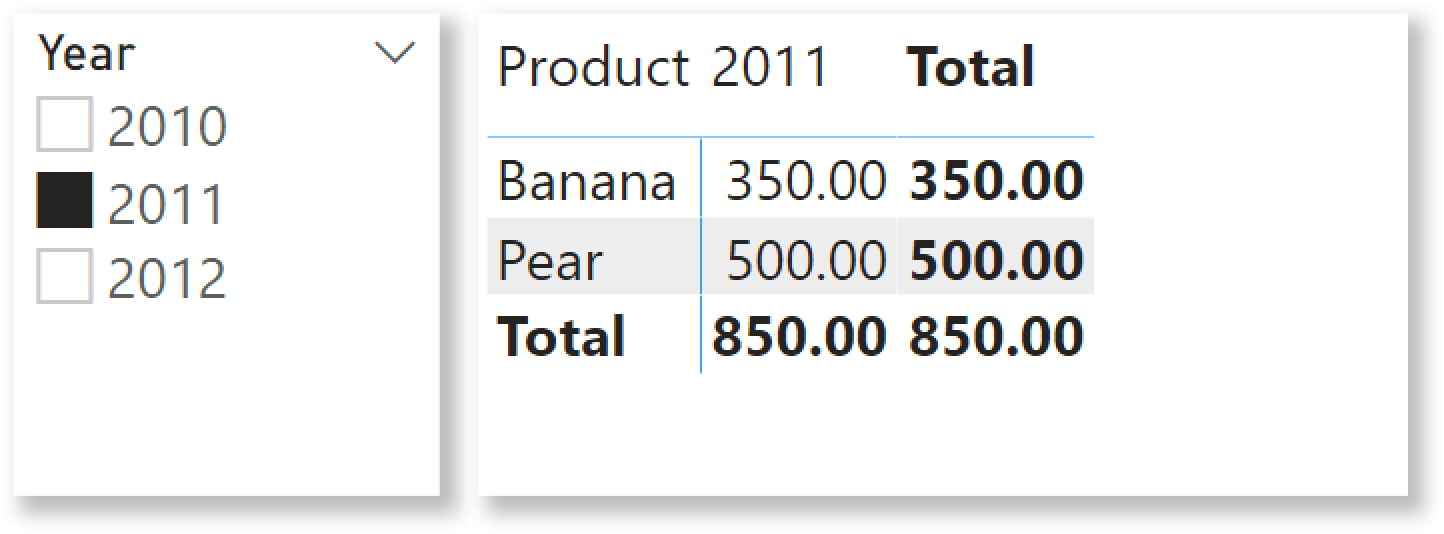
If a user selects 2011 for example, then the best sellers during 2011 are Banana and Pear. Therefore, the report needs to change the filtering dynamically and show the result we see below.
The code to author is a simplified version of the more complete solution we provided here: Filtering the top products alongside the other products in Power BI – SQLBI. If you want to understand more about the specific technique, you will find a more complete description in that article. Here, we just quickly describe the steps, because we are interested in the matter of using a measure as a filter.
We need a Ranking measure, to compute the ranking of the individual product over the selected period:
Ranking =
IF (
    HASONEVALUE ( 'Product'[Product] ),
    VAR Prods =
        ALLSELECTED ( 'Product'[Product] )
    VAR Result =
        RANKX ( Prods, CALCULATE ( [Amt], ALLSELECTED ( 'Date' ) ) )
    RETURN
        Result
)
Once placed in a matrix, the Ranking measure shows the same ranking for each year. This is because ALLSELECTED takes care of removing the filter on the Year that is present in the columns. For this example, we select two years (2010 and 2011).
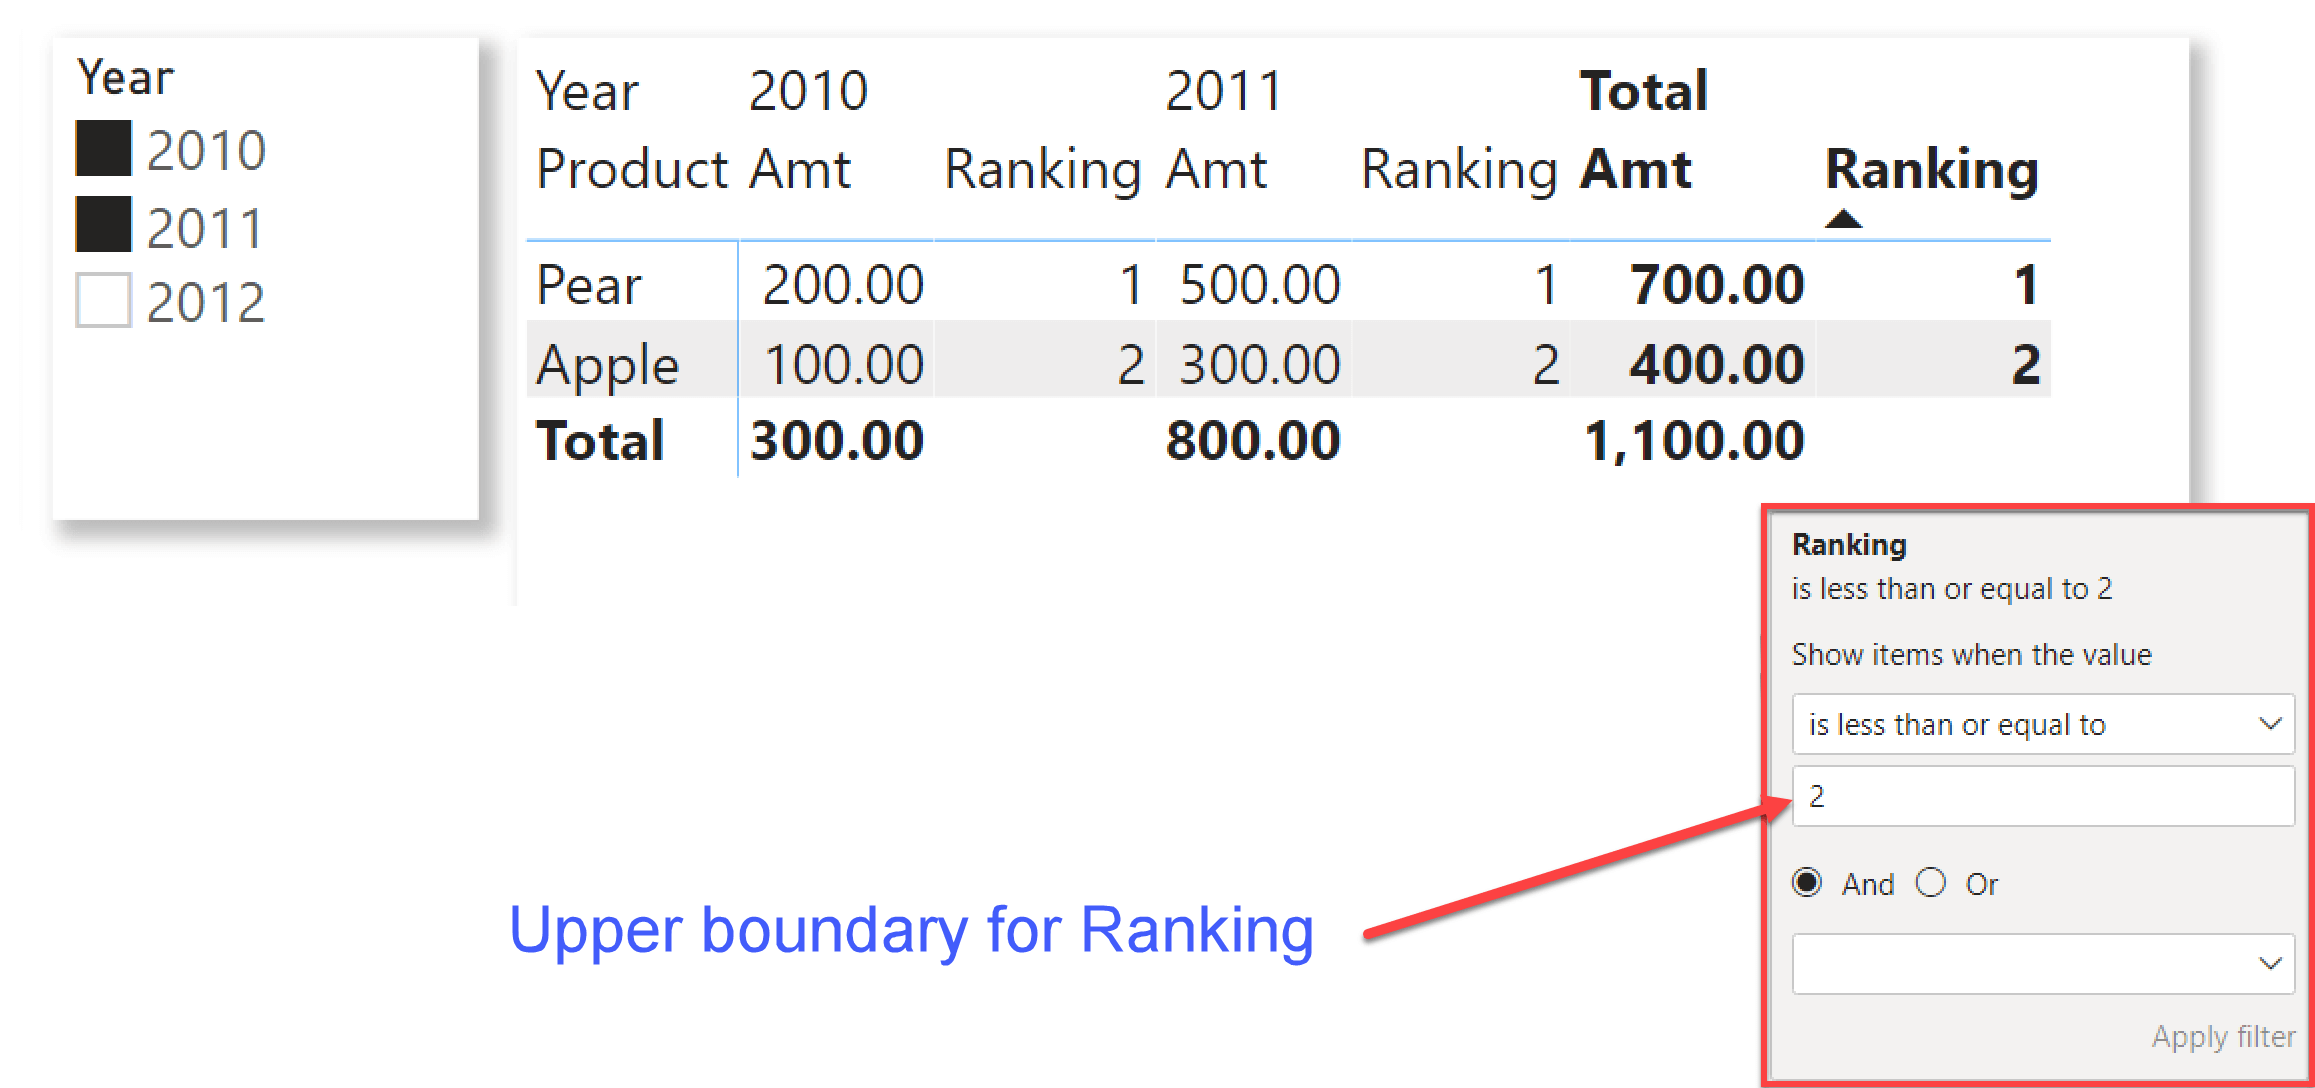
Then, to show the top 2 products it is enough to add a visual filter for the Ranking measure so that it shows only the rows where Ranking is less than or equal to 2. As a consequence, the matrix shows only Apple and Pear, making Banana disappear.
The problem and the investigation
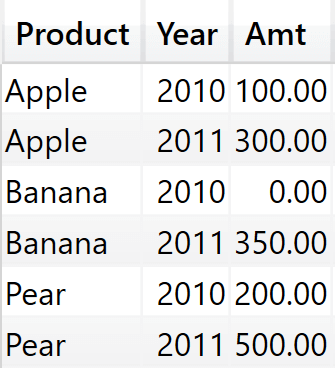
The last step is to remove the Ranking measure from the visual. Here is where the problem suddenly appears. Indeed, just removing the Ranking measure from the values produces three rows instead of the previous two.
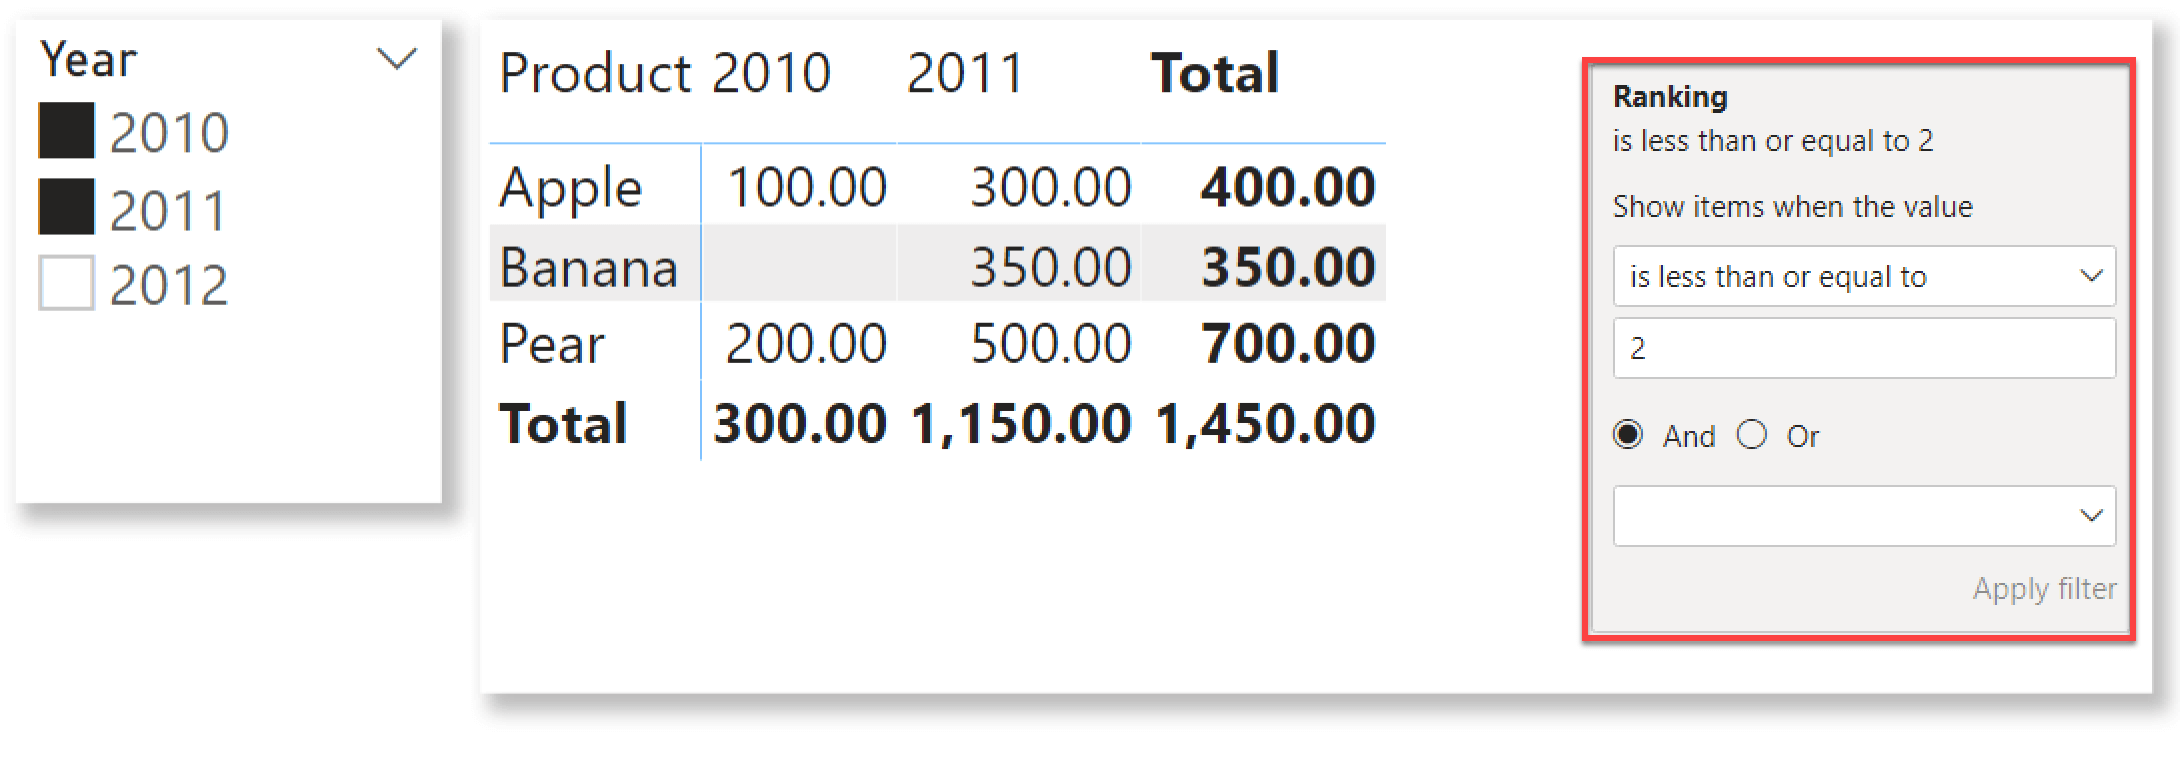
Banana was not part of the report; yet it suddenly appeared as soon as we removed the Ranking measure. This very long introduction was needed to reach exactly this point. Indeed, the core of the article is to understand why Banana appeared out of nowhere, and why the report works when Ranking is part of the matrix but stops working as soon as we remove it.
As we have seen in a previous screenshot, Ranking returns three for Banana. Therefore, the row should disappear due to the filter. You cannot check the value of Ranking directly in this report, because as soon as you add the Ranking measure the report starts working again.
The thing is: using the Filter pane and filtering a measure that belongs to the values of the visual is different from filtering a measure that does not belong to the values of the visual. In order to understand the difference, we need to investigate further by examining the query executed by Power BI for this latter report.
The code for the matrix is quite long and not worth studying in detail. If you are interested, you can use Performance Analyzer to study it. Here we just reproduce the first few lines, which are interesting for our investigation:
DEFINE
    VAR __DS0FilterTable =
        TREATAS ( { 2010, 2011 }, 'Date'[Year] )
    VAR __ValueFilterConstraintDM1 =
        SUMMARIZECOLUMNS (
            'Product'[Product],
            'Date'[Year],
            __DS0FilterTable,
            "Amt", 'Sales'[Amt]
        )
    VAR __ValueFilterDM1 =
        FILTER (
            KEEPFILTERS (
                SUMMARIZECOLUMNS (
                    'Product'[Product],
                    __DS0FilterTable,
                    __ValueFilterConstraintDM1,
                    "Ranking", IGNORE ( 'Sales'[Ranking] )
                )
            ),
            [Ranking] <= 2
        )

    . . . . .
ValueFilterDM1 is a variable that is later used in the query to filter only the rows whose Ranking is less than or equal to two. ValueFilterDM1 executes SUMMARIZECOLUMNS while using the previous variable (ValueFilterConstraintDM1) as a filter argument. ValueFilterConstraintDM1 summarizes by Product[Product] and Date[Year], and also computes the Amt measure. The purpose of ValueFilterConstraintDM1 is to retrieve the combinations of products and years that produce a value. By using it as a filter, DAX will reduce the work required to compute ValueFilterDM1 by computing the Ranking measure for only the rows that are actually needed.
The content of ValueFilterConstraintDM1 is the following.
As you see, it contains the combinations of Product and Year that produce a value for Amt. The problem is that this table is used later as a filter argument in the evaluation of ValueFilterDM1. Later on, ValueFilterDM1 will be used to filter all further calculations.
ValueFilterDM1 executes SUMMARIZECOLUMNS by Product and it uses two filters: DS0FilterTable and ValueFilterConstraintDM1. DS0FilterTable is the filter generated by the slicer that contains the two years: 2010 and 2011. ValueFilterConstraintDM1 is the table in the previous figure. It is important to note at this point that both tables include the Date[Year] column.
During the evaluation of ValueFilterDM1, DAX computes the Ranking measure. It is worth repeating here the code of Ranking:
Ranking =
IF (
    HASONEVALUE ( 'Product'[Product] ),
    VAR Prods =
        ALLSELECTED ( 'Product'[Product] )
    VAR Result =
        RANKX ( Prods, CALCULATE ( [Amt], ALLSELECTED ( 'Date' ) ) )
    RETURN
        Result
)
Inside RANKX, Result is computed by invoking CALCULATE with ALLSELECTED with Date. When ALLSELECTED is executed from inside SUMMARIZECOLUMNS, DAX removes any filter from the groupby columns and it restores the original filter. The groupby column list includes only Product[Product], and we are using ALLSELECTED on Date. Therefore, there are no filters to remove: DAX only needs to restore the filter on Date.
Here is the caveat: When Banana is evaluated, the filter on the year results from the intersection of the years visible in ValueFilterConstraintDM1 and the years visible in DS0FilterTable. DS0FilterTable contains both 2010 and 2011 but ValueFilterConstraintDM1 contains only 2011 for Banana. Therefore, when the Ranking of Banana is evaluated it is evaluated for only 2011. As a matter of fact, looking only at 2011 Banana is ranked two. With a ranking of two, Banana survives the filter and it is shown in the matrix.
There is still an interesting question to answer: why was the behavior different when Ranking was part of the matrix? When Ranking is part of the matrix, the Ranking measure is included in the calculation of ValueFilterConstraintDM1:
DEFINE
    VAR __DS0FilterTable =
        TREATAS ( { 2010, 2011 }, 'Date'[Year] )
    VAR __ValueFilterConstraintDM1 =
        SUMMARIZECOLUMNS (
            'Product'[Product],
            'Date'[Year],
            __DS0FilterTable,
            "Amt", 'Sales'[Amt],
            "Ranking", 'Sales'[Ranking]
        )

    . . . . .
Indeed, the goal of ValueFilterConstraintDM1 is to define which rows contain a value that could be shown in the visual. If Ranking is part of the values, it is used in the definition. Because there is a value for the ranking in all the years, the result of ValueFilterConstraintDM1 in this scenario is what we see in the following figure.
As you can see, in this scenario Banana appears in both 2010 and 2011. Therefore, when its ranking is computed it will be computed for both years, returning the correct value of 3.
The solution
Now that we have a clear picture of the problem, we need to solve it. There are multiple ways to tackle this issue, but unfortunately none of them are clean and generic enough to be considered a best practice. If you ever face this issue, you will need to perform a deeper study of the measures involved in the report and decide accordingly. For example, you can avoid the problem by replacing ALLSELECTED with a REMOVEFILTERS in the definition of Ranking. This avoids the problem of calculating an inaccurate ranking. Nonetheless, when using REMOVEFILTERS you do not create a truly dynamic measure. Indeed, by using REMOVEFILTERS you would always be using a ranking based on all time. As simple as it is, this solution is not meeting the business requirements.
Remember that the goal is to force ValueFilterConstraintDM1 to include all the selected years for any product. This can be accomplished by guaranteeing that the non-existing combination (Banana, 2010) is included in the result. To obtain this goal we can force Amt to be non-blank even if there are no sales for Bananas in a specific year. By adding 0 to change the definition of Amt, we transform BLANK into zero for Amt which produces a result even when there are no sales:
Amt = SUM ( Sales[Amount] ) + 0
This simple change turns the content of ValueFilterConstraintDM1 into what we see below.
Amt is no longer a blank, since it is now zero. So the combination (Banana, 2010) appears in ValueFilterConstraintDM1 and the next ranking will be computed correctly.
The price to pay is that the engine evaluates the Ranking measure for more cells – the optimization introduced by ValueFilterConstraintDM1 somewhat vanishes in this case. Moreover, the effect on the report is that the matrix will show a zero instead of a blank for Amt.
Another possible solution is to just add the Ranking measure to the values of the matrix, and to reduce the width of the column containing Ranking to zero in order to effectively hide it. This lets you show the correct results, at the cost of additional formatting of the matrix.
Conclusions
Power BI generates quite complex DAX queries to produce the required results. Because of the optimized code generated, measures used only in filters behave in a different way than measures used both as filters and as values. When a measure is used only as a filter, depending on your data distribution and on the user selection you might end up computing inaccurate results. This does not happen often: you need a rather unique combination of columns in the visual, you need to use ALLSELECTED in the measure and the measure needs to be used as a filter only.
Nonetheless, there might be other scenarios where a similar behavior occurs. By deepening your understanding of DAX, up to the point that you can smoothly investigate the queries generated by Power BI, you can find workarounds for borderline scenarios like this one.
Returns all the rows in a table, or all the values in a column, ignoring any filters that might have been applied inside the query, but keeping filters that come from outside.
ALLSELECTED ( [<TableNameOrColumnName>] [, <ColumnName> [, <ColumnName> [, … ] ] ] )
Create a summary table for the requested totals over set of groups.
SUMMARIZECOLUMNS ( [<GroupBy_ColumnName> [, [<FilterTable>] [, [<Name>] [, [<Expression>] [, <GroupBy_ColumnName> [, [<FilterTable>] [, [<Name>] [, [<Expression>] [, … ] ] ] ] ] ] ] ] ] )
Returns the rank of an expression evaluated in the current context in the list of values for the expression evaluated for each row in the specified table.
RANKX ( <Table>, <Expression> [, <Value>] [, <Order>] [, <Ties>] )
Evaluates an expression in a context modified by filters.
CALCULATE ( <Expression> [, <Filter> [, <Filter> [, … ] ] ] )
Clear filters from the specified tables or columns.
REMOVEFILTERS ( [<TableNameOrColumnName>] [, <ColumnName> [, <ColumnName> [, … ] ] ] )
Returns a blank.
BLANK ( )