When you double-click on a cell in an Excel PivotTable, you invoke the drillthrough feature of the PivotTable which shows the underlying data for that particular cell. This feature was initially designed for Multidimensional databases in Analysis Services. In a Multidimensional model, it is also possible to add different drillthrough actions that can be activated through the context menu in Excel. While the customization of actions is not feasible for a Tabular model, the drillthrough feature is active by default. It returns all the rows visible through the filter context in the table that includes the measure definition. In many scenarios, this default behavior does not provide a result consistent with the data computed in the result that you see visible. Through the Detail Rows Expression property of a measure in the Tabular model, you can customize the drillthrough behavior in Excel, thus controlling the rows and columns returned to the user.
This article explains how to use the Detail Rows Expression property to customize the Excel drillthrough behavior for a PivotTable connected to a Power BI dataset or an Analysis Services database – they can be identified as Tabular models in the remaining part of this article. We will explain how the drillthrough action works in Excel; then, we will see how to customize the Detail Rows Expression property to control columns and rows returned by the drillthrough action. Finally, we will see how to use measures created for the only purpose of returning custom drillthrough results with the list of customers who made certain purchases, or the list of invoices included in a specific aggregation. The flexibility of this feature is second only to the performance achievable returning large tables of data. Indeed, if you create a regular PivotTable with many attributes in the rows section, you obtain slow results because of the high number of aggregation levels defined that way. Because the drillthrough action corresponds to a single DAX query, you can extract detail-level data with good performance and avoid the slow interaction when displaying the same data in a regular PivotTable.
How the drillthrough works in an Excel PivotTable
You can connect an Excel PivotTable to a Power BI dataset or to Analysis Services by using the Data / Get Data ribbon menu item. If you have a recent Excel version within a Microsoft 365 subscription, you can also use the Insert / PivotTable / From Power BI ribbon menu item. However, let us suppose you are using Power BI Desktop and you want to test the Analyze In Excel feature locally without publishing the dataset. In that case, you can install the Analyze In Excel for Power BI Desktop external tool. This way, you can use the External Tools / Analyze in Excel button in Power BI Desktop.

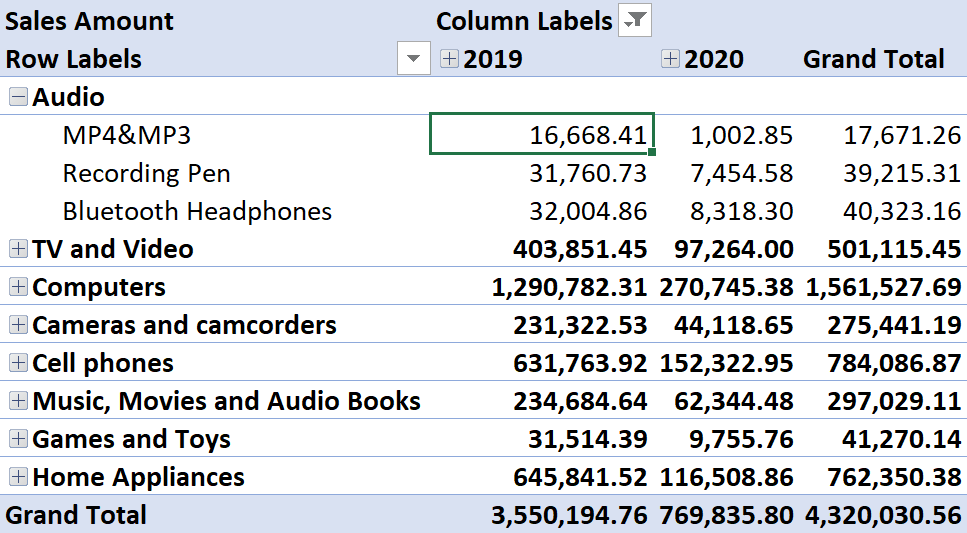
Once you create a PivotTable and populate it with at least one measure, you can double-click on any cell containing a measure result to activate the default drillthrough action in Excel. For example, in the following screenshot, we placed the Category-Subcategory hierarchy from the Product table in the rows, the Year-Month hierarchy from the Date table in the columns, and the Sales Amount measure in the Values area. The highlighted cell corresponds to the following filter context:
- Product[Category] = “Audio”
- Product[Subcategory] = “MP4&MP3”
- Date[Year] = 2019
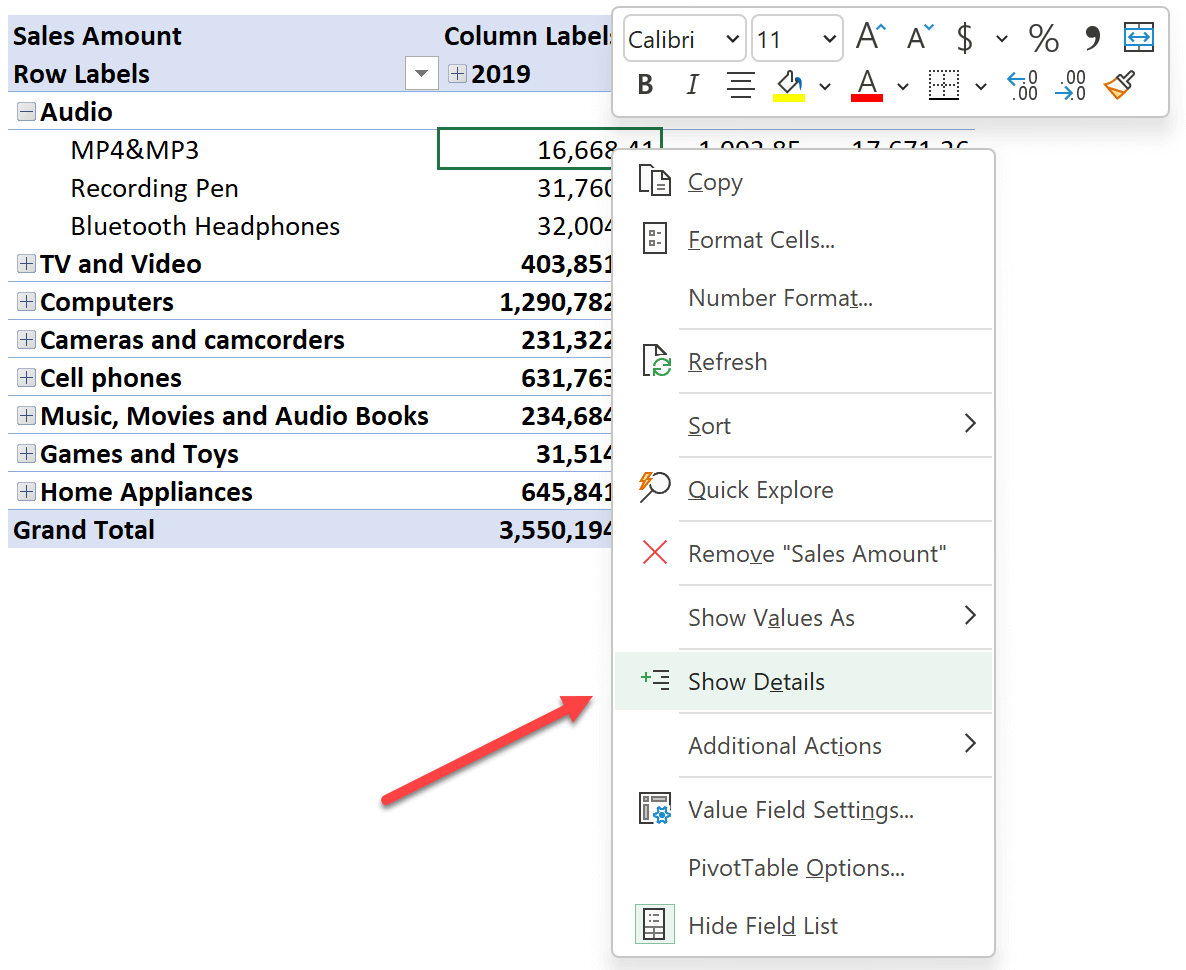
The result of the double-click corresponds to the Show Details context menu item.
The following figure shows the result.
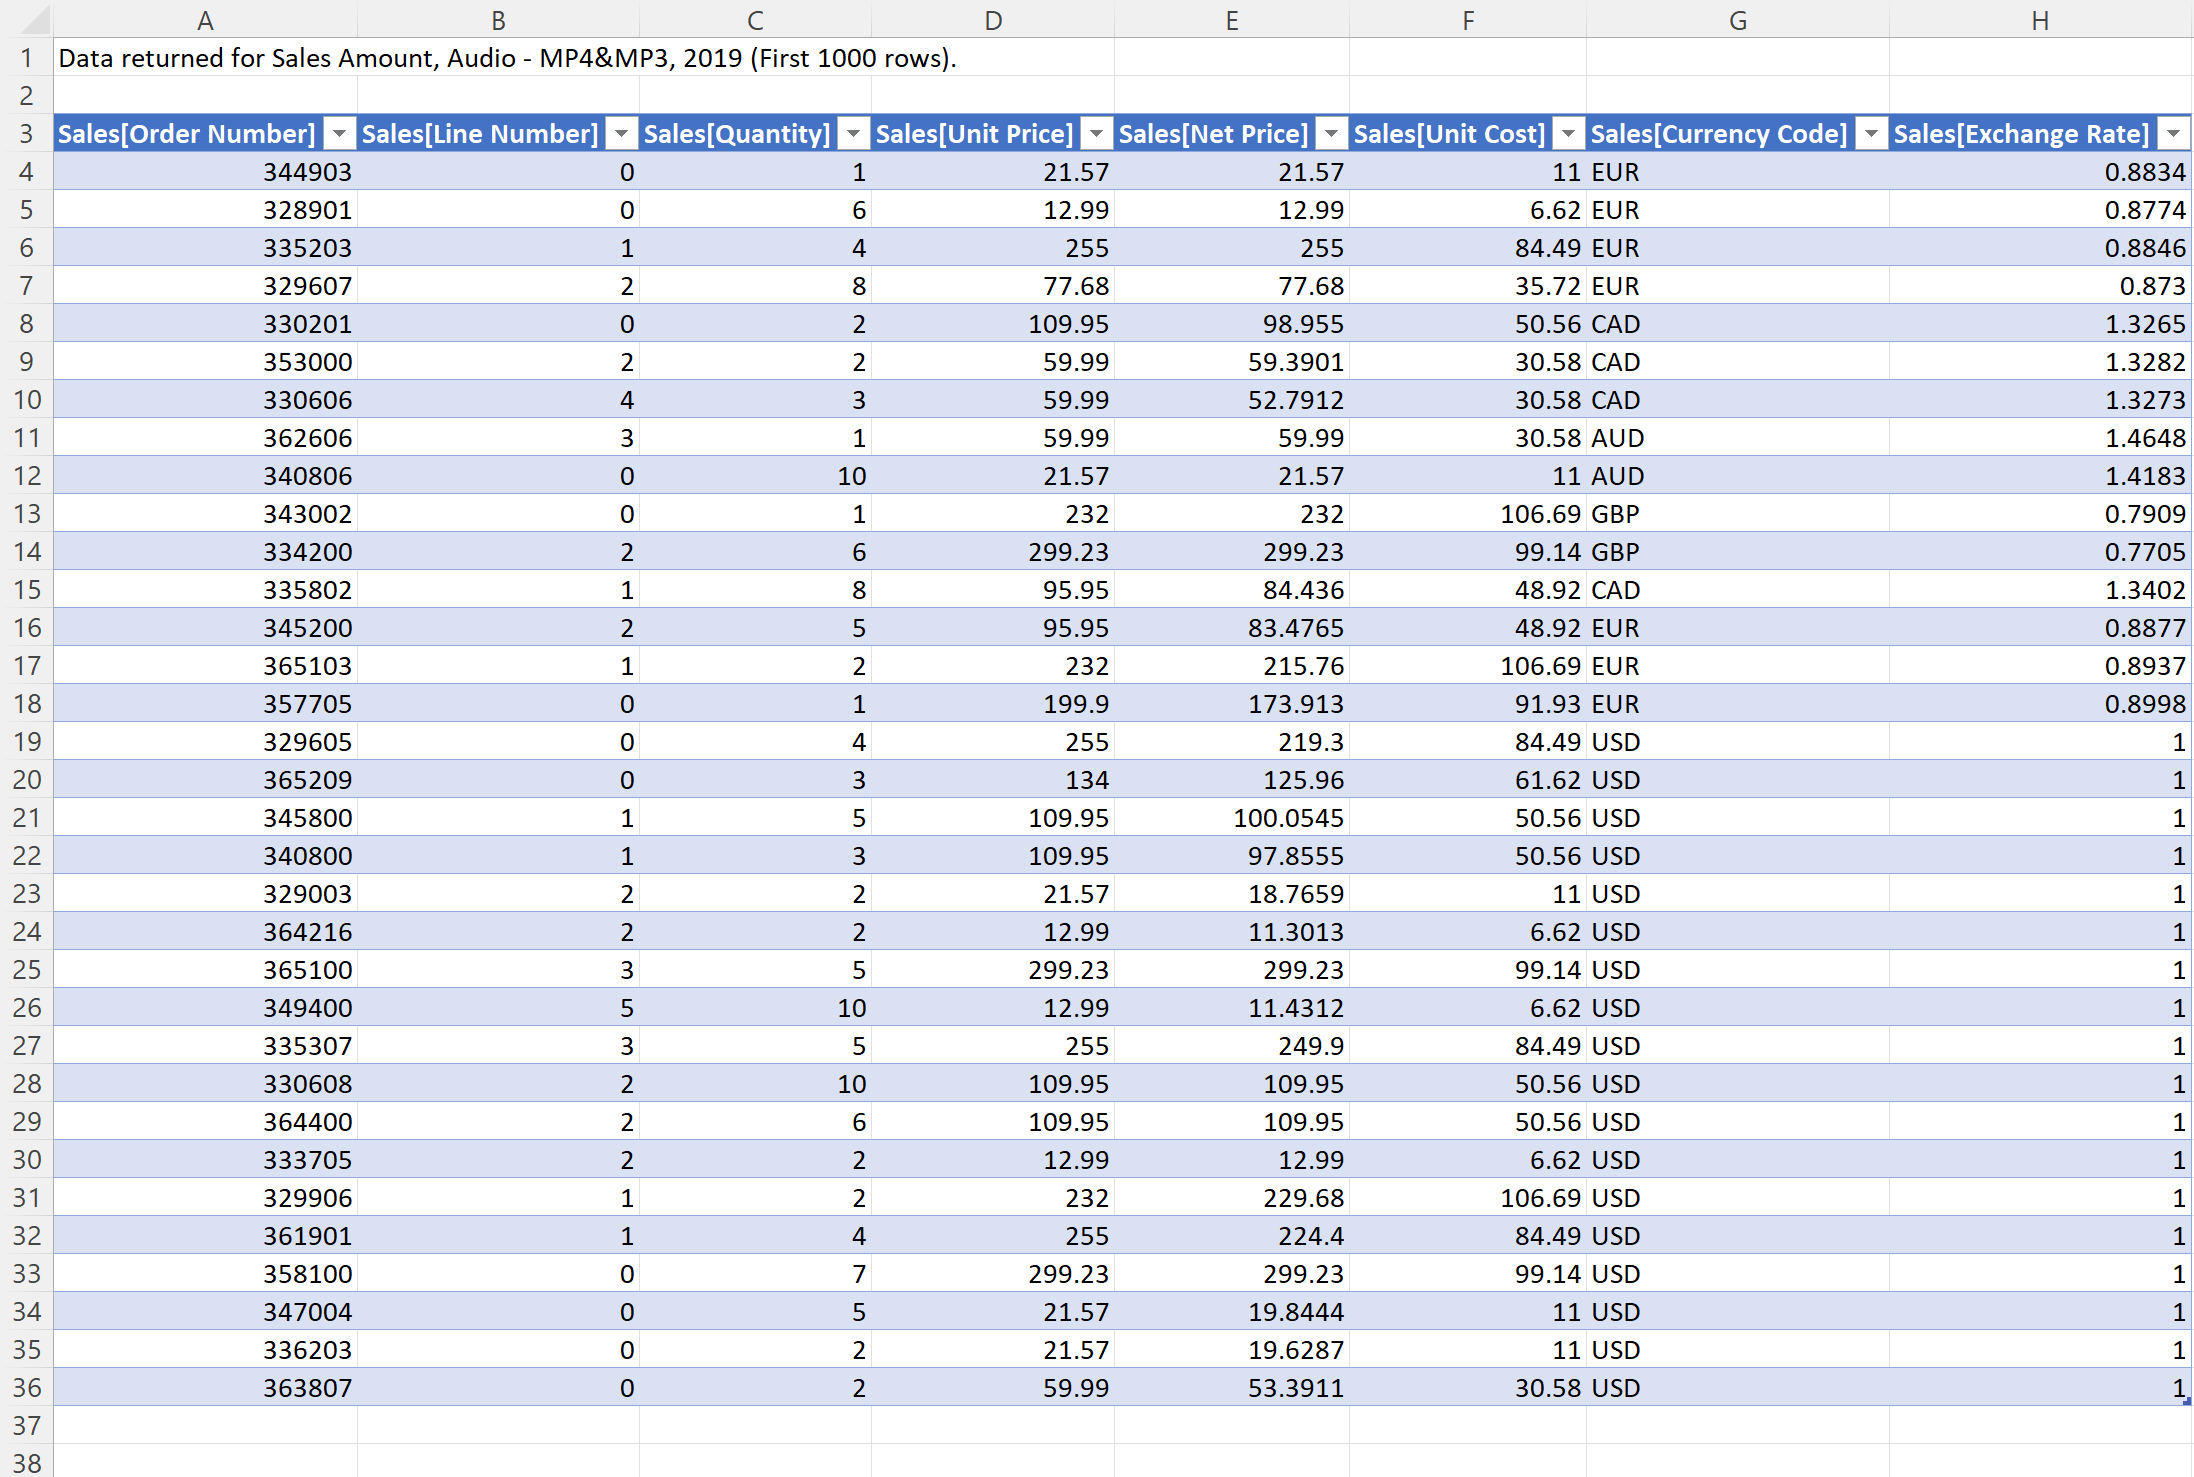
The table created in a new Excel worksheet contains the content of all the columns of the Sales table in the filter context of the cell we selected in the PivotTable (Audio, MP4&MP3, 2019). The result includes rows from the Sales table because the Sales Amount measure is defined in the Sales table. If the Sales Amount measure were defined in a separate table called Calculations, we would have seen the content of the Calculations table in the same filter context. In other words, the default drillthrough action for a measure returns all the columns of the table that the measure definition and all the rows that are visible in the same filter context.
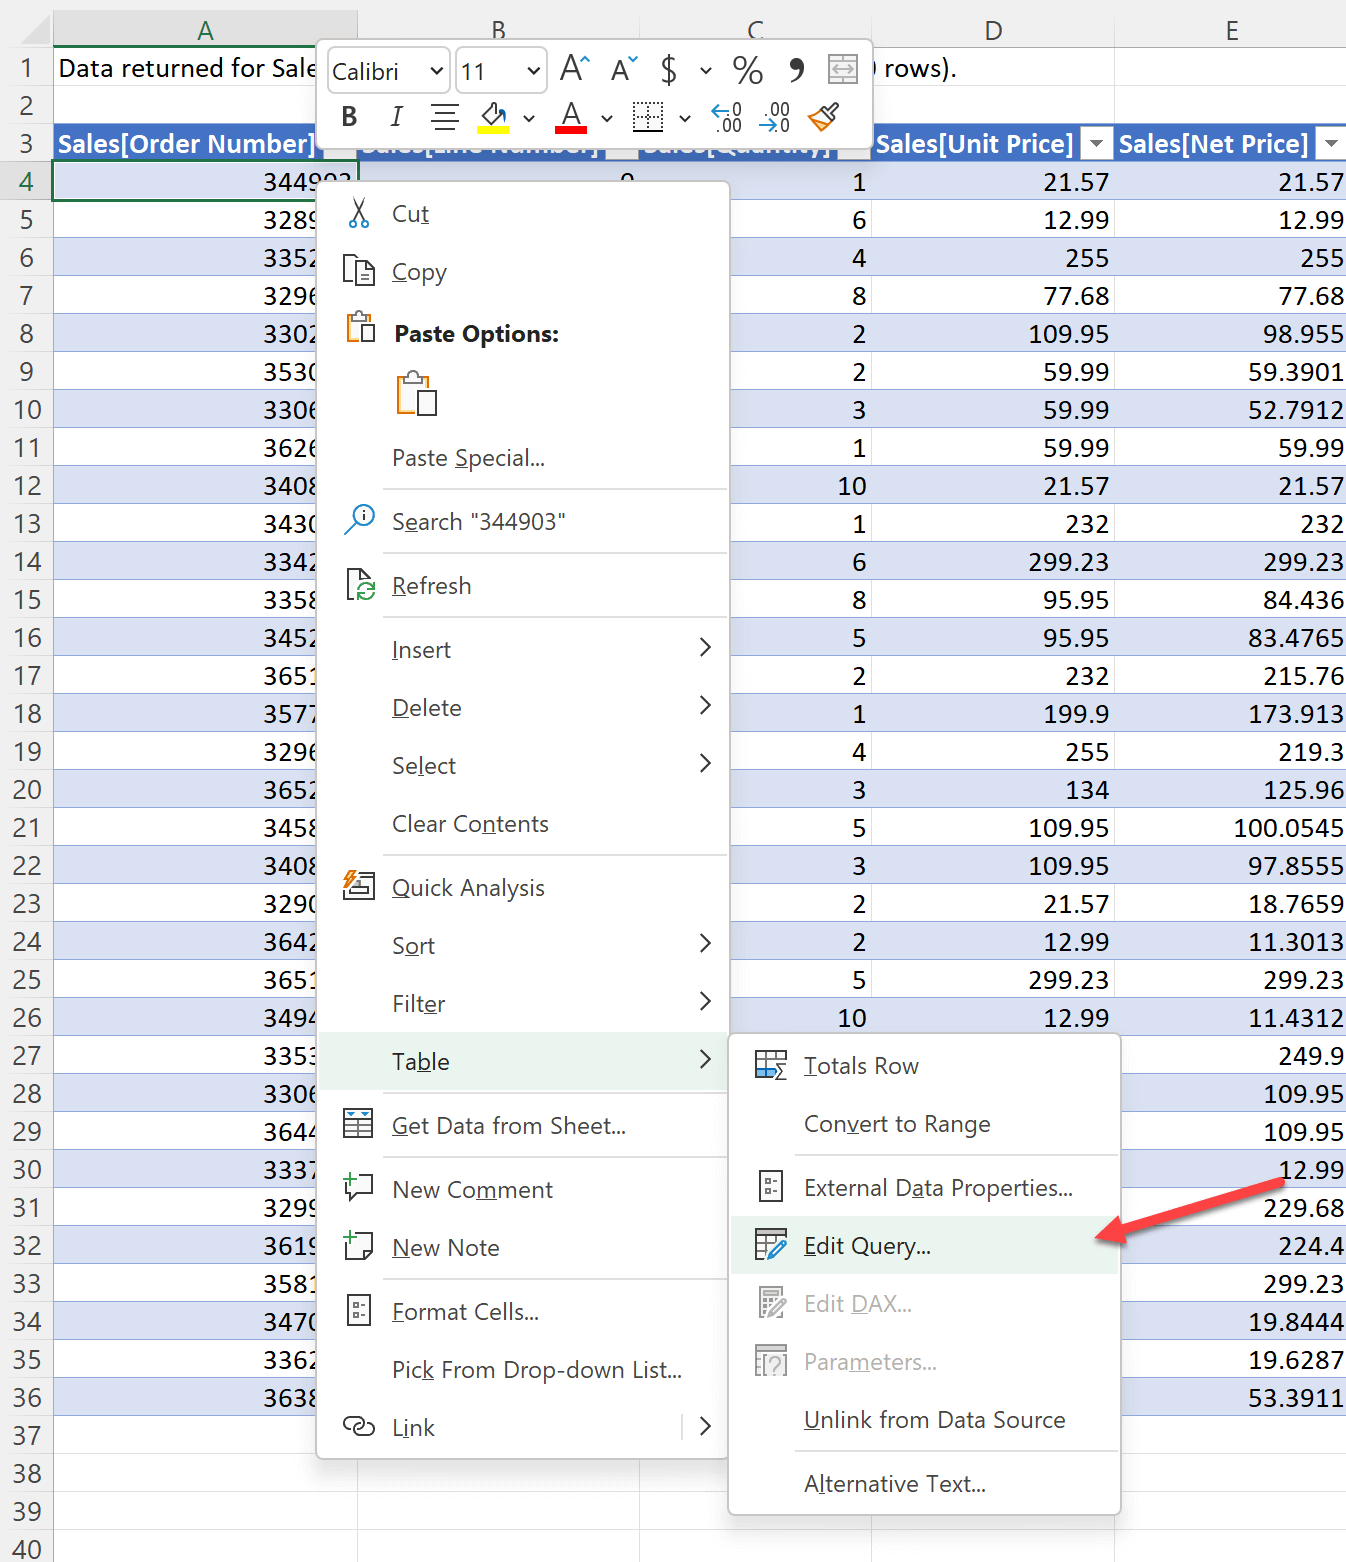
The result obtained in Excel is not a simple table. It results from a query executed on a connection to the data model that the PivotTable is connected to. You can see the connection and the query generated by Excel using the Table / Edit Query… context menu item starting from any cell of the table.
The query is displayed in a dialog box that contains the connection and the command used to retrieve the data to populate the table.
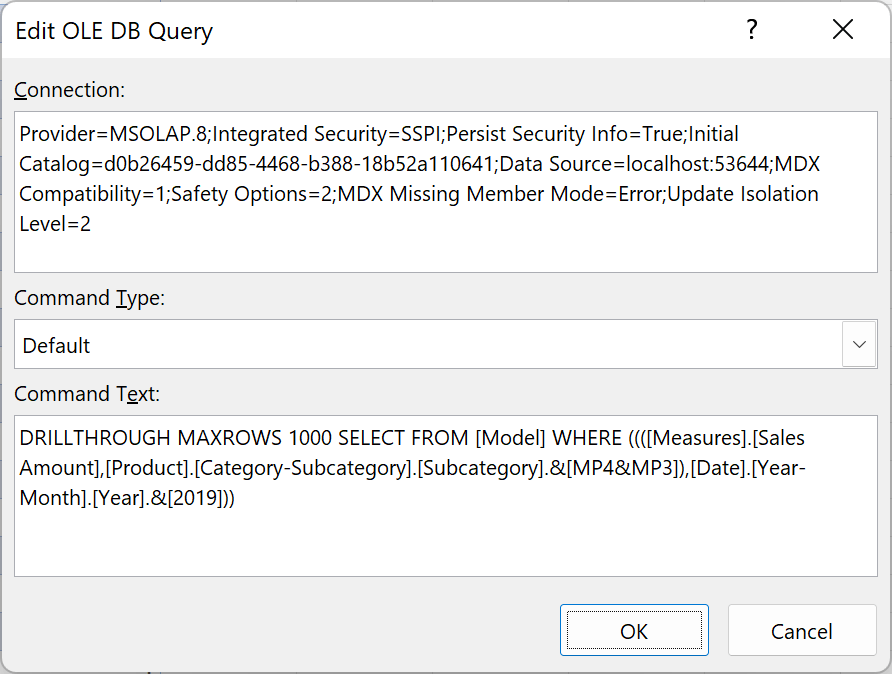
The Command Text includes an MDX query that requests the first 1,000 rows of the default drillthrough action of the following tuple. The tuple is an MDX syntax that defines the set of filters of the cell selected in the PivotTable. A formatted version of the MDX query better shows the filters applied to the query. In MDX, the measure selected is just another filter:
DRILLTHROUGH MAXROWS 1000
SELECT FROM [Model]
WHERE ((
    (
        [Measures].[Sales Amount],
        [Product].[Category-Subcategory].[Subcategory].&[MP4&MP3]
    ),
    [Date].[Year-Month].[Year].&[2019]
))
A drillthrough request does not define the results, as a SUMMARIZECOLUMNS query would. The result depends on how the drillthrough operation is defined in the model. Specifically, it depends on the Detail Rows Expression property of the measure included in the drillthrough request. However, when this property is not defined, the default behavior is to return rows and columns from the table that hosts the measure definition.
While the ability to get the raw content of a table in Excel is undoubtedly useful, there are several limitations in the default behavior of the drillthrough feature for a Tabular model:
- The result includes all the table columns, including hidden columns, excluding columns that are part of a relationship. There could be technical columns that do not carry much meaning to business users, and there are no details about other tables connected through relationships. For example, the previous result does not show any information about the date, the customer, and the product concerned in each transaction.
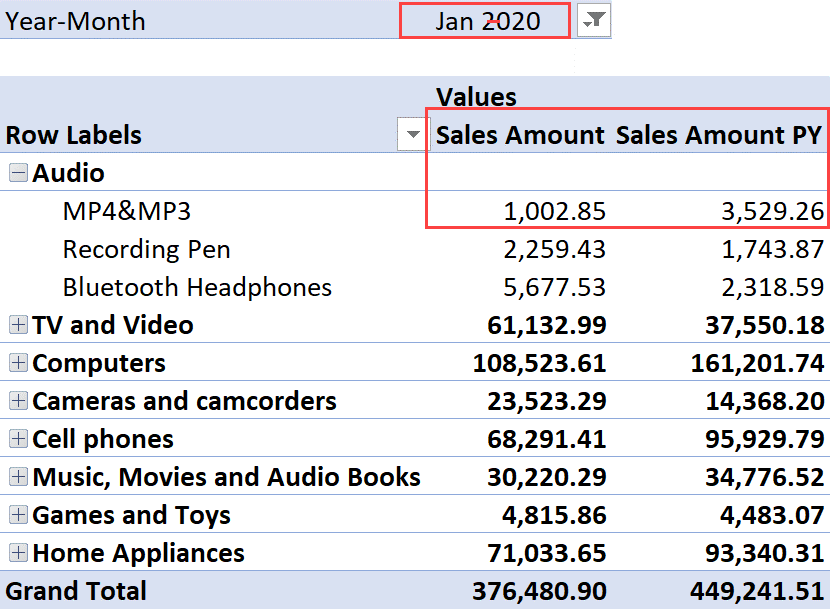
- If the measure contains a filter transformation, that filter is ignored by the default drillthrough action. For example, the Sales Amount PY measure shows the total of transactions made in the same month the year before. While Sales Amount and Sales Amount PY show different results, their default drillthrough action includes the same transactions – only those made in Jan 2020 in the following example. You would expect to see the transactions made in Jan 2019 when you drillthrough the Sales Amount PY measure. However, the drillthrough actions on both highlighted cells return the same result.


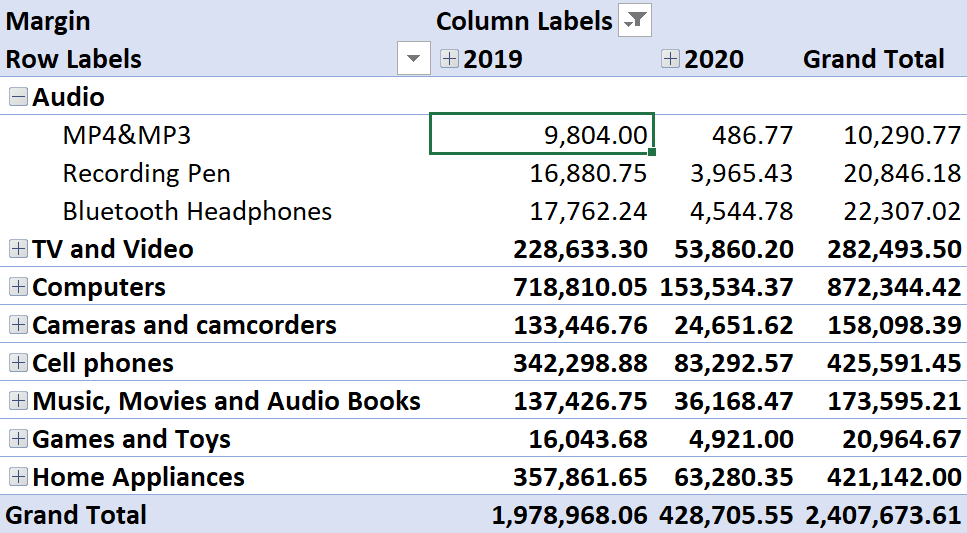
- There are models where measures are defined in a separate table – also known as “disconnected table” or “measures table” – with no relationships with other model tables. If we define measures in a disconnected table, the result of the drillthrough is a meaningless table. For example, the Margin measure is defined in an empty Calculations The drillthrough of the highlighted cell returns an empty Calculations table with no meaningful data.

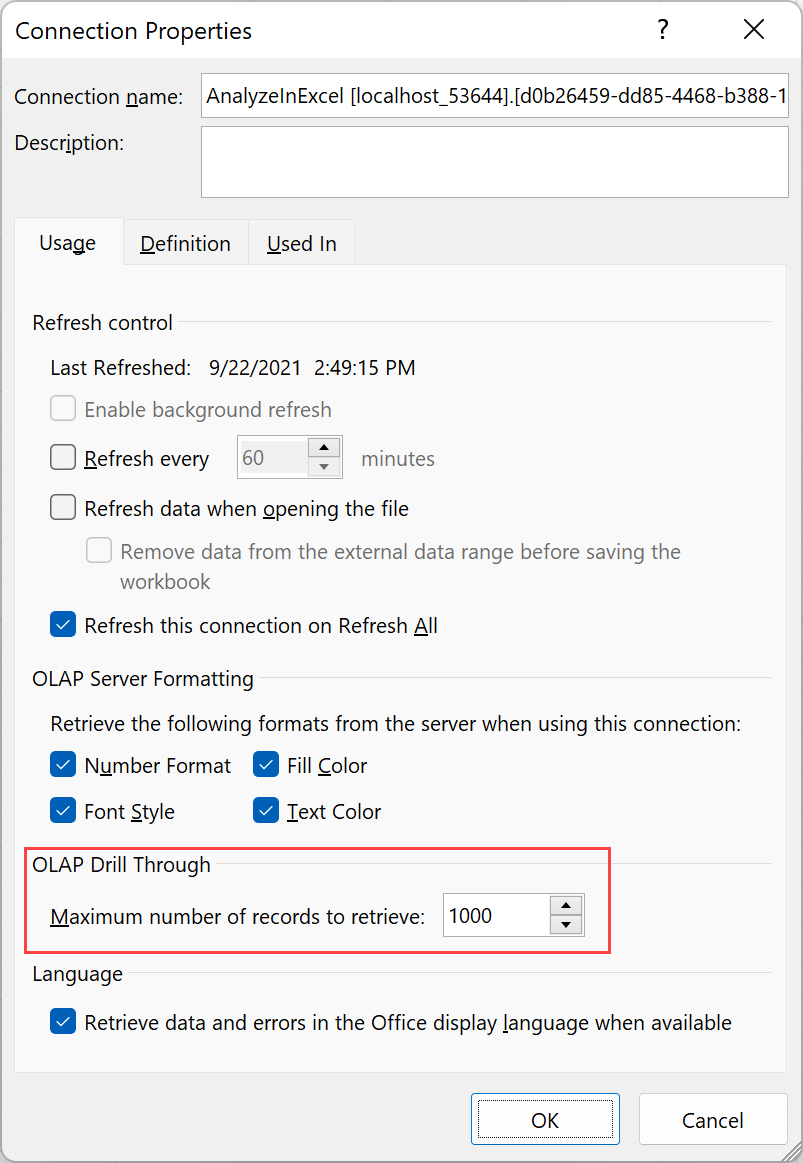
- Excel limits the maximum number of rows returned in the table. By default, there is a limit of 1,000 rows. However, you can change this limit by editing the query in the Edit OLE DB Query dialog box illustrated earlier. You can also change the default value for any new drillthrough action invoked in Excel by customizing the parameter in the PivotTable connection dialog box accessible through the Data / Queries & Connections ribbon button. The OLAP Drill Through section can be modified to a number other than 1,000.
Customizing a drillthrough using the Detail Rows Expression property
If you do not specify otherwise, a drillthrough operation returns all the table columns as we saw earlier. You can change this behavior by using the Detail Rows Expression property of a measure. You can also set the Default Detail Rows expression at the table level. In that case, measures with no detail rows expressions use the default one set at the table level. The Detail Rows Expression and Default Detail Rows Expression properties can be assigned to a DAX expression returning a table. A scalar value would generate an error.
The following examples describe different techniques to implement common business requirements for the drillthrough requests.
Customizing drillthrough columns
The Sales table in the sample file contains several measures that can share the same drillthrough content, including Sales Amount, Total Cost, and Total Quantity. We use the Default Detail Rows Expression property of the Sales table to show the order reference, product name, customer name, quantity, price, and cost. We can obtain these details by iterating the Sales table with SELECTCOLUMNS, renaming the columns so that they do not include the table name, and retrieving product and customer names from the corresponding tables using the RELATED function:
SELECTCOLUMNS (
    Sales,
    "Order Number", Sales[Order Number],
    "Line Number", Sales[Line Number],
    "Order Date", Sales[Order Date],
    "Product Name", RELATED ( 'Product'[Product Name] ),
    "Quantity", Sales[Quantity],
    "Net Price", Sales[Net Price],
    "Unit Cost", Sales[Unit Cost],
    "Customer Name", RELATED ( Customer[Name] )
)
The DAX expression must be assigned to the Default Detail Rows Expression of the Sales table using Tabular Editor, because Power BI does not expose that property in the user interface.
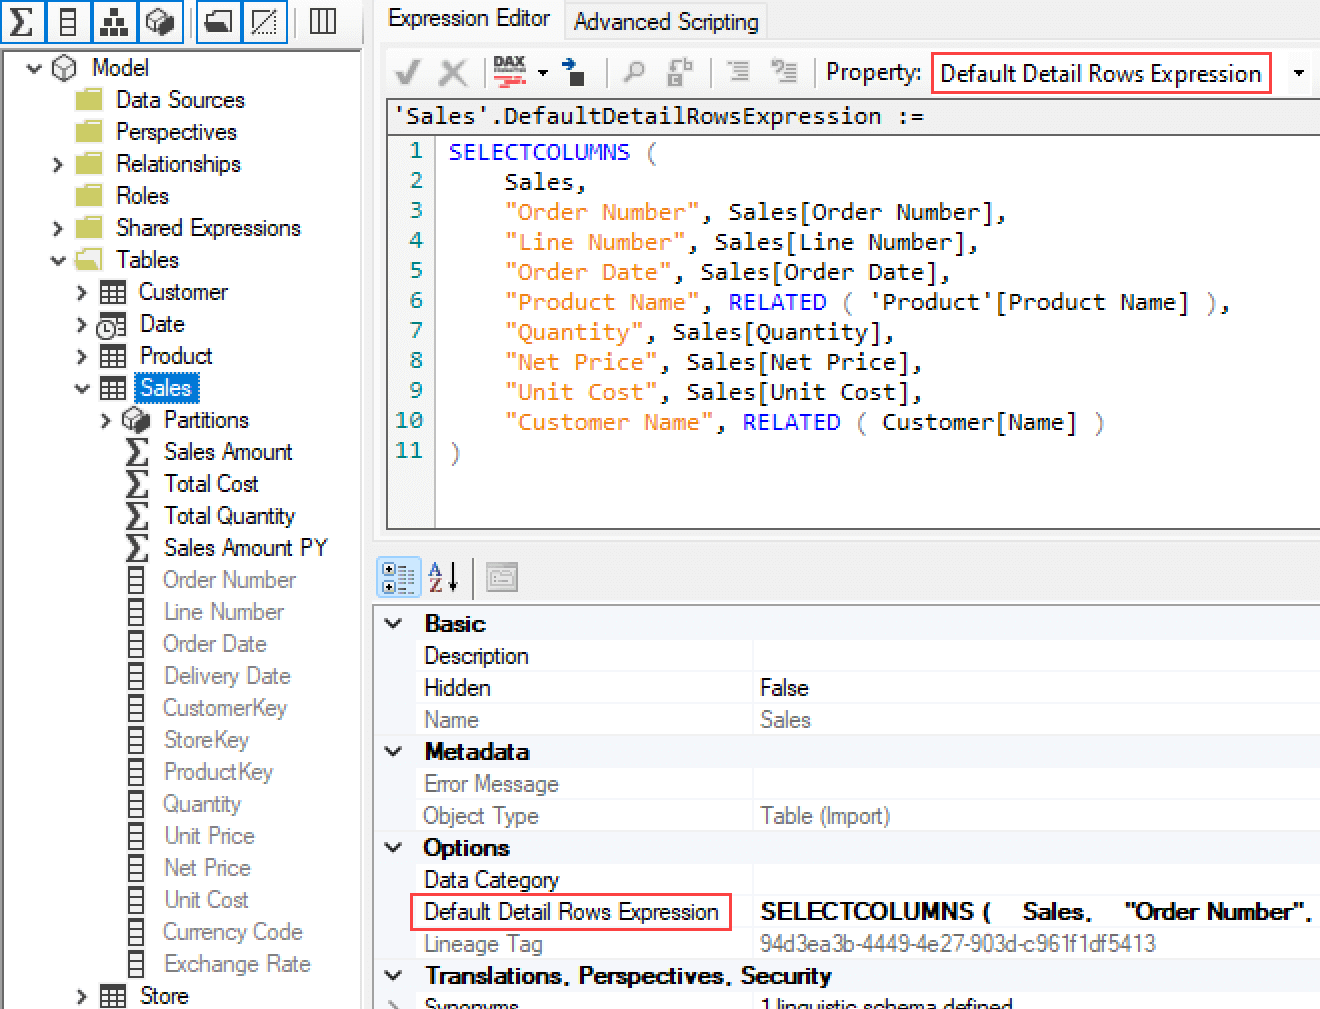
To apply the property to the Power BI model, remember to save the changes in Tabular Editor. If you use Visual Studio for an Analysis Services model, you follow the same deployment process as any other property. Once the changes are applied to the model, we can test the new drillthrough experience.
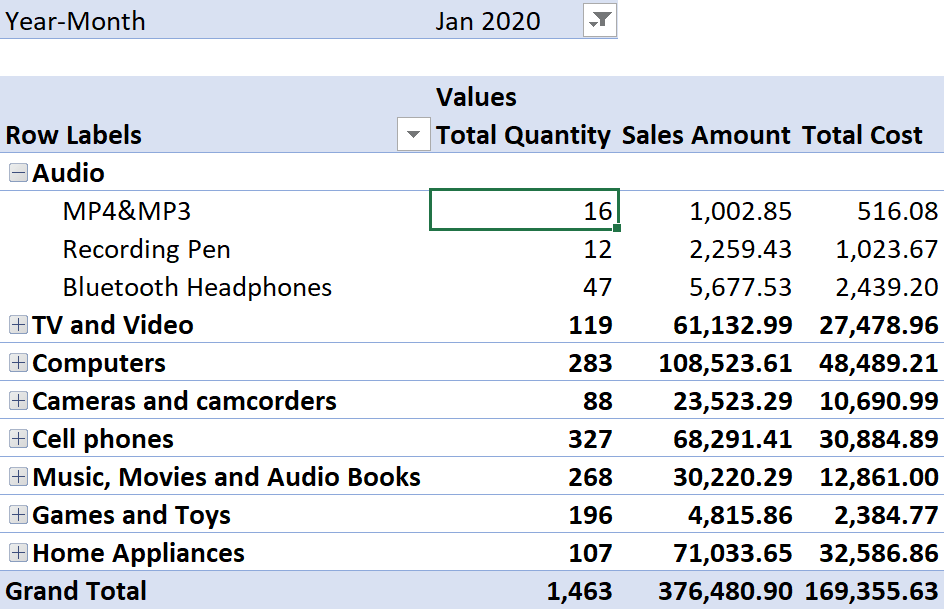
The result of the drillthrough is identical for all the measures included in the PivotTable: Total Quantity, Sales Amount, and Total Cost. The following screenshot is the drillthrough for MP4&MP3 products in Jan 2020.

Because we renamed the columns in SELECTCOLUMNS, each column name is enclosed between square brackets without an initial table name. Unfortunately, it is not possible to remove such delimiters.
The Margin and Margin % measures are defined in a different table, Calculations. To provide the same drillthrough result we have for the measures in Sales, we can customize the Detail Rows Expression property on both measures; alternatively, we can assign a DAX expression to the Default Detail Rows of the Calculations table. Because we do not want to apply a potentially wrong default drillthrough action to future measures, we can assign the following DAX code to the Detail Rows Expression property of both Margin and Margin %:
DETAILROWS ( [Sales Amount] )
The DETAILROWS function executes the drillthrough expression of the specified measure. This way, we can avoid duplicating the table expression already used for the drillthrough of other measures.
Customizing drillthrough rows
The Sales Amount PY measure shows the value of Sales Amount for the same period in the previous year. For example, the highlighted cell in the following screenshot shows Sales Amount for MP4&MP3 products in Jan 2019, whereas the previous column shows Sales Amount in Jan 2020.
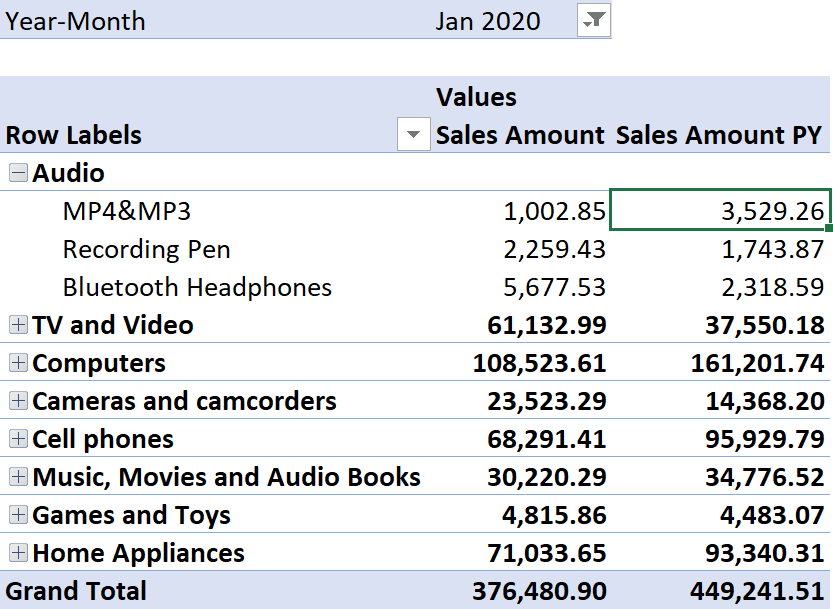
If we request the drillthrough for the highlighted cell, we get the same drillthrough as we would for Sales Amount: Indeed, both Sales Amount and Sales Amount PY use the drillthrough expression defined in the Sales table. However, we want a different result for Sales Amount PY: it should return the transactions made in Jan 2019 when the filter is on Jan 2020, as in the previous screenshot.
We can customize the Detail Rows Expression of the Sales Amount PY measure by reusing the existing drillthrough expression of Sales Amount and applying the same change to the filter context. The Sales Amount PY is defined as follows:
Sales Amount PY :=
CALCULATE (
    [Sales Amount],
    SAMEPERIODLASTYEAR ( 'Date'[Date] )
)
We can apply the same filter context transformation by using SAMEPERIODLASTYEAR in a CALCULATETABLE function that invokes the drillthrough expression of Sales Amount with the DETAILROWS function. By using DETAILROWS we do not have to duplicate the code of the drillthrough expression used by other measures:
CALCULATETABLE (
    DETAILROWS ( [Sales Amount] ),
    SAMEPERIODLASTYEAR ( 'Date'[Date] )
)
The code must be assigned to the Detail Rows Expression of Sales Amount PY by using Tabular Editor.
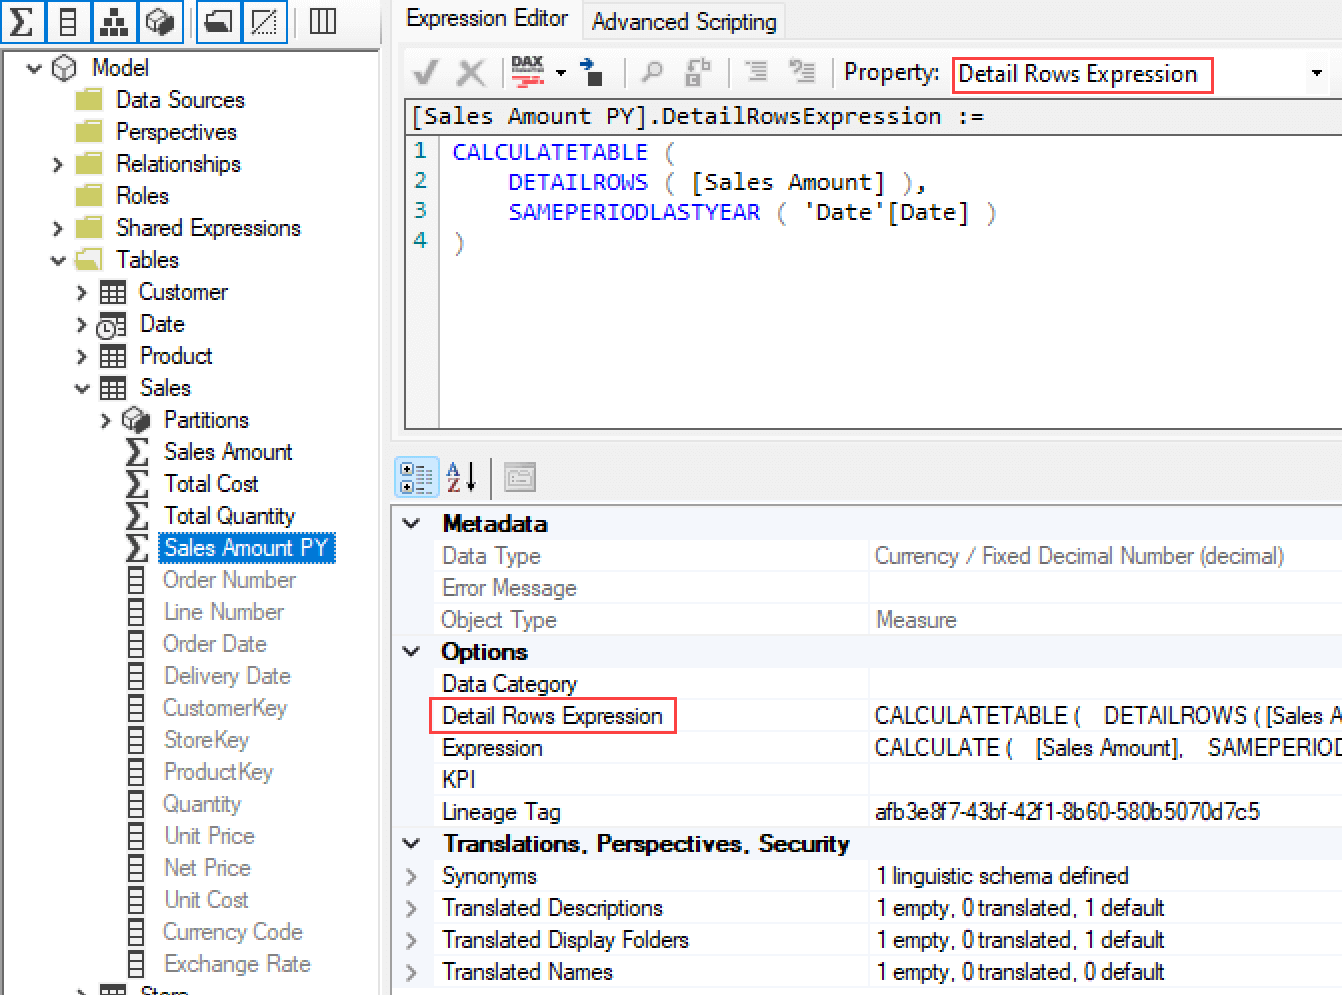
After saving the changes to the model, the drillthrough for Sales Amount PY in Jan 2020 returns the transactions in January 2019.

Customizing drillthrough rows, columns, and granularity
The Sales YOY measure returns the sales difference with the previous year, computed as a difference between Sales Amount and Sales Amount PY.
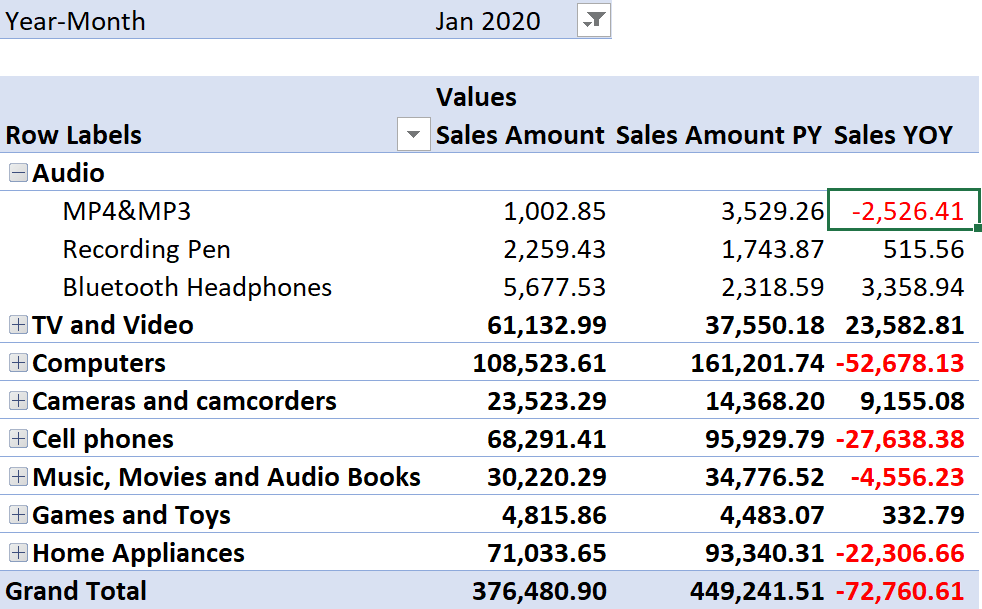
The DAX expression for Sales YOY computes two measures and returns the difference if none of the two measures is blank:
Sales YOY :=
VAR ValueCurrentPeriod = [Sales Amount]
VAR ValuePreviousPeriod = [Sales Amount PY]
VAR Result =
    IF (
        NOT ISBLANK ( ValueCurrentPeriod ) && NOT ISBLANK ( ValuePreviousPeriod ),
        ValueCurrentPeriod – ValuePreviousPeriod
    )
RETURN
    Result
In this case, returning all the transactions of the two compared periods would not be very helpful. The business users would like to see a drillthrough report that, for the previous example, shows for each day in Jan 2020 the number of transactions (Total Quantity) and the value of Sales Amount for that day and the same day the year before. With these requirements, we have to change the granularity of the result of the drillthrough: we no longer obtain the entirety of all the rows from the Sales table, instead we aggregate data by date using SUMMARIZE.
In this case, we assign the following DAX code to the Detail Rows Expression of the Sales YOY measure:
VAR _Dates = DISTINCT ( 'Date'[Date] )
VAR _Details =
    ADDCOLUMNS (
        _Dates,
        "Quantity", [Total Quantity],
        "Quantity PY", CALCULATE ( [Total Quantity], SAMEPERIODLASTYEAR ( 'Date'[Date] ) ),
        "Sales", [Sales Amount],
        "Sales PY", [Sales Amount PY]
    )
VAR Result =
    FILTER (
        _Details,
        NOT (
            ISBLANK ( [Quantity] ) && ISBLANK ( [Quantity PY] )
              && ISBLANK ( [Sales] ) && ISBLANK ( [Sales PY] )
        )
    )
RETURN Result
The drillthrough result for MP4&MP3 products in Jan 2020 is shown below. Dates with no values in neither Jan 2019 nor Jan 2020 are not included in the result.
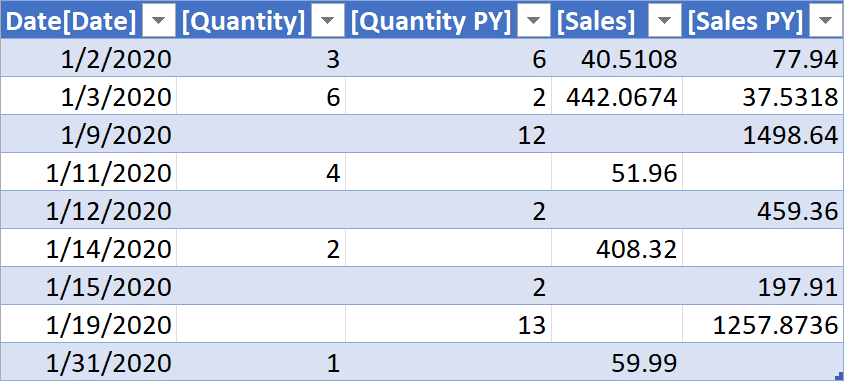
We cannot control the format string of the numeric columns returned by the drillthrough operation. If we round the number in the DAX expression, the lost digits are not returned at all to the client. In contrast, the format used for measures displayed in a PivotTable hides data after the second digit past the decimal point without affecting the underlying number if it is used for other calculations in Excel.
Creating specific measures to provide customized drillthrough features
A measure can have only one drillthrough behavior. In a scenario where it would be helpful to define several different drillthrough behaviors for the same set of filters in a PivotTable, a workaround is to define one measure for each possible behavior. For example, you might consider retrieving a list of customers and a list of products for a group of orders received in a specific period. The drillthrough of the Sales Amount measure returns the list of underlying transactions. We can define two other measures to return in the drillthrough result the list of unique customers and products involved in those transactions. The measures are meant to return a message spelling out the expected result of the drillthrough. This results in the PivotTable we see next.
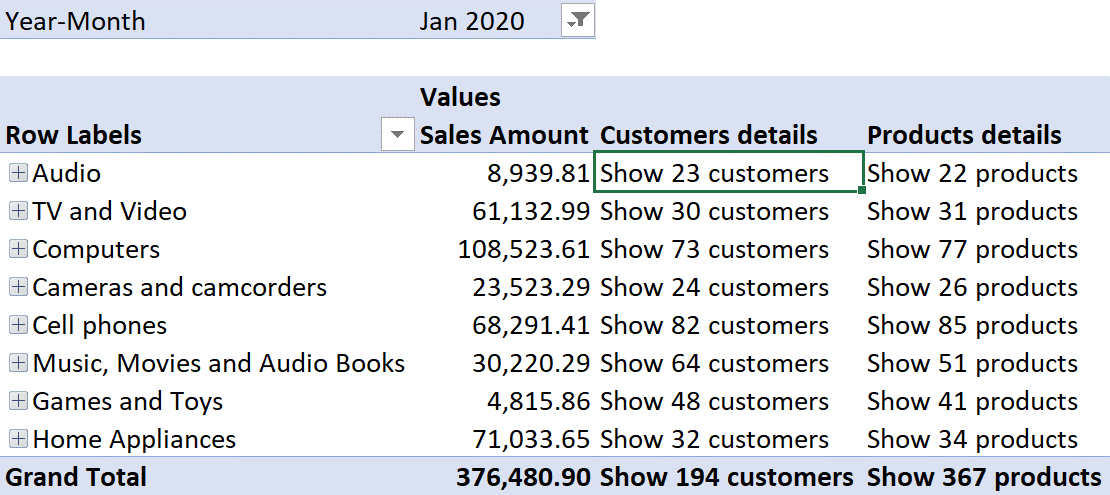
The Customers details and Products details measures are defined as follows:
Customers details :=
VAR NumberOfCustomers = DISTINCTCOUNTNOBLANK ( Sales[CustomerKey] )
VAR Result = "Show " & NumberOfCustomers & " customer" & IF ( NumberOfCustomers > 1, "s" )
RETURN IF ( NumberOfCustomers>= 1, Result )

Products details :=
VAR NumberOfProducts = DISTINCTCOUNTNOBLANK ( Sales[ProductKey] )
VAR Result = "Show " & NumberOfProducts & " product" & IF ( NumberOfProducts > 1, "s" )
RETURN IF ( NumberOfProducts >= 1, Result )
The drillthrough expression of the Customers details measure returns the list of customers with transactions in the current filter context:
SUMMARIZE (
    Sales,
    Customer[Name],
    Customer[City],
    Customer[State],
    Customer[Country]
)
The following picture shows the drillthrough result of Customers details for sales of Audio products in Jan 2020.

The drillthrough expression of the Products details measure is defined similarly and returns only columns from the Product table:
SUMMARIZE (
    Sales,
    'Product'[Product Code],
    'Product'[Product Name],
    'Product'[Brand],
    'Product'[Unit Price]
)
This is the result of the drillthrough of Products details for Audio products sales in Jan 2020.

These last two examples can be used to return tens of thousands of rows in less than a couple of seconds. When the user tries to create a similar result with a PivotTable by applying dimension filters and by specifying as many attributes in the Rows section as the number of columns returned by the drillthrough expression, the performance is usually very slow. It may well exceed 10 to 20 seconds. The technical reasons for this difference do not typically matter to business users who want to draw insights from the available data. If providing detailed tables with data is critical in a Power BI solution, using the drillthrough feature in Excel can be a very efficient strategy.
Conclusions
The drillthrough feature in Excel can be controlled by the Detail Rows Expression property available in each measure of a Tabular model. The table that hosts the measure definition can also have a Default Detail Rows Expression that is used by default in all the measures that do not have a definition in their Detail Rows Expression property.
The DAX expression for the drillthrough can return data with excellent performance. The author of the Tabular model is responsible for creating efficient DAX expressions for the drillthrough.
To reuse the drillthrough code in different measures, you can use the DETAILROWS function to retrieve the result of the drillthrough from another existing measure. In reality, these table expressions can be reused regardless of the drillthrough action. You can create a library of table expression functions by using the drillthrough expression of hidden measures. The user should never see or use those measures, their expressions should only be made available by using the DETAILROWS function. More details about this technique are available in the Creating table functions in DAX using DETAILROWS article.
Create a summary table for the requested totals over set of groups.
SUMMARIZECOLUMNS ( [<GroupBy_ColumnName> [, [<FilterTable>] [, [<Name>] [, [<Expression>] [, <GroupBy_ColumnName> [, [<FilterTable>] [, [<Name>] [, [<Expression>] [, … ] ] ] ] ] ] ] ] ] )
Returns the depreciation of an asset for a specified period using the fixed-declining balance method.
DB ( <Cost>, <Salvage>, <Life>, <Period> [, <Month>] )
Returns a table with selected columns from the table and new columns specified by the DAX expressions.
SELECTCOLUMNS ( <Table> [[, <Name>], <Expression> [[, <Name>], <Expression> [, … ] ] ] )
Returns the table data corresponding to the DetailRows expression defined on the specified Measure. If a DetailRows expression is not defined then the entire table to which the Measure belongs is returned.
DETAILROWS ( <Measure> )
Returns a set of dates in the current selection from the previous year.
SAMEPERIODLASTYEAR ( <Dates> )
Evaluates a table expression in a context modified by filters.
CALCULATETABLE ( <Table> [, <Filter> [, <Filter> [, … ] ] ] )
Creates a summary of the input table grouped by the specified columns.
SUMMARIZE ( <Table> [, <GroupBy_ColumnName> [, [<Name>] [, [<Expression>] [, <GroupBy_ColumnName> [, [<Name>] [, [<Expression>] [, … ] ] ] ] ] ] ] )
 Marco Russo & Alberto Ferrari