 Marco Russo
A Tabular model in compatibility level 1400 provides a property named Detail Rows Expression, which is designed to provide control over drillthrough results from MDX queries. The same table expression can also be evaluated in DAX by using the DETAILROWS function. As of July 2018, this is the only way to define a table expression in a Tabular model that can be reused in other DAX expressions. Therefore a possible alternative use of this feature is defining a complex table expression in a single place – then reusing it in multiple places by just invoking a DETAILROWS function. Special thanks to Daniel Otykier for sharing the original idea.
WARNING: The DETAILROWS function was not designed for the purposes described in this article. The query plan generated using this technique is not optimal, negatively impacting expressions involving time intelligence calculations specifically. However, the lack of alternatives can make this feature appealing once its performance is considered acceptable for a specific data model. If you want to assign the Detail Rows Expression property in a Power BI model, you have to use Tabular Editor, whereas the DETAILROWS function can be consumed also in the DAX editor of Power BI Desktop.
The following descriptions assume knowledge of the user interface to set the Detail Rows Expression in a Tabular model. This is described in the article Controlling drillthrough using Detail Rows Expressions in DAX.
The idea
A common issue in DAX is the duplication of an identical filter expression in multiple measures. For example, consider the following measures:
Sales Trendy Products :=
CALCULATE (
    [Sales Amount],
    FILTER (
        ALL ( 'Product'[Brand], 'Product'[Color] ),
        ( 'Product'[Brand], 'Product'[Color] )
            IN {
                ( "Contoso", "Red" ),
                ( "Adventure Works", "Red" )
            }
    )
)

Quantity Trendy Products :=
CALCULATE (
    [Total Quantity],
    FILTER (
        ALL ( 'Product'[Brand], 'Product'[Color] ),
        ( 'Product'[Brand], 'Product'[Color] )
            IN {
                ( "Contoso", "Red" ),
                ( "Adventure Works", "Red" )
            }
    )
)
The line filtering the product color is identical in both measures. From a maintenance point of view, any change to the filter logic must be replicated in every measure using the same filter. From a readability point of view, it could be hard to read different measures where 90% of the code is a shared filter.
By leveraging the Detail Rows feature, it is possible to move the filter definition in the Detail Rows Expression property of a measure named TrendyProducts. Then, the same table expression can be obtained by invoking DETAILROWS ( [TrendyProducts] ) :
Sales Trendy Products :=
CALCULATE (
    [Sales Amount],
    DETAILROWS ( [TrendyProducts] )
)

Quantity Trendy Products :=
CALCULATE (
    [Total Quantity],
    DETAILROWS ( [TrendyProducts] )
)
Because the TrendyProducts measure’s only purpose is to return a detail rows expression, it is a good idea to hide it to the user. Here is a list of suggested steps:
- Create a hidden calculated table without any relationships to other tables.
- Create a measure for each table expression.
- Hide the measure to client tools.
- Name the measure to identify the table returned by Detail Rows Expression.
- Assign an ERROR function as the measure expression, with a message clarifying that the purpose of the measure is to provide just the Detail Rows Expression. This way, the measure will not be used in any report.
- Assign the table expression to the Detail Rows Expression property of the measure.
- Reference the table expression using DETAILROWS and passing the measure name as argument.
Considering that this technique is very useful for sharing complex filter arguments of CALCULATE functions, we name filter measures those measures created only to provide an expression to DETAILROWS.
Examples of complex filters that could benefit from this technique are same-store sales, dynamic classifications of customers or products, and complex time intelligence expressions. However, this technique shows performance issues when used to select standard time intelligence functions based on dynamic conditions. This problem is described later in the article.
The example
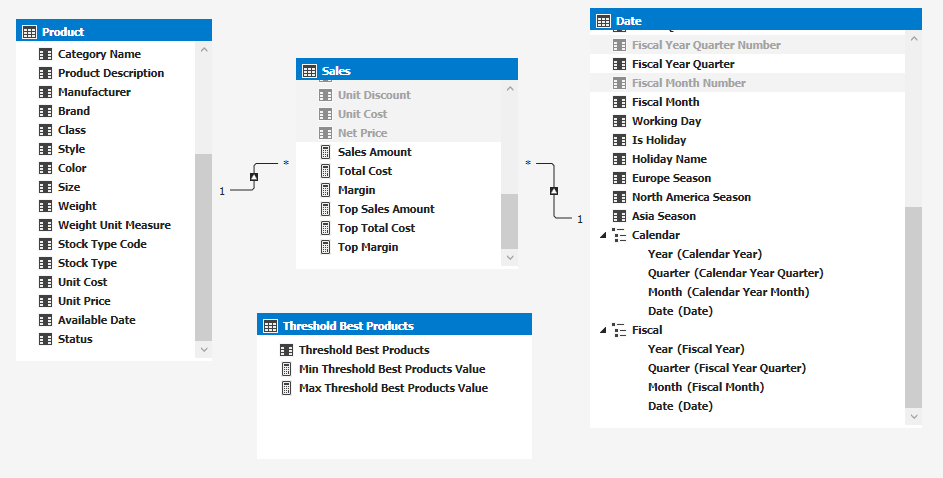
Consider a data model with sales of products and dates, plus a table that has no relationships and is only used to display a slicer that defines a range of values.
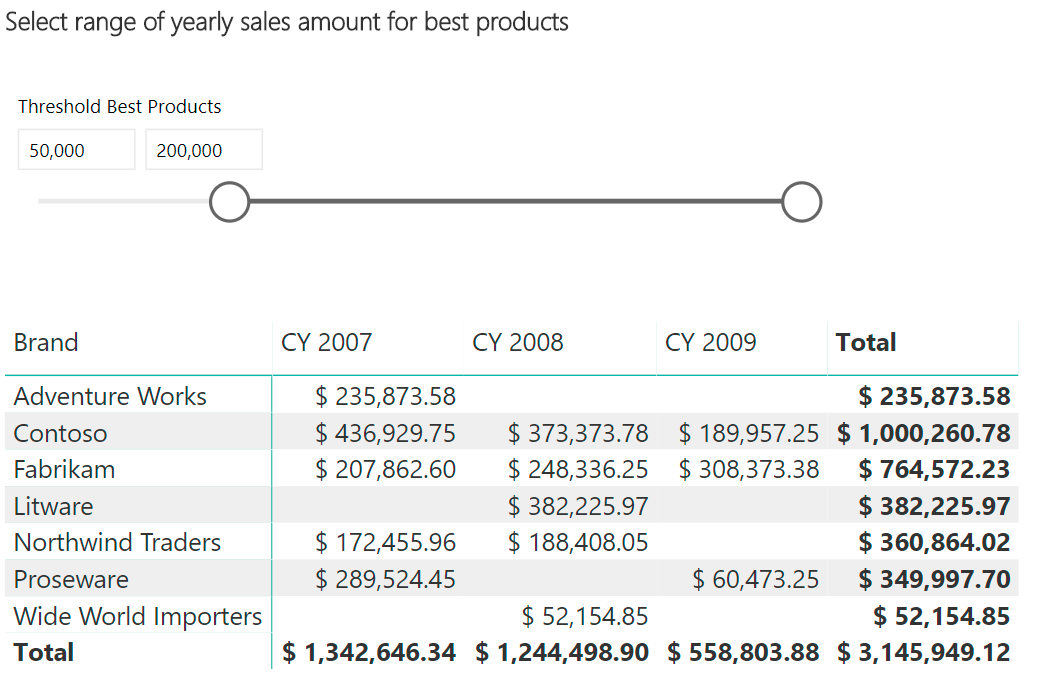
The measures with the prefix Top compute the corresponding base measures but only filtering the products that in the entire year, have a sales amount within the range of values selected in the slicer. The following is a simple report using this data model. The matrix shows the Top Sales Amount measure.
There are three measures in the model that are very similar: Top Sales Amount, Top Total Cost, and Top Margin. Each measure evaluates the corresponding base measure (Sales Amount, Total Cost, and Margin) by applying the same filter. This is the definition of Top Sales Amount without sharing the table filter with the technique described in this article:
Top Sales Amount :=
VAR MinThresholdBestProducts = [Min Threshold Best Products Value]
VAR MaxThresholdBestProducts = [Max Threshold Best Products Value]
VAR YearsProducts =
    SUMMARIZE (
        Sales,
        'Date'[Calendar Year],
        'Product'[ProductKey]
    )
VAR BestYearProducts =
    FILTER (
        YearsProducts,
        VAR SalesYearProduct =
            CALCULATE (
                [Sales Amount],
                ALLEXCEPT (
                    'Date',
                    'Date'[Calendar Year]
                )
            )
        RETURN
            SalesYearProduct >= MinThresholdBestProducts
            && SalesYearProduct <= MaxThresholdBestProducts
    )
RETURN
    CALCULATE (
        [Sales Amount],
        BestYearProducts
    )
The BestYearProducts variable contains the same filter used by all the “Top” measures. The goal is to move this filter into a Detail Rows Expression.
We created a Filters calculated table with the following expression returning a table with one column and zero rows:
=FILTER (
    ROW ( "dummy", BLANK() ),
    FALSE
)
After setting the Hidden property of Filters to True, we defined a Best Yearly Products measure in the Filters table:
Best Yearly Products :=
ERROR ( "Reserved for DETAILROWS use only" )
In the Detail Rows Expressions property of the Best Yearly Products measure, we wrote the filter expression that will be shared in the “Top” measures:
VAR MinThresholdBestProducts = [Min Threshold Best Products Value]
VAR MaxThresholdBestProducts = [Max Threshold Best Products Value]
VAR YearsProducts =
    SUMMARIZE ( Sales, 'Date'[Calendar Year], 'Product'[ProductKey] )
VAR BestYearProducts =
    FILTER (
        YearsProducts,
        VAR SalesYearProduct =
            CALCULATE (
                [Sales Amount],
                ALLEXCEPT ( 'Date', 'Date'[Calendar Year] )
            )
        RETURN SalesYearProduct >= MinThresholdBestProducts
                   && SalesYearProduct <= MaxThresholdBestProducts
    )
RETURN BestYearProducts
Finally, we defined the three “Top” measures by just referencing the filter using DETAILROWS:
Top Sales Amount:=CALCULATE (
    [Sales Amount],
    DETAILROWS ( [Best Yearly Products] )
)
Top Total Cost:=CALCULATE (
    [Total Cost],
    DETAILROWS ( [Best Yearly Products] )
)
Top Margin:=CALCULATE (
    [Margin],
    DETAILROWS ( [Best Yearly Products] )
)
A zip file is available for download at the bottom of this article. It includes a backup of the data model created with Analysis Services 2017 and the Power BI report used in this example.
Performance issues
The Detail Rows Expression property was not designed for the purposes described in this article. DETAILROWS works as expected from a functionality point of view, but it could complicate the query plan when used as a filter argument of CALCULATE compared to pasting the expression straight into the CALCULATE function.
For example, the following filter dynamically selects a range of dates depending on the selection of a slicer containing a list of possible aggregations: Regular, Year to date, Month to date, Last 12 months. This code is not ideal in any case, but embedding it in DETAILROWS produces an even slower execution:
VAR currentDates =
    VALUES ( 'Date'[Date] )
VAR aggregation =
    SELECTEDVALUE ( 'Date Tool'[Aggregation] )
VAR noFilter =
    ISBLANK ( aggregation ) || aggregation = "Regular"
VAR isYtd = aggregation = "Year to date"
VAR isMtd = aggregation = "Month to date"
VAR isLast12 = aggregation = "Last 12 months"
VAR YtdDates =
    DATESYTD ( 'Date'[Date] )
VAR MtdDates =
    DATESMTD ( 'Date'[Date] )
VAR Last12Months =
    DATESINPERIOD ( 'Date'[Date], MAX ( 'Date'[Date] ), -1, YEAR )
VAR targetDates =
    UNION (
        FILTER ( currentDates, noFilter ),
        FILTER ( YtdDates, isYtd ),
        FILTER ( MtdDates, isMtd ),
        FILTER ( Last12Months, isLast12 )
    )
RETURN
    TREATAS ( targetDates, 'Date'[Date] )
Ideally, the table expression in DETAILROWS should not have too many conditional statements. This is true also for the table expression used directly in a filter argument of CALCULATE.
Just because DETAILROWS makes it easier to reuse a complex filter, does not mean that performance should not be a concern.
Conclusions
Creating table functions used through DETAILROWS could be a workaround for the lack of custom table functions in DAX. This feature is necessary in order to avoid code duplication of complex filters in multiple CALCULATE statements. Indeed, it is error-prone and complex to maintain in case a change to a common filter logic is required.
Sharing table functions using DETAILROWS might introduce performance issues, so its use must always be tested with a real-world amount of data. However, the cost of using DETAILROWS might be affordable for simple and linear expressions that do not have conditional branches.
Returns the table data corresponding to the DetailRows expression defined on the specified Measure. If a DetailRows expression is not defined then the entire table to which the Measure belongs is returned.
DETAILROWS ( <Measure> )
Raises a user specified error.
ERROR ( <ErrorText> )
Evaluates an expression in a context modified by filters.
CALCULATE ( <Expression> [, <Filter> [, <Filter> [, … ] ] ] )