 Marco Russo
The Power BI Performance Analyzer is a feature included in the May 2019 release of Power BI Desktop that simplifies the way you can collect the DAX queries generated by Power BI. You can use DAX Studio to capture them (as described in Capturing Power BI queries using DAX Studio), but the Performance Analyzer integrated in Power BI is simpler and provides a few insights about the time consumed in other activities, such as the rendering time of any visuals.
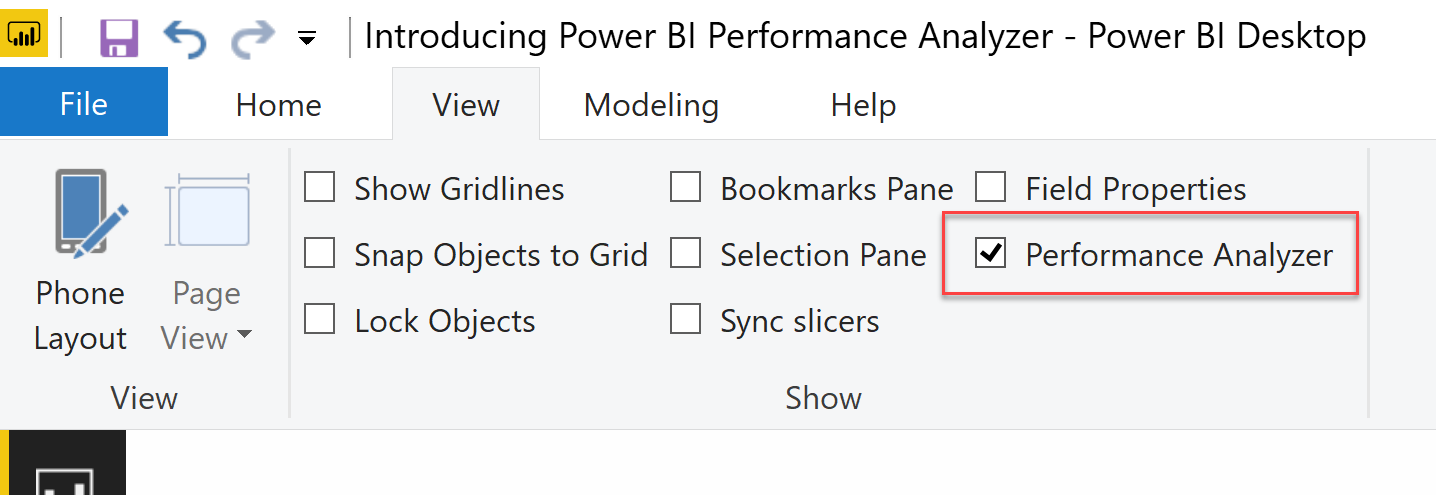
You can enable the Power BI Performance Analyzer by clicking the Performance Analyzer checkbox in the View ribbon of Power BI Desktop.
You can find more details about the user interface in the Performance Analyzer documentation by Microsoft. The goal of this article is to focus on the metrics provided by this feature and help you interpret the data correctly.
For example, let’s begin with capturing the timing for all the visuals included in the Sales page of the sample files you can download at the end of this article. You should execute the operations in this exact order:
- Open the PBIX file (and do not change the current page, stay on “Empty page”),
- Enable the Performance Analyzer pane,
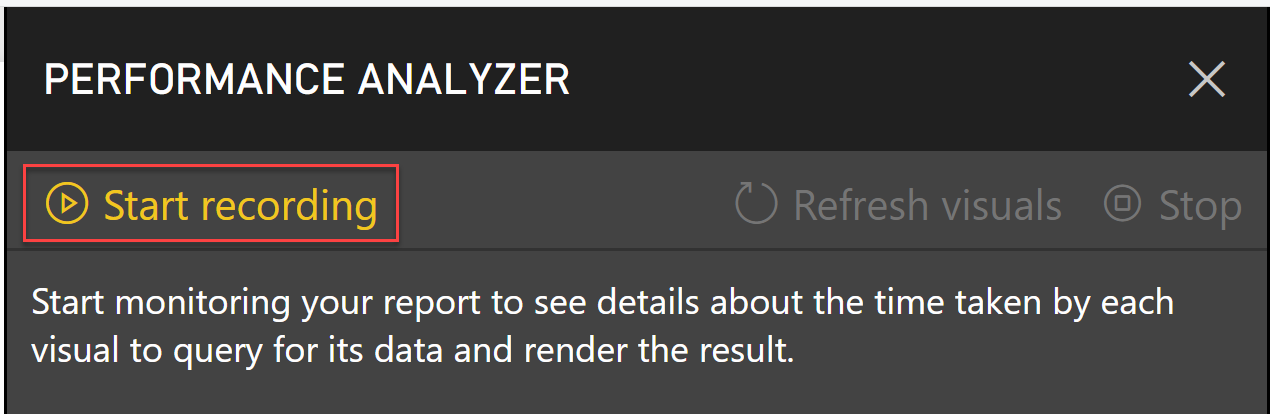
- Click on Start Recording in the Performance Analyzer pane,
- Switch to the Sales page in the report,

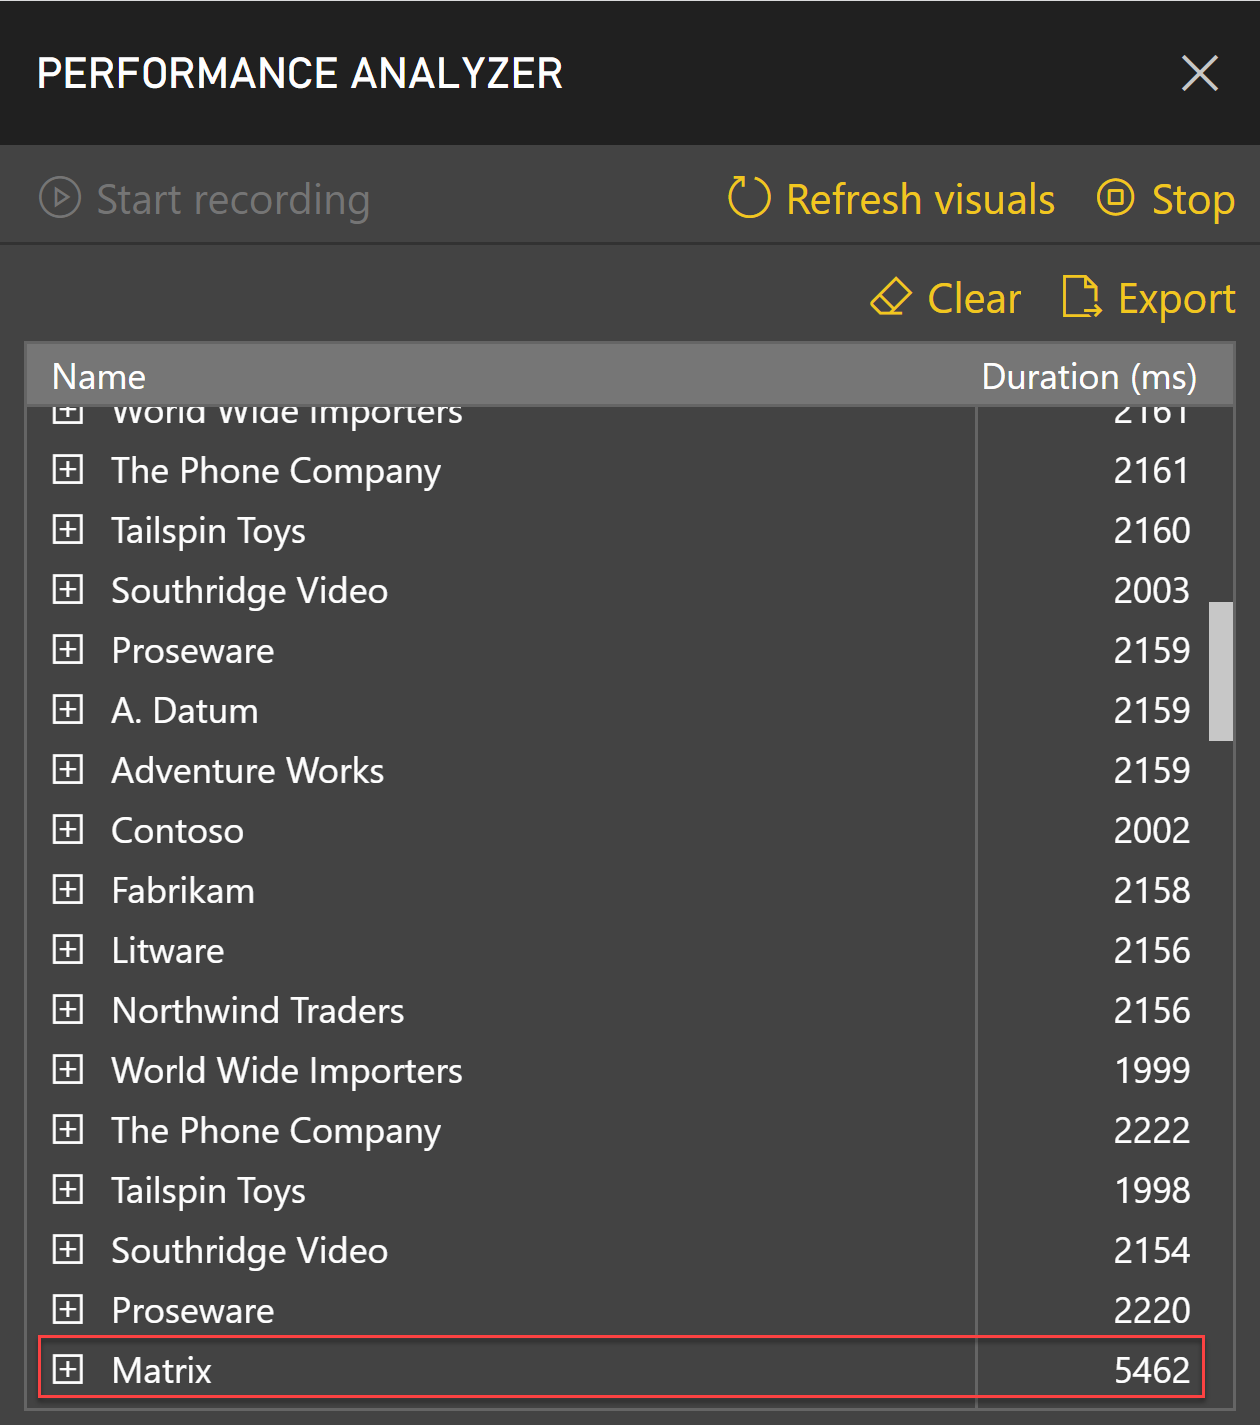
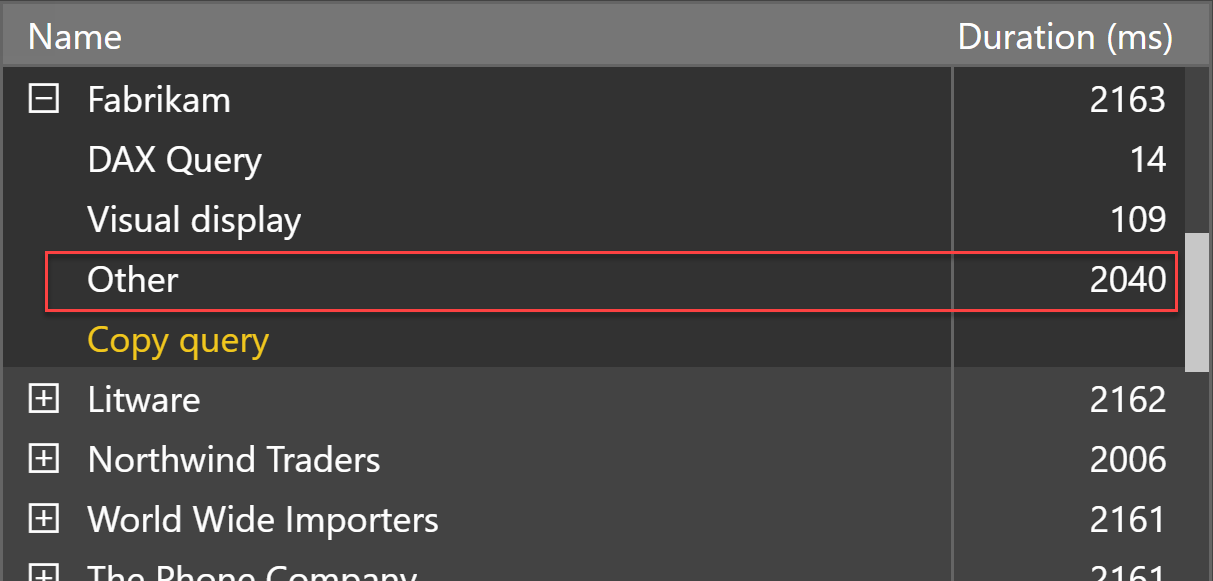
- The Performance Analyzer pane captures the Duration time in milliseconds for each visual in the page. The Matrix visual is the slowest – though timing may vary on different hardware – but every visual might show around 2 seconds of duration.
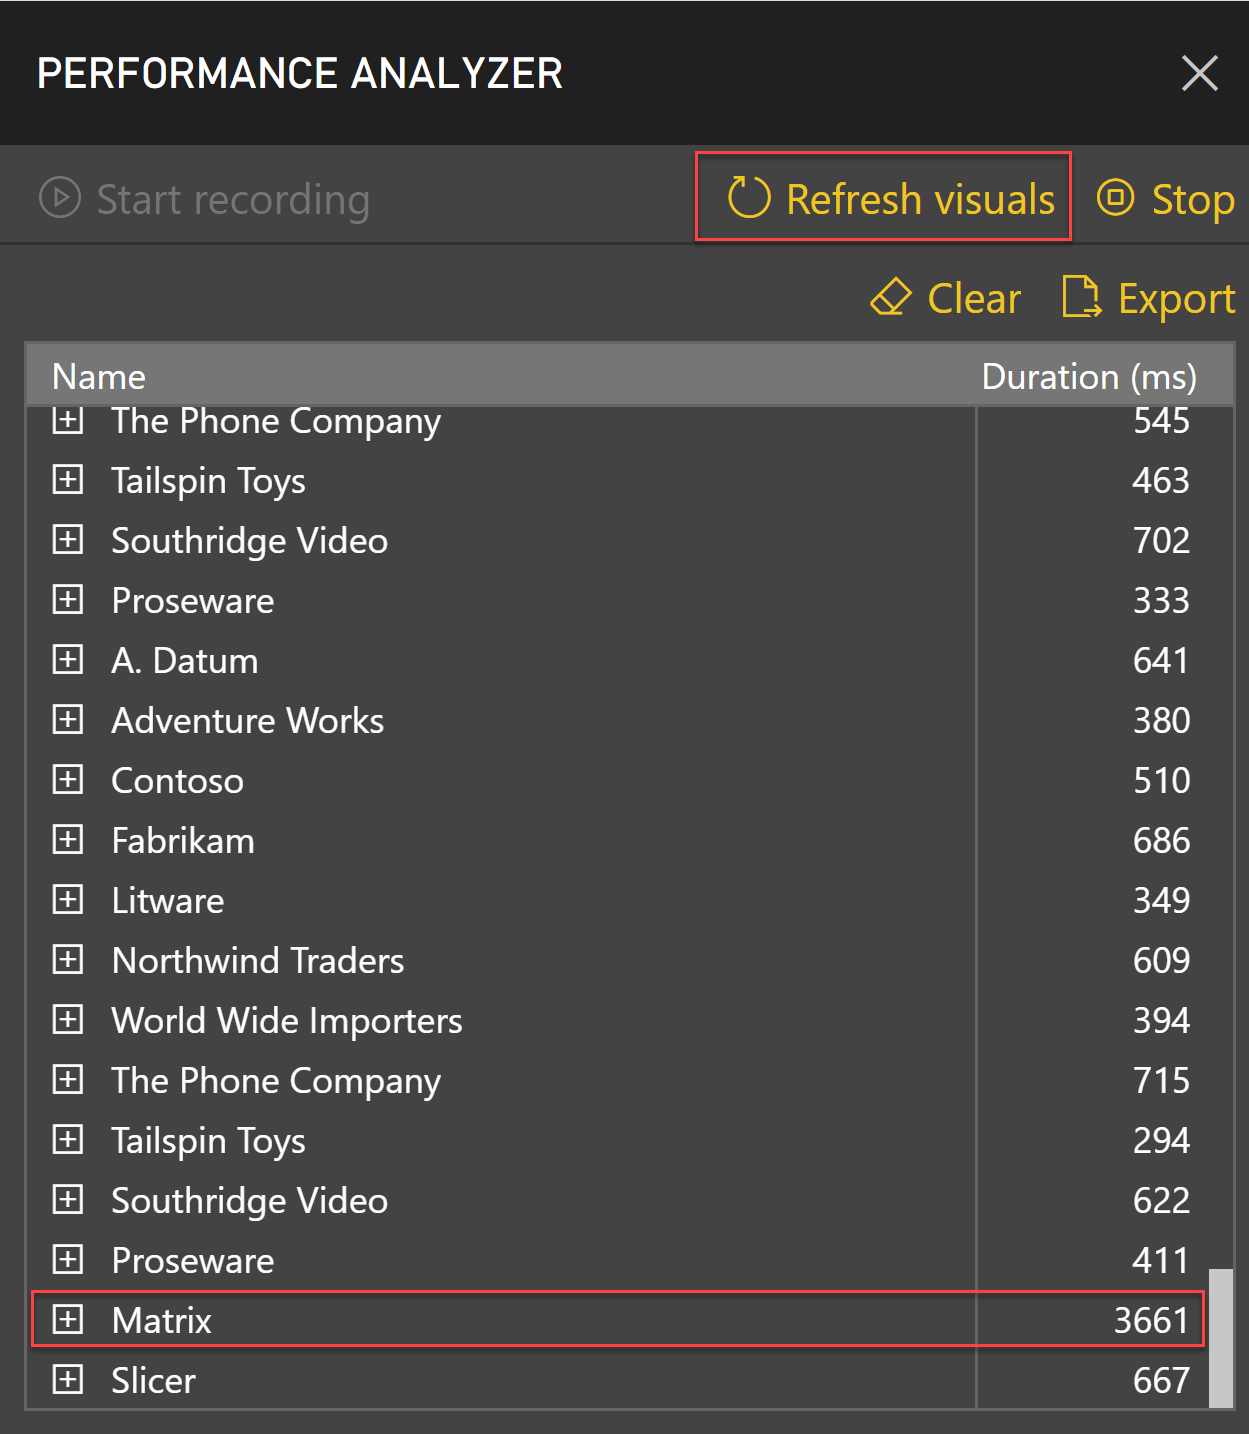
- Click on the Refresh visuals button in the Performance Analyzer pane and scroll down to see the Duration of the visuals for the second execution. The Matrix is still the slower visual, but the execution time of every visual has been reduced since the first execution.
At this point you have two executions of the same visuals in the Performance Analyzer pane. The first group is related to a Changed page event and the duration is at least two seconds for almost any visual. By selecting one of these visuals you see that most of the time is spent in the “Other” section.
The Duration of each visual is the time spent in three categories:
- DAX Query: every visual generates one or more EVALUATE statements in a single request sent to the Tabular engine. This is the time elapsed between the request sent to the engine and the first row of the result received by Power BI. Certain visuals do not generate any DAX queries. This duration time can be executed in parallel to the actions required by other visuals.
- Visual display: this is the time required to render the visual. This is time spent client-side only and in the single thread of the UI.
- Other: this is the time spent waiting for other operations to complete. This is typically synchronization time between different visuals in the same page and should not be considered as a bottleneck of the visual being analyzed. It is usually waiting time caused by other pending operations performed by other visuals.
If you compare the duration of the first execution of the Sales page with the second execution, you can see that the latter has a shorter duration because it reduced the Other duration of each visual. The reason is that the first execution of visuals and queries to the data model requires an allocation of new structures in memory; it cannot be reduced unless you reduce the number of visuals and the size of the tables of the data model. For this reason, you should focus mainly on the Duration timing generated when you click on Refresh visuals. This way, you ignore the initial loading time of both report and data model.
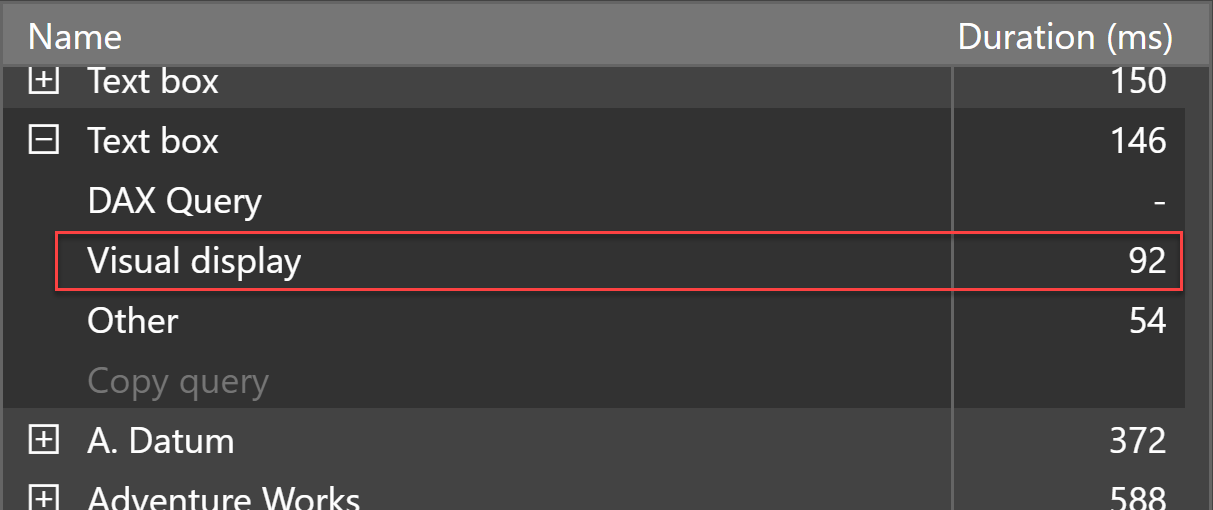
If the duration of Visual display is large, you should consider whether you can improve it by reducing the amount of data included in the visual (e.g. reducing the number of data points in a map or a chart) or by replacing the visual with another one. It is normal to see a longer duration for custom visuals compared to native visuals in Power BI. However, every visual has a memory and CPU cost. The presence of many visuals in a single Power BI page can affect the performance, because the rendering of each visual is a sequential operation executed in a single thread. As you see in the following screenshot, even a simple Text box requires almost 100 milliseconds, so waiting several seconds just because a single page has tens of visuals is not uncommon.
A slow DAX Query has a large duration time and is worth further investigation. The reason can be a slow measure, a slow data model, or a slow data source – especially when using DirectQuery. For example, the following screenshot shows that the slowest visual (Matrix) of the sample report has a very slow DAX Query.
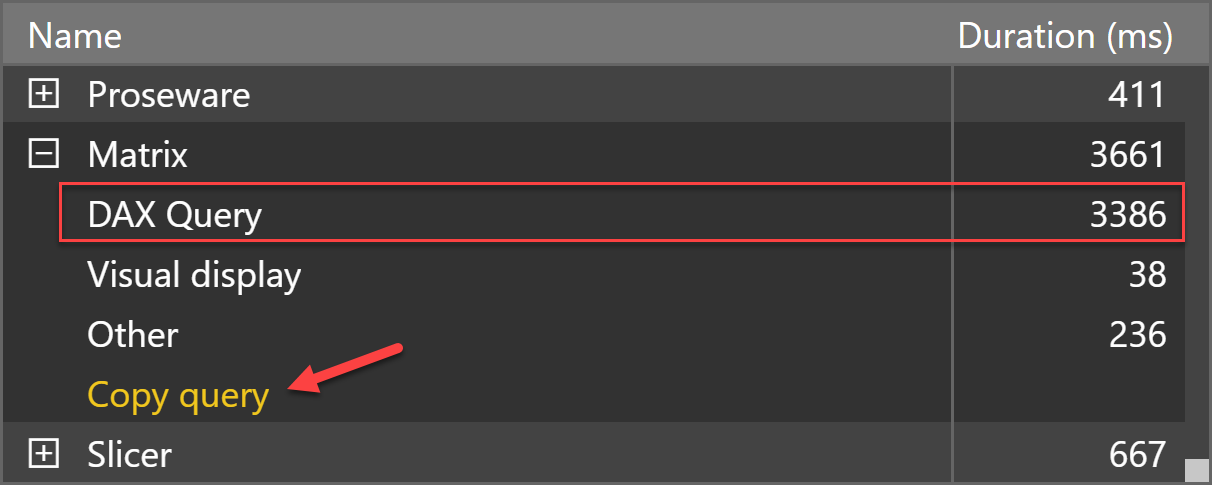
You can copy the query in the clipboard by pressing Copy query. Paste the query in DAX Studio to repeat the execution of the query, this time activating more diagnostic tools using the Query Plan and Server Timings tracing options. Possibly, execute the DAX query in DAX Studio by clearing the cache first – Performance Analyzer does not clear the cache of the Tabular engine before each execution.
This is the code generated to populate the Matrix visual:
EVALUATE
TOPN (
    502,
    SUMMARIZECOLUMNS (
        ROLLUPADDISSUBTOTAL ( 'Product'[Product Name], "IsGrandTotalRowTotal" ),
        "Customers", 'Sales'[Customers]
    ),
    [IsGrandTotalRowTotal], 0,
    [Customers], 0,
    'Product'[Product Name], 1
)
ORDER BY
    [IsGrandTotalRowTotal] DESC,
    [Customers] DESC,
    'Product'[Product Name]
The query invokes the Customers measure, which is defined as follows:
Customers :=
CALCULATE (
    DISTINCTCOUNT ( Sales[CustomerKey] ),
    FILTER ( Sales, Sales[Quantity] > 0 )
)
The goal of this article is not to explain in detail why this specific Customers measure is slow. We can simply mention that using a table filter combined with a DISTINCTCOUNT aggregation creates an inefficient query plan. Modifying the code using a semantically equivalent column filter produces an optimal query plan:
Customers :=
CALCULATE (
    DISTINCTCOUNT ( Sales[CustomerKey] ),
    KEEPFILTERS ( Sales[Quantity] > 0 )
)
By refreshing the visual it is possible to see the significant improvement made to the DAX Query, now running in under 10 milliseconds.
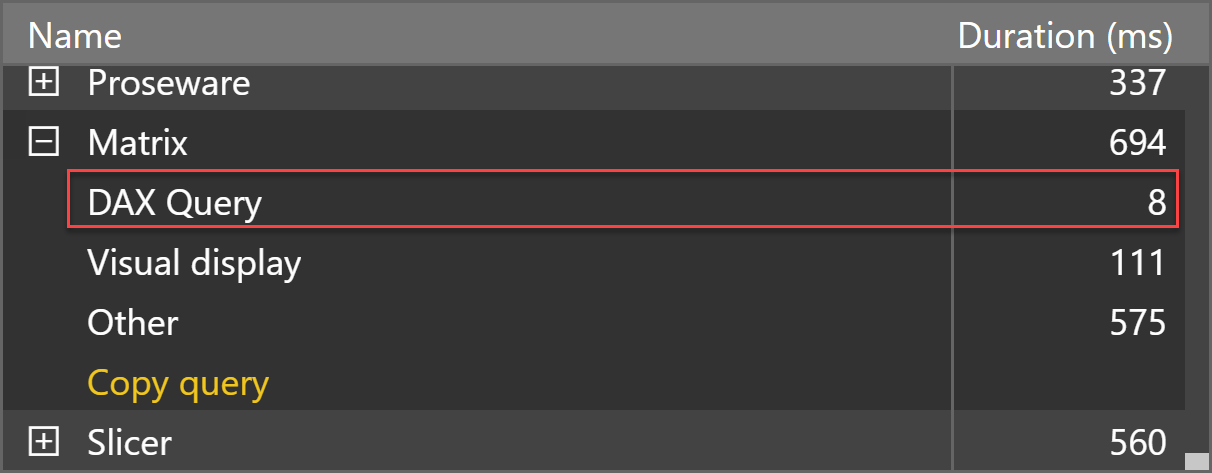
However, the duration of Other has now increased because of the presence of multiple visuals, and Matrix is no longer the slower query in the report page.
Because of its nature, the Duration reported in Other should be ignored. Most of the Other time is not added between visuals and because the total Duration of a visual reports the sum of the three categories, this makes it harder to isolate the slowest running query. It would be a good idea to be able to isolate the Other duration, summing only the DAX Query and Visual display durations for each visual, thus making it faster to identify the main bottleneck in a report.
If you want to learn more about how to optimize your DAX code, you can use the following links:
- Articles about DAX Optimization on SQLBI.com
- Video: DAX Studio – Improved Debug Experience
- Video: My Power BI report is slow: what should I do?
- Video: Power BI DAX optimization examples
Counts the number of distinct values in a column.
DISTINCTCOUNT ( <ColumnName> )