 Marco Russo
The visual filters of Power BI visuals allow the definition of filters to display the top N elements of a list, according to the ranking of a measure. This feature works well to generate a visual level filter containing a sorted list of elements, like a matrix or a bar chart; however, it is not easy to use for more complex layouts requiring the visualization of elements other than the first in a ranking. For example, consider the layout of the following screenshot.
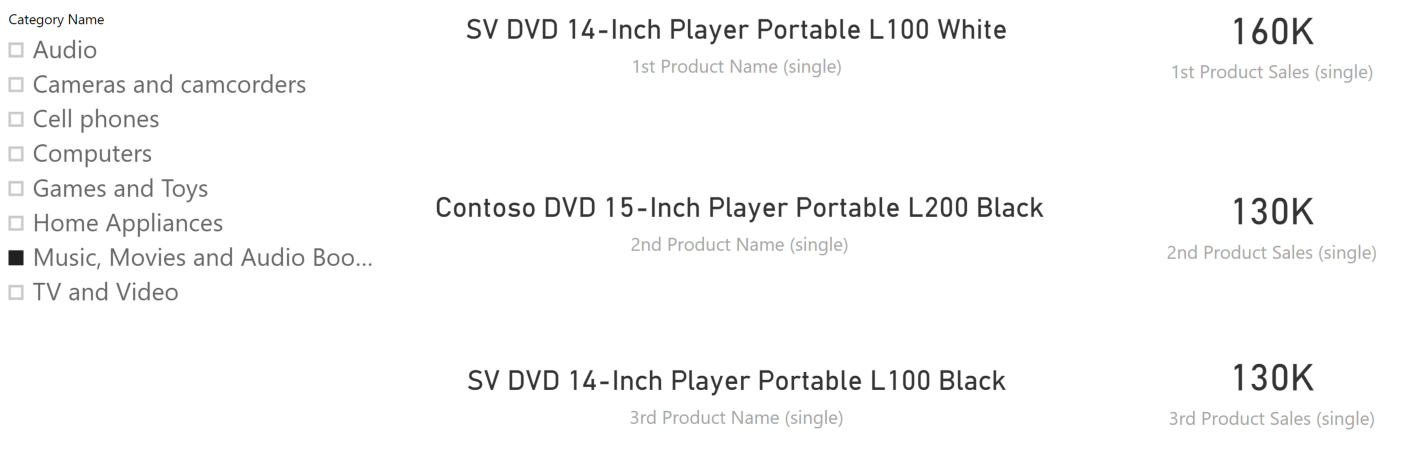
There are three card visuals displaying the name and amount of the top three products ranked by Sales Amount in the current selection. In reality, the second and third product are a tie – they have the same Sales Amount, and yet they are displayed in two different positions using a secondary criteria for sorting in case of ties.
The challenge in this report is that every card visualization generates a different DAX query executing a separate measure. Every visual requires different measures. But their code being very similar, a good structure typically relies on a common measure passing a parameter through the filter context. These are the measures used in the six card visuals of the previous report.
<N> Product Sales (single) :=
CALCULATE (
    [Nth-Product Sales Amount Single],
    RankPosition[RankPosition] = <N>
)

<n> Product Name (single) :=
CALCULATE (
    [Nth-Product Name Single],
    RankPosition[RankPosition] = <N>
)
The complexity of the calculation is in the Nth-Product Name Single and Nth-Product Sales Amount Single measures. These two measures are identical. The only difference is the RETURN statement in the last line, which chooses the return value between the NthProduct and NthAmount variables.
Nth-Product Name Single :=
-- Get the rank position parameter
VAR Nth = [RankPosition Value]
-- List of products to compare with for the ranking
VAR ReferenceProducts = ALLSELECTED ( 'Product'[Product Name] )
-- Compute sales amount for each product
VAR ProductsAndSales =
    ADDCOLUMNS (
        VALUES ( Product[Product Name] ),
        "Rank", RANKX ( ReferenceProducts, [Sales Amount Ranking] )
    )
-- Filter products at the Nth position by using the amount
VAR FilterNthProduct = FILTER ( ProductsAndSales, [Rank] = Nth )
-- Get the name of one of the Nth products (in case of ties, only show one)
VAR NthProduct = MINX ( FilterNthProduct, Product[Product Name] )
-- Get the value of the Nth products (it is the same in case of ties)
VAR NthAmount = MINX ( FilterNthProduct, [Sales Amount] )
-- Return either NthProduct or NthAmount
RETURN NthProduct
Nth-Product Sales Amount Single :=
-- Get the rank position parameter
VAR Nth = [RankPosition Value]
-- List of products to compare with for the ranking
VAR ReferenceProducts = ALLSELECTED ( 'Product'[Product Name] )
-- Compute sales amount for each product
VAR ProductsAndSales =
    ADDCOLUMNS (
        VALUES ( Product[Product Name] ),
        "Rank", RANKX ( ReferenceProducts, [Sales Amount Ranking] )
    )
-- Filter products at the Nth position by using the amount
VAR FilterNthProduct = FILTER ( ProductsAndSales, [Rank] = Nth )
-- Get the name of one of the Nth products (in case of ties, only show one)
VAR NthProduct = MINX ( FilterNthProduct, Product[Product Name] )
-- Get the value of the Nth products (it is the same in case of ties)
VAR NthAmount = MINX ( FilterNthProduct, [Sales Amount] )
-- Return either NthProduct or NthAmount
RETURN NthAmount
Unfortunately, DAX does not offer a universal way to share the code generating tables between different measures. Analysis Services Tabular provides access to DETAILROWS as a workaround, but this feature cannot be defined in a Power BI or Power Pivot data model as of now.
Indeed, the code of the two measures is nearly identical. The formulas follow these steps, identified by the variable name assigned in each step:
- Nth: Acquire the parameter of the measure, defined by the RankPositionValue measure. RankPositionValue reads the current selection of RankPosition[RankPosition]. The RankPosition table can be created with the New Parameter feature in Power BI, which also generates the corresponding RankPosition Value measure.
- ReferenceProducts: Obtain a unique list of the elements to rank. The use of ALLSELECTED enables the use of the measure in a matrix or in a complex visualization, where the measure result is used to highlight a particular rank position.
- ProductsAndSales: For each element, the corresponding ranking is stored into a new column. The assumption for this measure is that the Sales Amount Ranking measure evaluated for each product returns a unique value. This measure is explained later in more details.
- FilterNthProduct: This restricts the previous table to a single row, or to multiple rows in case of ties. However, if the Sales Amount Ranking measure guarantees the uniqueness of the results for different elements, there are no ties possible and the result always has a single row.
- Nth Product/Nth Amount: This last step retrieves the corresponding value for the Nth position, assuming there is a single row in FilterNthProduct.
As described in the steps above, there is a strong assumption about the Sales Amount Ranking measure, which never attributes the same value to two different products even if there is a tie. In this implementation, the assumption is that the Sales Amount measure never returns more than two decimals. That way, the integer ProductKey divided by 1,000,000 provides a fraction that makes the amount of every product name unique.
Sales Amount Ranking :=
[Sales Amount] + CALCULATE ( SELECTEDVALUE ( 'Product'[ProductKey] ) ) / 1000000
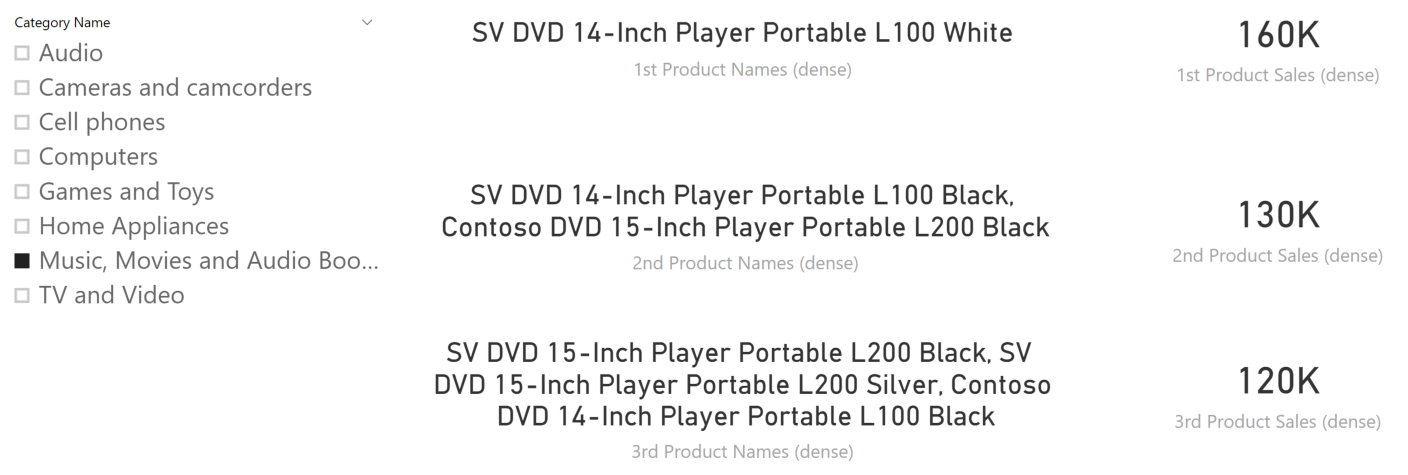
The assumption that a value is unique might be impossible; or, the requirement could be to manage ties in the report. In this case, the report should produce the following result, where each position can have more than one product name in case they have the same Sales Amount.
The measures used in this version of the report have a slightly different definition, referencing other common measures.
<N> Product Sales (dense) :=
CALCULATE (
    [Nth-Product Sales Amount Dense],
    RankPosition[RankPosition] = <N>
)

<N> Product Name (dense) :=
CALCULATE (
    [Nth-Product Name Dense],
    RankPosition[RankPosition] = <N>
)
The underlying Nth-Product Name Dense and Nth-Product Sales Amount Dense measures are similar to the corresponding Single counterpart, with a different definition for ProductsAndSales and NthProduct steps.
Nth-Product Names Dense :=
-- Get the rank position parameter
VAR Nth = [RankPosition Value]
-- List of products to compare with for the ranking
VAR ReferenceProducts = ALLSELECTED ( 'Product'[Product Name] )
-- Compute sales amount for each product
VAR ProductsAndSales =
    ADDCOLUMNS (
        VALUES ( Product[Product Name] ),
        "Rank", RANKX (
            ReferenceProducts,
            [Sales Amount],
            [Sales Amount],
            DESC,
            Dense
        )
    )
-- Filter products in the Nth position by using the amount
VAR FilterNthProduct = FILTER ( ProductsAndSales, [Rank] = Nth )
-- Get the name of one of the Nth products (in case of ties, only show one)
VAR NthProduct = CONCATENATEX ( FilterNthProduct, Product[Product Name], ", " )
-- Get the value of the Nth products (it is the same in case of ties)
VAR NthAmount = MINX ( FilterNthProduct, [Sales Amount] )
-- Return either NthProduct or NthAmount
RETURN NthProduct
Nth-Product Sales Amount Dense :=
-- Get the rank position parameter
VAR Nth = [RankPosition Value]
-- List of products to compare with for the ranking
VAR ReferenceProducts = ALLSELECTED ( 'Product'[Product Name] )
-- Compute sales amount for each product
VAR ProductsAndSales =
    ADDCOLUMNS (
        VALUES ( Product[Product Name] ),
        "Rank", RANKX (
            ReferenceProducts,
            [Sales Amount],
            [Sales Amount],
            DESC,
            Dense
        )
    )
-- Filter products in the Nth position by using the amount
VAR FilterNthProduct = FILTER ( ProductsAndSales, [Rank] = Nth )
-- Get the name of one of the Nth products (in case of ties, only show one)
VAR NthProduct = CONCATENATEX ( FilterNthProduct, Product[Product Name], ", " )
-- Get the value of the Nth products (it is the same in case of ties)
VAR NthAmount = MINX ( FilterNthProduct, [Sales Amount] )
-- Return either NthProduct or NthAmount
RETURN NthAmount
Again, the code of the two measures is pretty much identical and follows these steps, identified by the variable name assigned in each step:
- ProductsAndSales: For each element, the corresponding rank is stored into a new column. The measure used for the ranking is Sales Amount, which can produce ties. The last parameter of RANKX is Dense, which generates a sequential ranking number even though there are ties in a previous position.
- FilterNthProduct: The code is identical to its Single counterpart. The difference is the result of the previous step, ProductsAndSales, which may include ties. In case of ties, the result of FilterNthProduct can include more than one row.
- Nth Product: In case of ties, product names are concatenated into a single string. The code of NthAmount is identical to its Single counterpart; indeed, in case of ties that value is the same for all the products sharing the same ranking position.
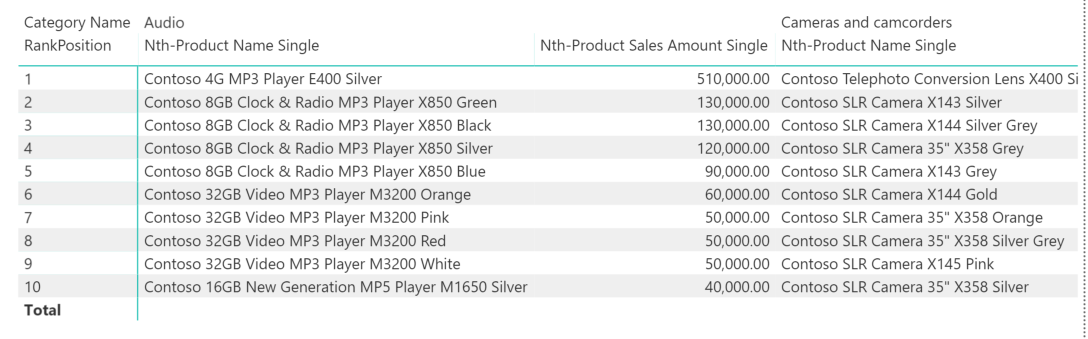
Thanks to the use of ALLSELECTED to retrieve the list of product names to rank, the same measures can be used in a Matrix or Chart visualization, putting the RankPosition parameter on one of the axes. The following example is a report displaying the first 10 products including ties. This visualization would be possible using the Top N filter of a Power BI visualization, also resulting in better performance. The only difference is the management of ties, which would produce more than 10 rows in Power BI if the 10th position had ties.
From a performance point of view, the approach described in this article is more expensive than the standard Top N filter available in a Power BI visualization. The more elements to rank, the higher the cost. However, this higher cost is caused by the multiple evaluations of the same measure using different parameters. This technique should only be used to display a very limited number of elements in a report – also making sure that the performance cost with a real set of data is considered acceptable from a user experience point of view.
Returns the table data corresponding to the DetailRows expression defined on the specified Measure. If a DetailRows expression is not defined then the entire table to which the Measure belongs is returned.
DETAILROWS ( <Measure> )
Returns all the rows in a table, or all the values in a column, ignoring any filters that might have been applied inside the query, but keeping filters that come from outside.
ALLSELECTED ( [<TableNameOrColumnName>] [, <ColumnName> [, <ColumnName> [, … ] ] ] )
Returns the rank of an expression evaluated in the current context in the list of values for the expression evaluated for each row in the specified table.
RANKX ( <Table>, <Expression> [, <Value>] [, <Order>] [, <Ties>] )