 Marco Russo
UPDATE 2021-09-27: A new article about this feature updated for Power BI is available here: Controlling drillthrough in Excel PivotTables connected to Power BI or Analysis Services.
The Detail Rows Expression property
The Analysis Services model in compatibility level 1400 introduced Detail Rows Expression, a new property available for every measure. When you select a measure in SQL Server Data Tools, you can see this property in the Properties pane.
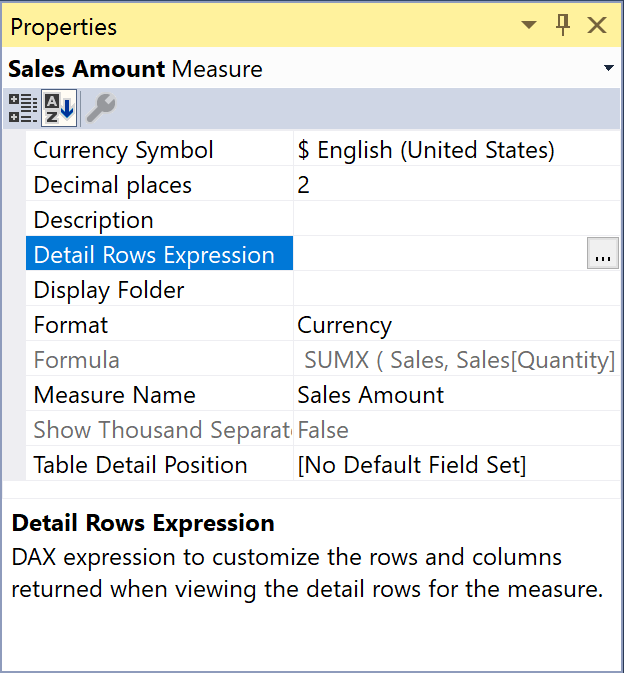
You can edit the DAX expression of Detail Rows Expression by clicking the button on the right of the property value. This action opens the DAX Editor window.
The client asking for a drillthrough action over a measure that has Detail Rows Expression defined will receive the result of the DAX table expression executed in the filter context of that measure. For example, an Excel user can request the drillthrough by double-clicking the Sales Amount measure in a PivotTable, or by selecting the Show Details menu item in the context menu.
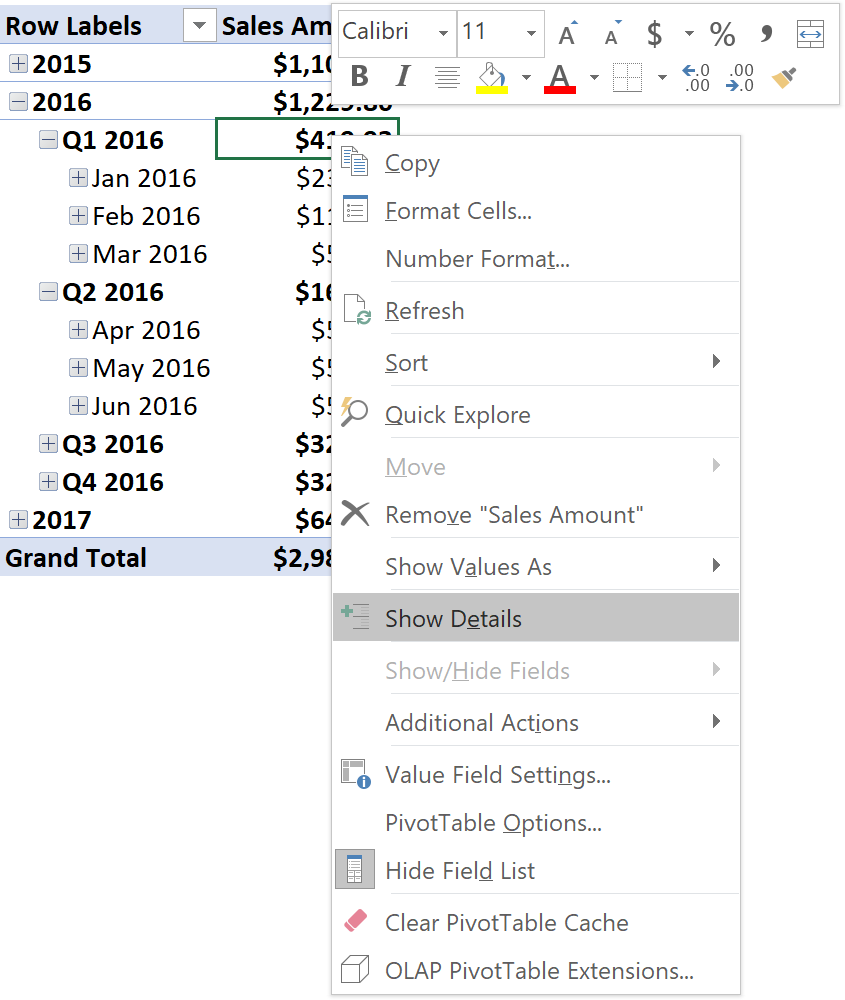
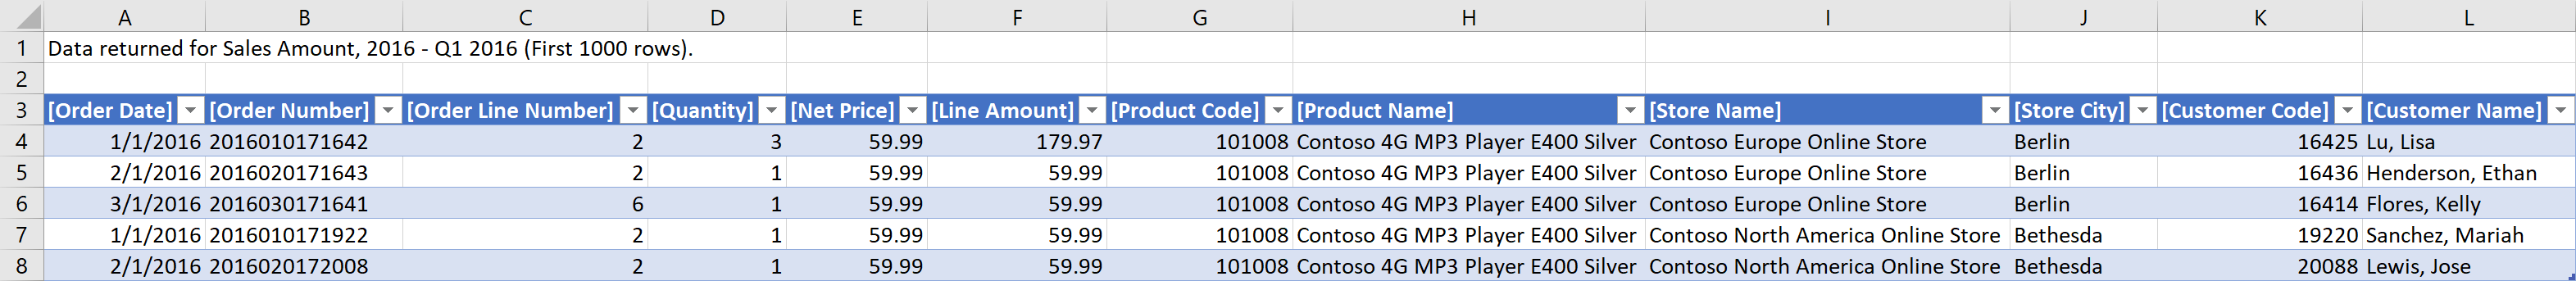
The result provided in a new Excel table is the result of the Detail Rows Expression executed in the filter context of the original measure – Q1 2016 in the following example.
You can also define a Default Detail Rows Expression on a table. That expression is used for all the measures defined in the same table that do not have a specific Detail Rows Expression defined.
The remaining part of this article shows several examples of DAX code in a Detail Rows Expression. All the examples are based on a SSAS Tabular data model that you can open and download in Visual Studio using an updated version of SQL Server Data Tools (SSDT).
The DETAILROWS function
The DETAILROWS function returns a table obtained by evaluating the Detail Rows Expression of the measure passed as an argument. This is a very powerful way to reuse an existing expression for a measure. Its syntax is:
DETAILROWS ( <measure_expression> )
Pay attention to the syntax. DETAILROWS is a table function and can be combined with any other DAX expression that allows a table. However, the argument of DETAILROWS should be a single measure and Visual Studio will return a warning if you provide another type of argument. If you use a more complex expression and you deploy it the user will get an error saying “An unexpected exception occurred.” at query time.
Customizing columns
The model contains the following base measures:
Sales[Sales Amount] := SUMX ( Sales, Sales[Quantity] * Sales[Net Price] )

Sales[Cost] := SUMX ( Sales, Sales[Quantity] * Sales[Unit Cost] )

Sales[Margin] := [Sales Amount] - [Cost]
When not defined, the default Detail Rows Expression is the same table that contains a measure, so the result would include all the columns of the Sales table and all the rows visible in the filter context. For each of the measures above, we are interested in customizing only the columns of the drillthrough result.
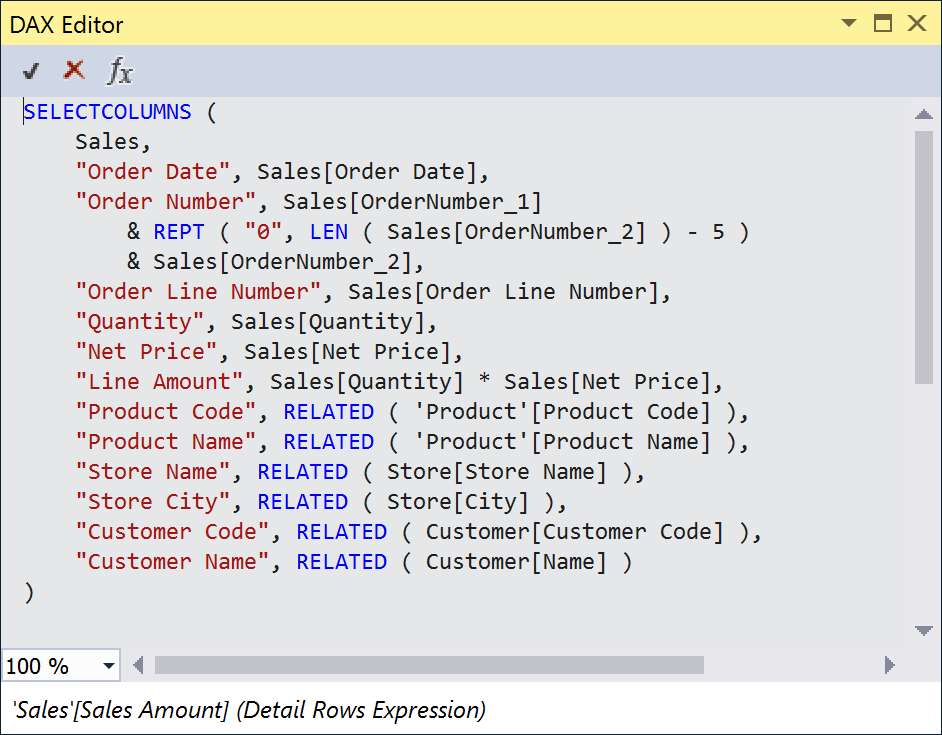
The drillthrough result for the Sales Amount measure should include readable names of product, store, and customer, rather than internal keys that are useful for a database but meaningless for the end user. The SELECTCOLUMNS function in DAX allows us to select the columns to display, customizing the expression shown in each one. The only numeric columns considered interesting for the Sales Amount measure are Quantity and Net Price. A column called Line Amount also displays the result of the multiplication of these two numbers.
SELECTCOLUMNS (
    Sales,
    "Order Date", Sales[Order Date],
    "Order Number", Sales[OrderNumber_1]
        & REPT ( "0", LEN ( Sales[OrderNumber_2] ) - 5 )
        & Sales[OrderNumber_2],
    "Order Line Number", Sales[Order Line Number],
    "Quantity", Sales[Quantity],
    "Net Price", Sales[Net Price],
    "Line Amount", Sales[Quantity] * Sales[Net Price],
    "Product Code", RELATED ( 'Product'[Product Code] ),
    "Product Name", RELATED ( 'Product'[Product Name] ),
    "Store Name", RELATED ( Store[Store Name] ),
    "Store City", RELATED ( Store[City] ),
    "Customer Code", RELATED ( Customer[Customer Code] ),
    "Customer Name", RELATED ( Customer[Name] )
)
The drillthrough result for the Cost measure only includes data about the product sold and its manufacturer. The numeric columns are Quantity, Unit Cost, and Line Cost – which is the result of the multiplication between the first two.
SELECTCOLUMNS (
    Sales,
    "Order Date", Sales[Order Date],
    "Order Number", Sales[OrderNumber_1]
        & REPT ( "0", LEN ( Sales[OrderNumber_2] ) - 5 )
        & Sales[OrderNumber_2],
    "Order Line Number", Sales[Order Line Number],
    "Quantity", Sales[Quantity],
    "Unit Cost", Sales[Unit Cost],
    "Line Cost", Sales[Quantity] * Sales[Unit Cost],
    "Product Code", RELATED ( 'Product'[Product Code] ),
    "Product Name", RELATED ( 'Product'[Product Name] ),
    "Manufacturer", RELATED ( 'Product'[Manufacturer] )
)
The Margin measure can include all the columns used by both Sales Amount and Cost, adding a column that calculates the margin of each single transaction. In this case, we can use DETAILROWS to get the drillthrough result of the two measures, Sales Amount and Cost.
ADDCOLUMNS (
    NATURALINNERJOIN (
        DETAILROWS ( [Sales Amount] ),
        DETAILROWS ( [Cost] )
    ),
    "Line Margin", [Line Amount] - [Line Cost]
)
The NATURALINNERJOIN function joins the result provided for the Sales Amount and Cost measures, automatically removing duplicated columns that would be present in both results. The ADDCOLUMNS function simply adds the Line Margin column reusing the Line Amount and Line Cost columns obtained by the previous DETAILROWS functions.
Customizing rows selection
The model includes more advanced measures comparing data over time:
Sales[Sales YTD] :=
CALCULATE (
    [Sales Amount],
    DATESYTD  ( 'Date'[Date] )
)

Sales[Sales PY] :=
CALCULATE (
    [Sales Amount],
    SAMEPERIODLASTYEAR ( 'Date'[Date] )
)

Sales[Sales YOY] :=
[Sales Amount] - [Sales PY]

Sales[YOY %] :=
DIVIDE ( [Sales YOY], [Sales PY] )
When there is a change in the filter context of a measure, you want to apply the same filter context to the drillthrough result. Whenever you apply a different filter context to an existing measure, you want to use the DETAILROWS function within a CALCULATETABLE that applies the filter context applied in the measure expression.
For example, the Detail Rows Expression for the Sales YTD measure is the following:
CALCULATETABLE (
    DETAILROWS ( [Sales Amount] ),
    DATESYTD  ( 'Date'[Date] )
)
Also the Sales PY measure follows a similar pattern, applying the same filter context as the one used in the original measure:
CALCULATETABLE (
    DETAILROWS ( [Sales Amount] ),
    SAMEPERIODLASTYEAR ( 'Date'[Date] )
)
The Sales YOY measure brings up a challenge. What is the right set of rows to display? It is not possible to run a comparison row by row if you look at the transaction level, so it seems reasonable to include all the rows returned by the Detail Rows Expression of both Sales Amount and Sales PY. The UNION function in this case does the job of appending one set of rows to the other.
UNION (
    DETAILROWS ( [Sales Amount] ),
    DETAILROWS ( [Sales PY] )
)
The YOY % measure simply replicates the expression of Sales YOY. However, instead of copying the UNION function, it is smarter to simply reference the previous expression.
DETAILROWS ( [Sales YOY] )
Performance considerations
It is a good idea to avoid using measures and context transitions in the DAX expressions used in Detail Rows Expression properties. Typically, the drillthrough happens on large tables. The Excel client limits the result to the first 1,000 rows by default. However, the internal evaluation could be made for all the rows of the table. A context transition would be extremely expensive in terms of memory and processing time. For this reason, the formulas used in this article never use measures to compute Line Amount, Line Cost, and Line Margin.
Conclusion
The Detail Rows Expression property available in measures of a Tabular model is a very powerful tool to enrich the user experience of drillthrough in Excel. Hopefully, the same feature will be available in Power BI in the near future. At the moment, only Excel users can take advantage of this property.
Returns the table data corresponding to the DetailRows expression defined on the specified Measure. If a DetailRows expression is not defined then the entire table to which the Measure belongs is returned.
DETAILROWS ( <Measure> )
Returns a table with selected columns from the table and new columns specified by the DAX expressions.
SELECTCOLUMNS ( <Table> [[, <Name>], <Expression> [[, <Name>], <Expression> [, … ] ] ] )
Joins the Left table with right table using the Inner Join semantics.
NATURALINNERJOIN ( <LeftTable>, <RightTable> )
Returns a table with new columns specified by the DAX expressions.
ADDCOLUMNS ( <Table>, <Name>, <Expression> [, <Name>, <Expression> [, … ] ] )
Evaluates a table expression in a context modified by filters.
CALCULATETABLE ( <Table> [, <Filter> [, <Filter> [, … ] ] ] )
Returns the union of the tables whose columns match.
UNION ( <Table>, <Table> [, <Table> [, … ] ] )