 Alberto Ferrari
UPDATE 2020-11-10: You can find a more complete detailed and optimized example for this scenario in the DAX Patterns: Like-for-like comparison article on daxpatterns.com.
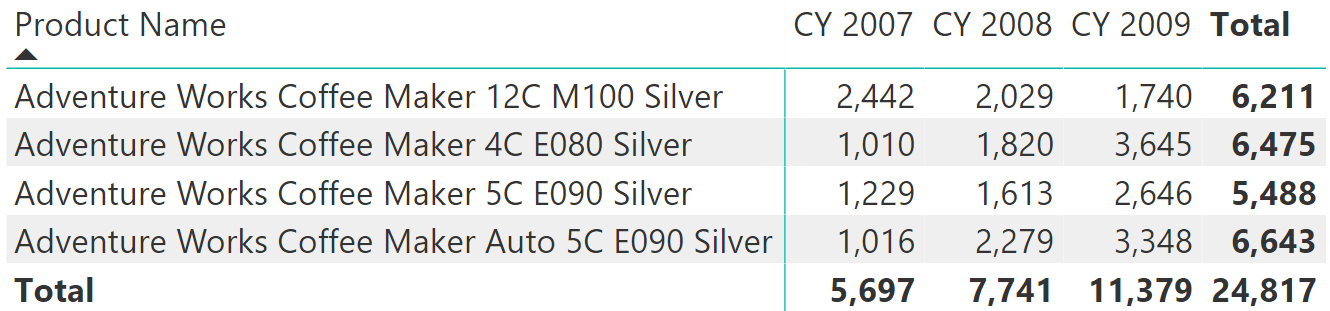
Consider a report of sales volume for a selection of products, as in the following figure:
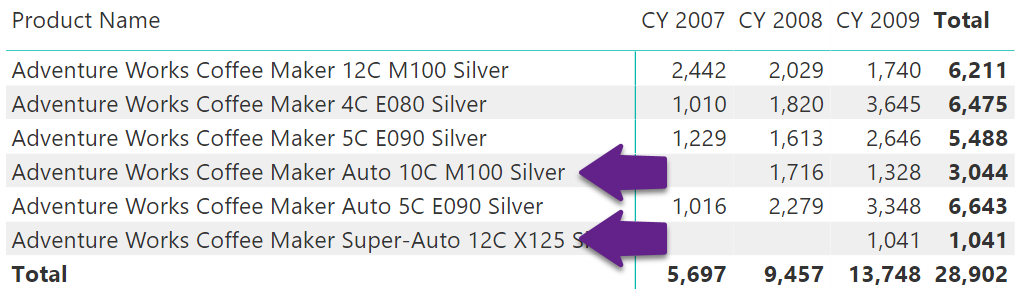
The numbers are fine. However, considering the column totals and comparing 13,748 (total for 2009) with 5,697 (total for 2007) shows a huge increase in sales. Nevertheless, two products out of the set were introduced later than 2007: The Auto 10C M100 Silver was introduced in 2008, and the Super-Auto 12C started selling only in 2009. Overall, the comparison is correct – but users might want to restrict the comparison to only the products that were available right from the year 2007, so as to compare sales of the same set of products over the years, and ignore products introduced later.
As a pattern, this is a simplified version of the “same store” pattern, which requires more complex code. However, the code of this version of the calculation is pretty straightforward. The report to produce is the following one:

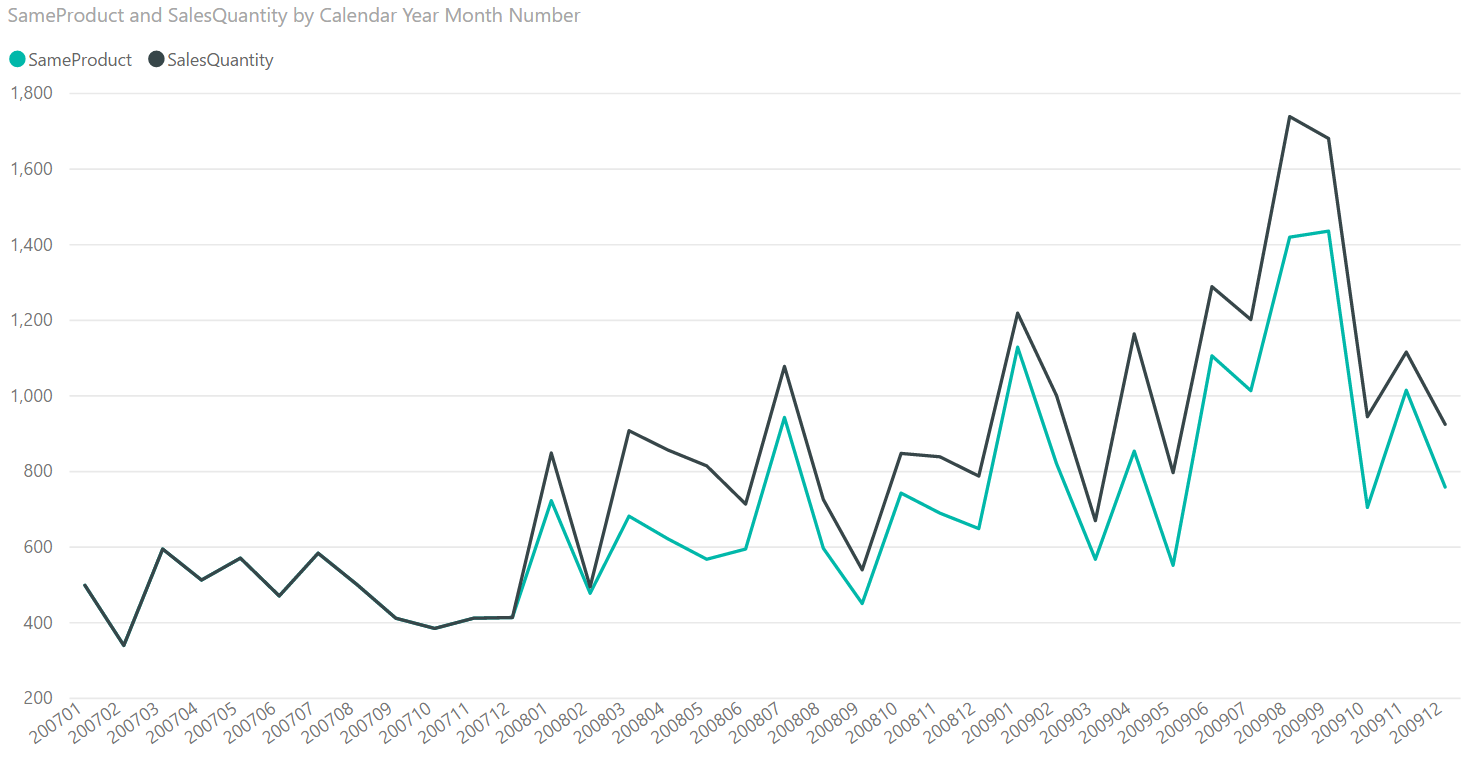
The products shown all started selling in 2007. The other products have been removed from the list. The following chart helps better understand the calculation. It shows the two calculations on the same line chart sliced by year and month: SameProduct calculates sales volumes for products present all the way through, SalesQuantity takes into account products added to the range later. In the first year the two measures show the same result – they overlap. Starting from the second year, SameProduct is lower than SalesQuantity, as it considers fewer products:
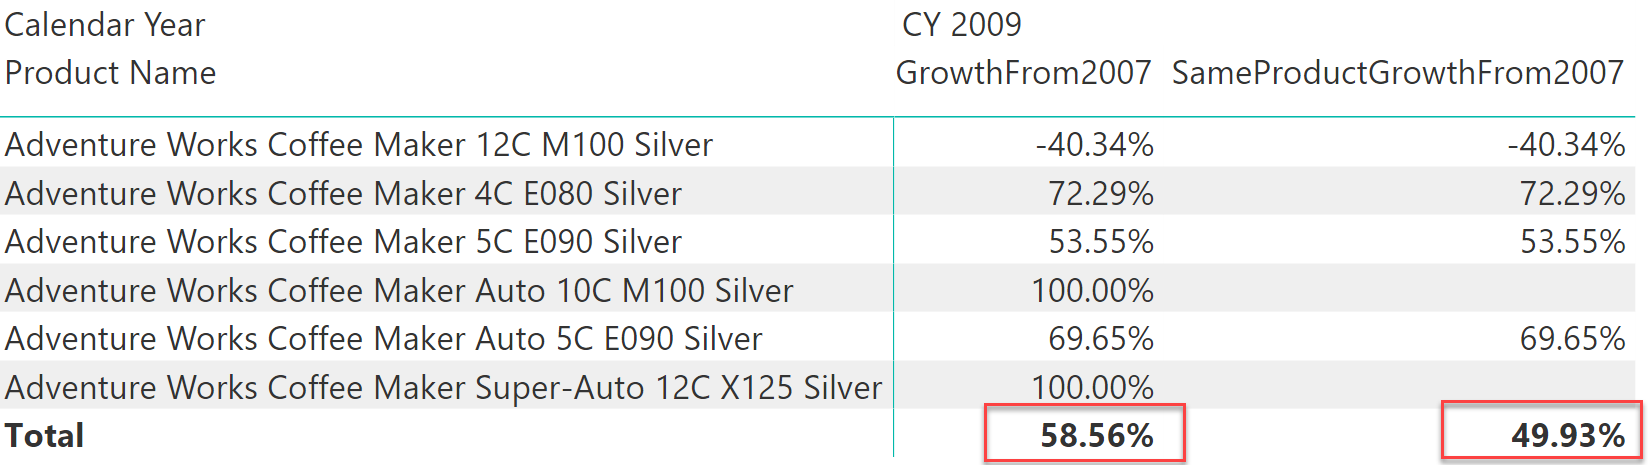
If the report contains the sales volume, it gives a good feeling of the numbers. However, if it only shows the growth in percentage, then the actual numbers are hidden and the problem becomes more evident:
To achieve the result, the full algorithm is split into smaller steps:
- First, computing the year to consider as a starting point. In this scenario, it is 2007. This is not as easy as taking the MIN of the date, as there might not be any product sales on the first selected date . Thus, the first step is to search for the first date in which any of the selected products was sold.
- Once the first year is obtained, the second step is to find the list of all the products that sold in that year.
- Finally, with the list of products available, forcing the filter on the Product table – ignoring any product which does not belong to the list while computing the current year sales volume.
As it is often the case with complex formulas, it is better to solve one step at a time and debug the code by using variables during the writing process.
Finding the first year requires taking the minimum value of Date[Calendar Year] where some of the products were sold. The issue is that in any given cell of the report, there is already a filter on both the calendar year and the product. Thus these filters must be removed, and the calculation produced in the filter context of the report. ALLSELECTED is the function to use here.
Nevertheless, after getting rid of the filter on Date the calculation exposes dates for which there are no sales. Thus, the reader would make the Sales table filter the Date table, so that only dates with sales remain visible in the filter context.
The following measure computes the first year when sales occurred:
FirstYear =
VAR FirstYer =
CALCULATE (
    MIN ( 'Date'[Calendar Year] ),  -- Take the min of Calendar Year
    CROSSFILTER (
        Sales[OrderDateKey],        -- Making Sales filter Date
        'Date'[DateKey],            -- activating bidirectional filters
        BOTH                        -- between Sales and Date
    ),
    ALLSELECTED ( )                 -- Restore the report filter context
)
RETURN
    FirstYer
It is worth noticing that the expression defines a variable and then just returns its value. This is a common practice when authoring complex code. To test partial results of a complex formula, one would start by defining it and just returning its value. This way, later on it is possible to focus on more complex problems trusting that the variable actually computes the correct number.
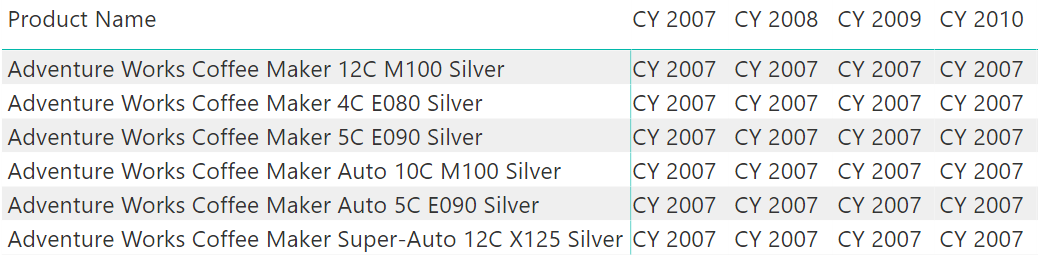
The following report shows that the FirstYear measure computes the correct value:
After computing the first year, it is time to move on to the next step, that is, finding the products that started selling that year. To obtain the result, we restrict the dates to the first year and then let Sales filter Products, activating bidirectional filtering between Sales and Product. The result of this second step is a table. Again, to test its result, we return the COUNTROWS of that table in a report:
NumOfProducts =
VAR FirstYer =
CALCULATE (
    MIN ( 'Date'[Calendar Year] ),    -- Take the min of Calendar Year
    CROSSFILTER (
        Sales[OrderDateKey],          -- Making Sales filter Date
        'Date'[DateKey],              -- activating bidirectional filters
        BOTH                          -- between Sales and Date
    ),
    ALLSELECTED ( )                   -- Restore the report filter context
)
VAR ProductsInFirstYear =
CALCULATETABLE(
    'Product',                        -- Return the Product table
    'Date'[Calendar Year] = FirstYer, -- Where the year is only the first year
    CROSSFILTER (
        Sales[ProductKey],            -- Making Sales filter Product
        'Product'[ProductKey],        -- activating bidirectional filters
        BOTH                          -- between Sales and Product
    ),
    ALL ( 'Date' )
)
RETURN
    COUNTROWS ( ProductsInFirstYear ) -- Return the number of products
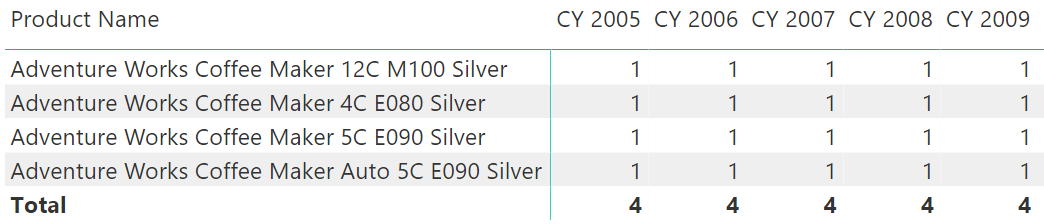
The expression returns the COUNTROWS of the variable for testing purposes. The result is – as expected – the same number through all the years, only for the products that sold in the first year:
The final step is, indeed, the simplest one. In fact, after storing the correct set of products into the ProductsInFirstYear variable, the variable itself can be used as a filter in a CALCULATE statement to restrict the Product table to only those products. Thus, the final version of the measure is:
SameProduct =
VAR FirstYer =
CALCULATE (
    MIN ( 'Date'[Calendar Year] ),    -- Take the min of Calendar Year
    CROSSFILTER (
        Sales[OrderDateKey],          -- Making Sales filter Date
        'Date'[DateKey],              -- activating bidirectional filters
        BOTH                          -- between Sales and Date
    ),
    ALLSELECTED ( )                   -- Restore the report filter context
)
VAR ProductsInFirstYear =
CALCULATETABLE(
    'Product',                        -- Return the Product table
    'Date'[Calendar Year] = FirstYer, -- Where the year is only the first year
    CROSSFILTER (
        Sales[ProductKey],            -- Making Sales filter Product
        'Product'[ProductKey],        -- activating bidirectional filters
        BOTH                          -- between Sales and Product
    ),
    ALL ( 'Date' )
)
RETURN
CALCULATE (
    [SalesQuantity],
    ProductsInFirstYear
)
The result is now the sales volume, only for the products that were selling right from the first year:
Conclusions
The technique that consists of obtaining a filter based on a date and then applying it through different time periods can be extended to compute different values, by using set functions (UNION, EXCEPT, INTERSECT) to build the correct set, and then using CALCULATE to apply the filter to the model.
Returns the smallest value in a column, or the smaller value between two scalar expressions. Ignores logical values. Strings are compared according to alphabetical order.
MIN ( <ColumnNameOrScalar1> [, <Scalar2>] )
Returns all the rows in a table, or all the values in a column, ignoring any filters that might have been applied inside the query, but keeping filters that come from outside.
ALLSELECTED ( [<TableNameOrColumnName>] [, <ColumnName> [, <ColumnName> [, … ] ] ] )
Counts the number of rows in a table.
COUNTROWS ( [<Table>] )
Evaluates an expression in a context modified by filters.
CALCULATE ( <Expression> [, <Filter> [, <Filter> [, … ] ] ] )
Returns the union of the tables whose columns match.
UNION ( <Table>, <Table> [, <Table> [, … ] ] )
Returns the rows of left-side table which do not appear in right-side table.
EXCEPT ( <LeftTable>, <RightTable> )
Returns the rows of left-side table which appear in right-side table.
INTERSECT ( <LeftTable>, <RightTable> )